


 Abstract
 HTML
HTML Reference
 Related
 PDF
PDF


-
Cross section data for charged particle emission reactions induced by fast neutrons are important in basic nuclear physics [1–5], nuclear astrophysics [6–8], and nuclear engineering [9]. Samarium isotopes are relatively high–yield fission products in nuclear reactors, making the accurate knowledge of their neutron cross sections essential for nuclear technology applications. The (n,α) reactions, in particular, are gas–producing and exothermic. The helium gas accumulated in the material causes [10] serious embrittlement problems.
Natural samarium is composed of five stable isotopes:144Sm,149Sm,150Sm,152Sm, and154Sm, together with two extremely long–lived radioisotopes,147Sm (half–life 1.06×10¹¹years) and148Sm (7×10¹⁵years with abundance 11.24%).
Previously, we measured the (n,α) reaction cross-sections in the MeV energy region for the isotopes of144Sm,147Sm, and149Sm [11–16].
Currently, there are no cross section data for the148Sm(n,α)145Nd reaction in the MeV neutron energy range. Existing evaluations in nuclear data libraries, such as ENDF/B–VIII.0 [17], ENDF/B–VII.1 [18], ENDF/B– VIII.1 [19], and JEFF–3.3 [20], provide identical evaluation results, while JENDL–5.0 [21] and ROSFOND– 2010 [22] present different values. The ROSFOND–2010 evaluation differs from the latest version of the ENDF library, showing a discrepancy of approximately 1.5 times in our investigated neutron energy region.
In this paper, we present the first experimental measurements of the cross section for the148Sm(n,α)145Nd reaction in the 4.8–5.3 MeV neutron energy range. Our measurements aim to resolve existing inconsistencies between various evaluated cross section data libraries. Additionally, we compare the experimental results with theoretical calculations using the TALYS–1.96 [23] code. By providing reliable cros-section measurements for the148Sm(n,α)145Nd reaction, this work contributes to more accurate nuclear evaluations, enhancing our understanding of nuclear energy technology, nuclear physics, and stellar nucleosynthesis.
-
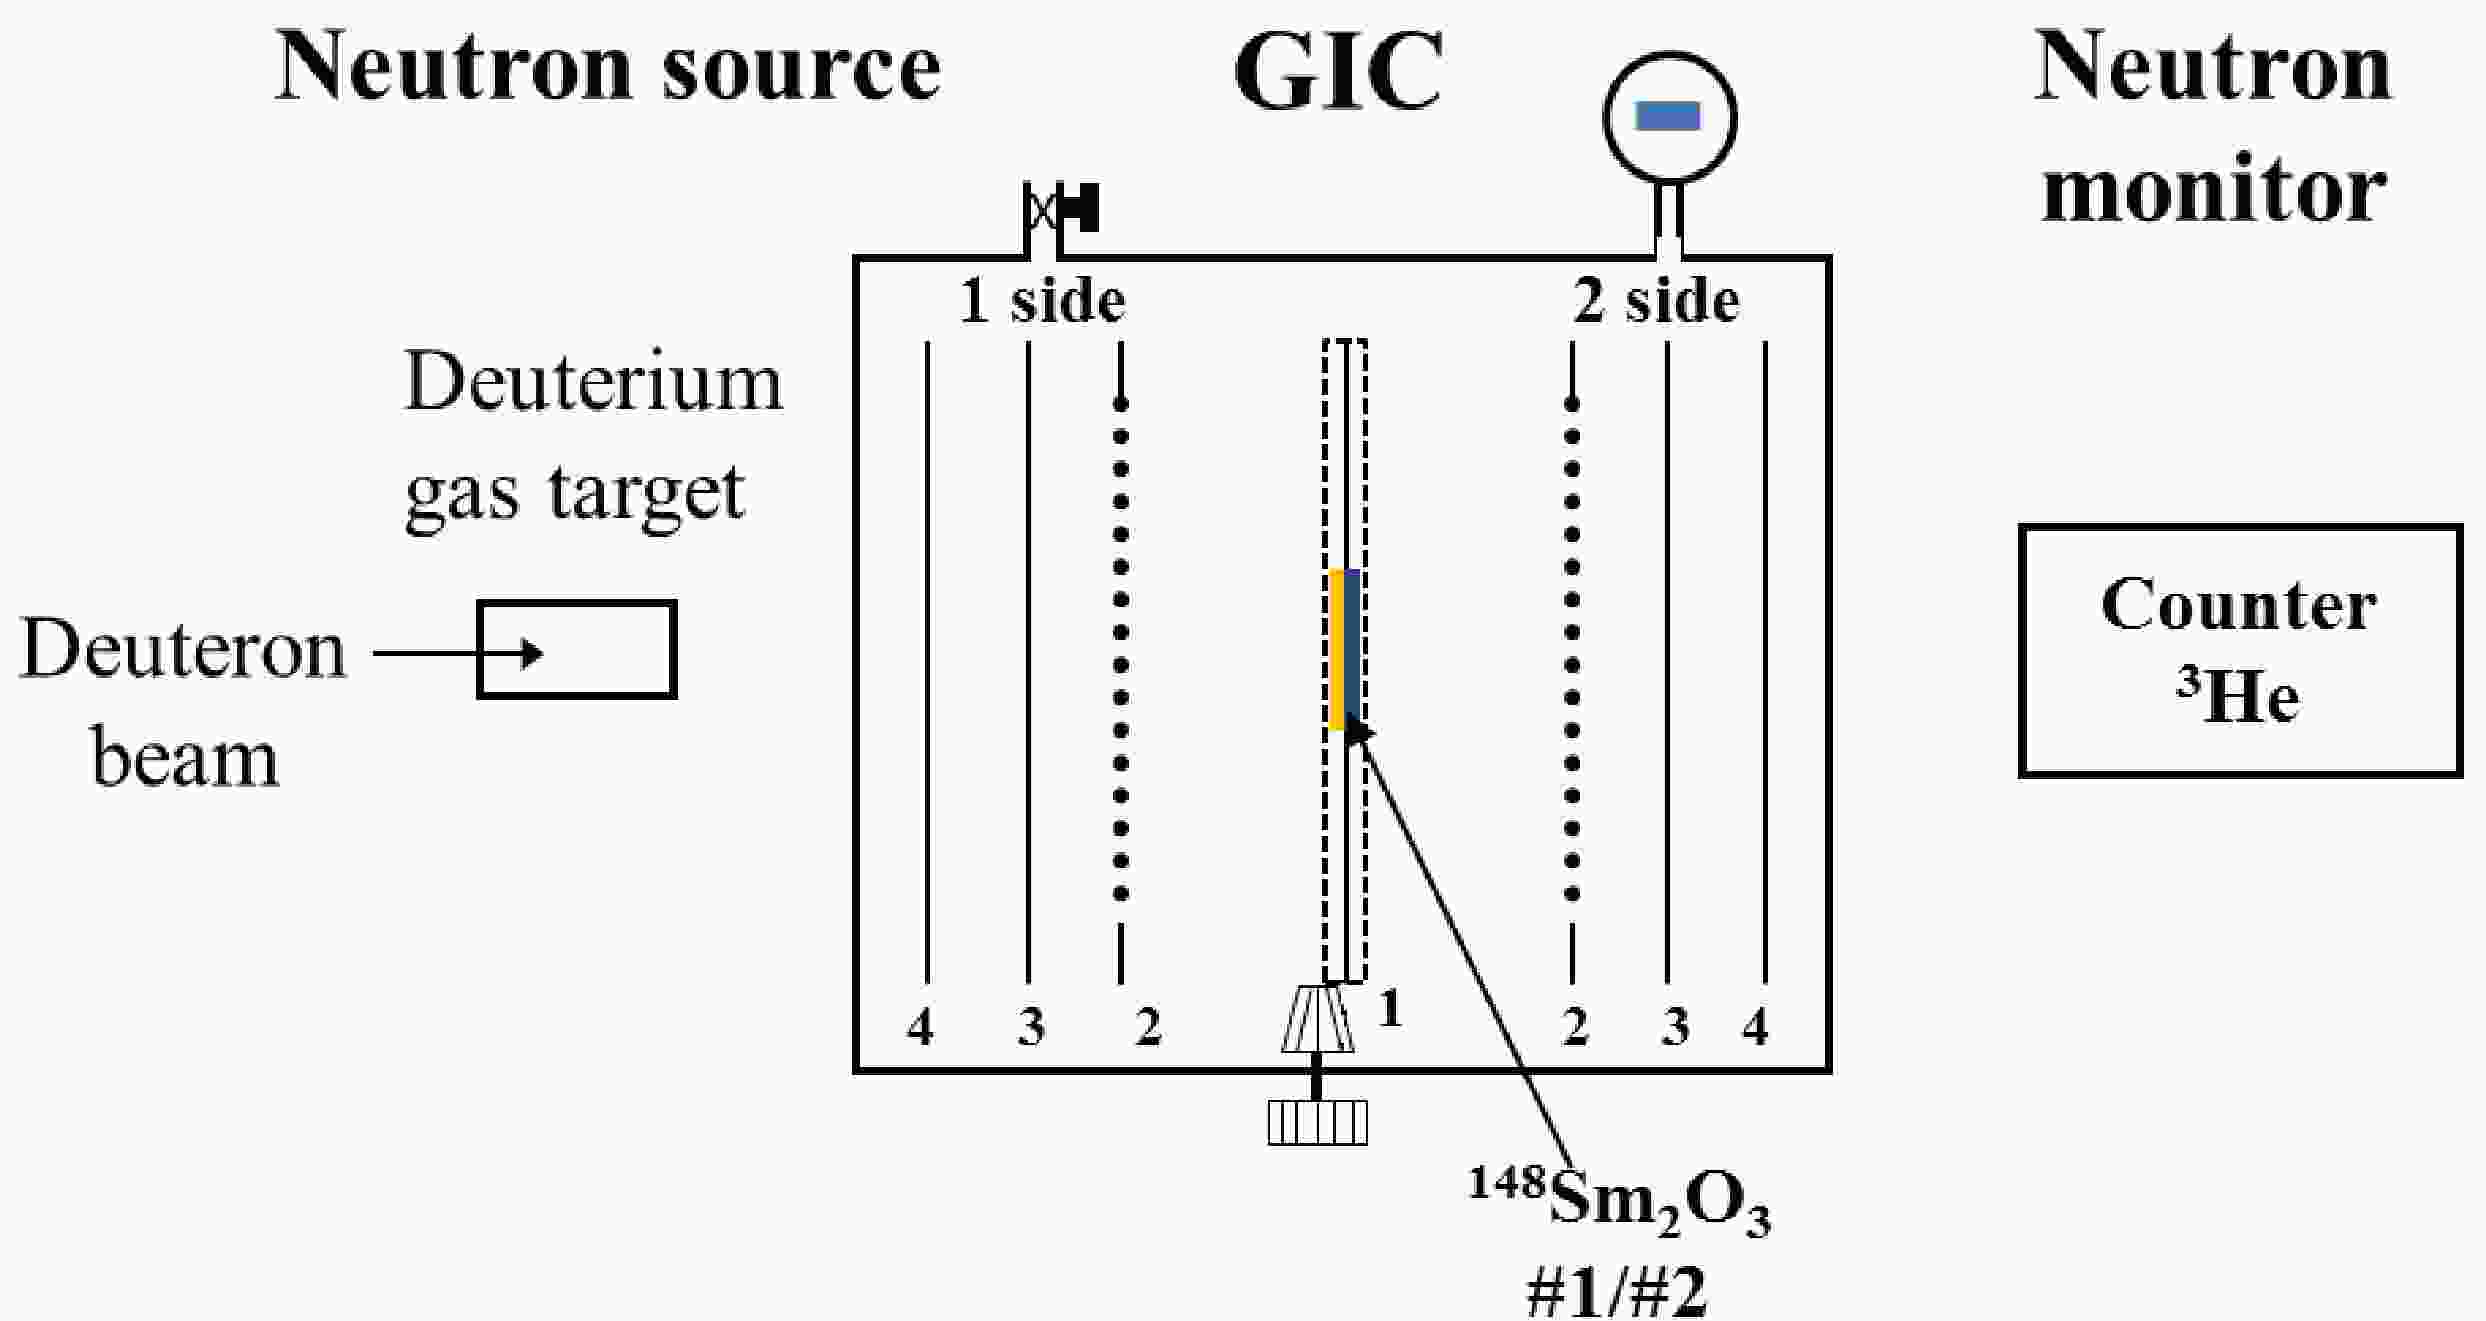
The experiment was conducted at the EG–5 Van de Graaff accelerator at the Frank Laboratory of Neutron Physics, Joint Institute for Nuclear Research. The experimental setup, shown inFig. 1, consisted of three main components: a mono–energetic neutron source, a twin gridded ionization chamber (GIC) as the charged particle detector, and a3He counter for monitoring the neutron flux.
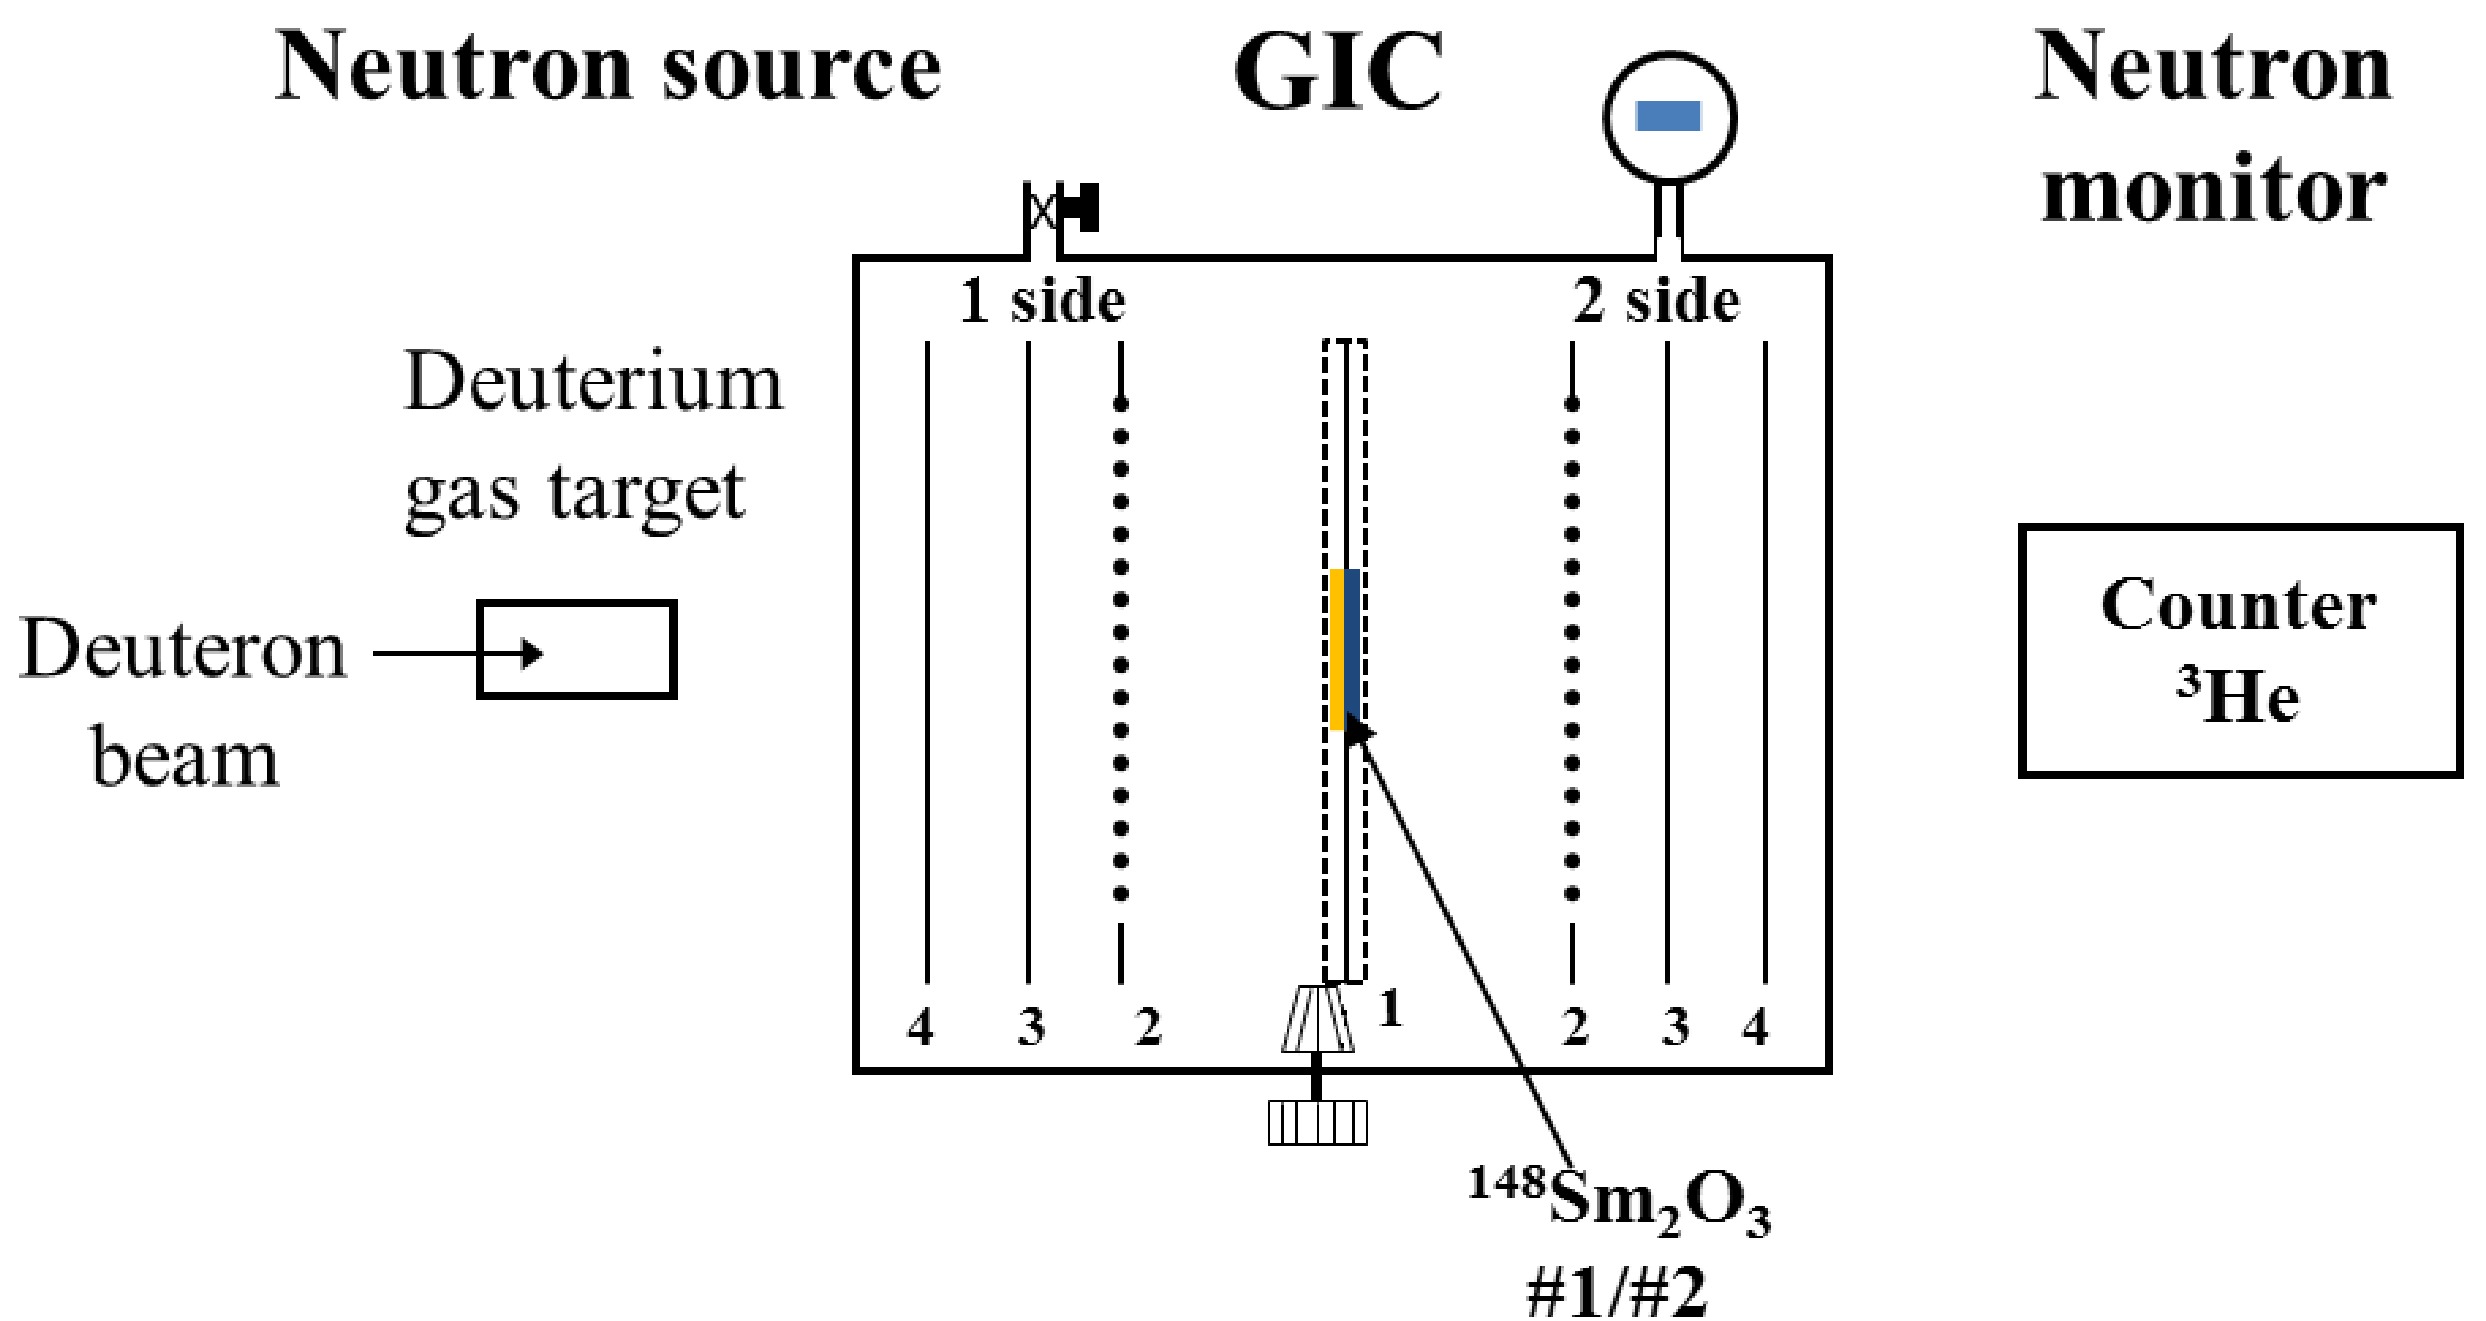
Figure 1.(color online) Scheme of the experimental setup. 1, 2, 3, 4 – common cathode with samples, grids, anodes and shields of the GIC, respectively.
-
Fast neutrons were generated via the2H(d,n)3He reaction using a deuterium gas target. The gas cylinder vessel, which was 2 cm in length and 0.9 cm in diameter, was separated from the accelerator’s vacuum tube by a 6.0 μm thick molybdenum foil. The pressure of the deuterium gas was 2.5 atm, and the incident deuteron beam current was approximately 2.5 μA. The energy range of the incident deuterons was 2.4–2.8 MeV to generate neutrons with energy 4.8 – 5.3 MeV.
-
The GIC with a common cathode was used as a charged particle detector. The structure of the GIC and its characteristics were presented in Ref. [11]. For the measurement of the148Sm(n,α)145Nd reaction, a mixture of argon plus 3.0% carbon dioxide was employed as the working gas at a pressure of 3.0 atm. This allowed for the alpha particles to be stopped before reaching the grids. The grid electrodes were grounded, while the anode had a high voltage of +1800 V, and the cathode was at –2700 V. The cathode and anodes were covered with tantalum foil to reduce neutron induced background.
The detector signals were recorded using a 14 bit Pixie–16 module, with a sampling frequency of 250 MHz. The Pixie system consisted of a chassis (PXI6023–XIA 14, Wiener), an embedded controller (NI PXI–8820), and a high–speed digitizer (Pixie–16).
A sample changer with five sample positions was installed at the common cathode of the GIC, allowing the samples to be changed without opening the chamber [24]. Two148SmO2samples and one238U3O8sample were prepared. All samples were deposited on tantalum backings with diamaters of 48 mm and thickness of 0.10 mm. The content of Sm isotopes in the samples are as follows:144Sm (0.04%),147Sm (2.05%),148Sm (91.20%),149Sm (5.27%),150Sm (0.55%),152Sm (0.60%), and154Sm (0.29%). The characteristics of the two148SmO2samples and the238U3O8sample (for neutron flux measurement) are given inTable 1.
Sample Abundance (%) Thickness
/(mg/cm2)Diameter
/mm148SmO201 91.20 2.94±0.04a 44.0 148SmO202 91.20 3.10±0.03a 44.0 238U3O8 99.999 0.475 44.0 a) Thickness of samarium only; Table 1.Characteristics of samples.
-
The absolute neutron flux was determined by detecting fission fragments from a238U3O8sample, which was positioned in one of the five sample positions at the GIC's common cathode. Additionally, a3He long counter at 0º with respect to the deuteron beam line was employed as a neutron flux monitor.
-
Before performing measurements, simulations were conducted to predict the experimental spectra of the148Sm(n,α)145Nd reaction and potential interference reactions from other samarium isotopes, such as147Sm and149Sm, including (n,α) reactions involving the working gas. These simulations were carried out using Matlab software and TALYS–1.96 code. Cross sections, as well as angular and energy distributions from TALYS–1.96, were used as inputs for the calculations. Simulations were performed using a solid sample of samarium with a thickness of 2.94 mg/cm², and a mixture of argon with 3.0% carbon dioxide was used as the working gas at a pressure of 3.0 atm. The calculations covered the neutron energy range from 4.8 to 5.3 MeV and determined the expected positions of events for the studied reaction, as well as background reactions that can mask the effect.Figure 2shows the calculated two–dimensional cathode–anode spectra of alpha particles from the148Sm(n,α)145Nd reaction at 5.3 MeV neutron energy emitted from a samarium sample in the forward and backward directions. The results quantitative assessment showed that the interference from147Sm(n,α) and149Sm(n,α) reactions is negligible (less than 3%).
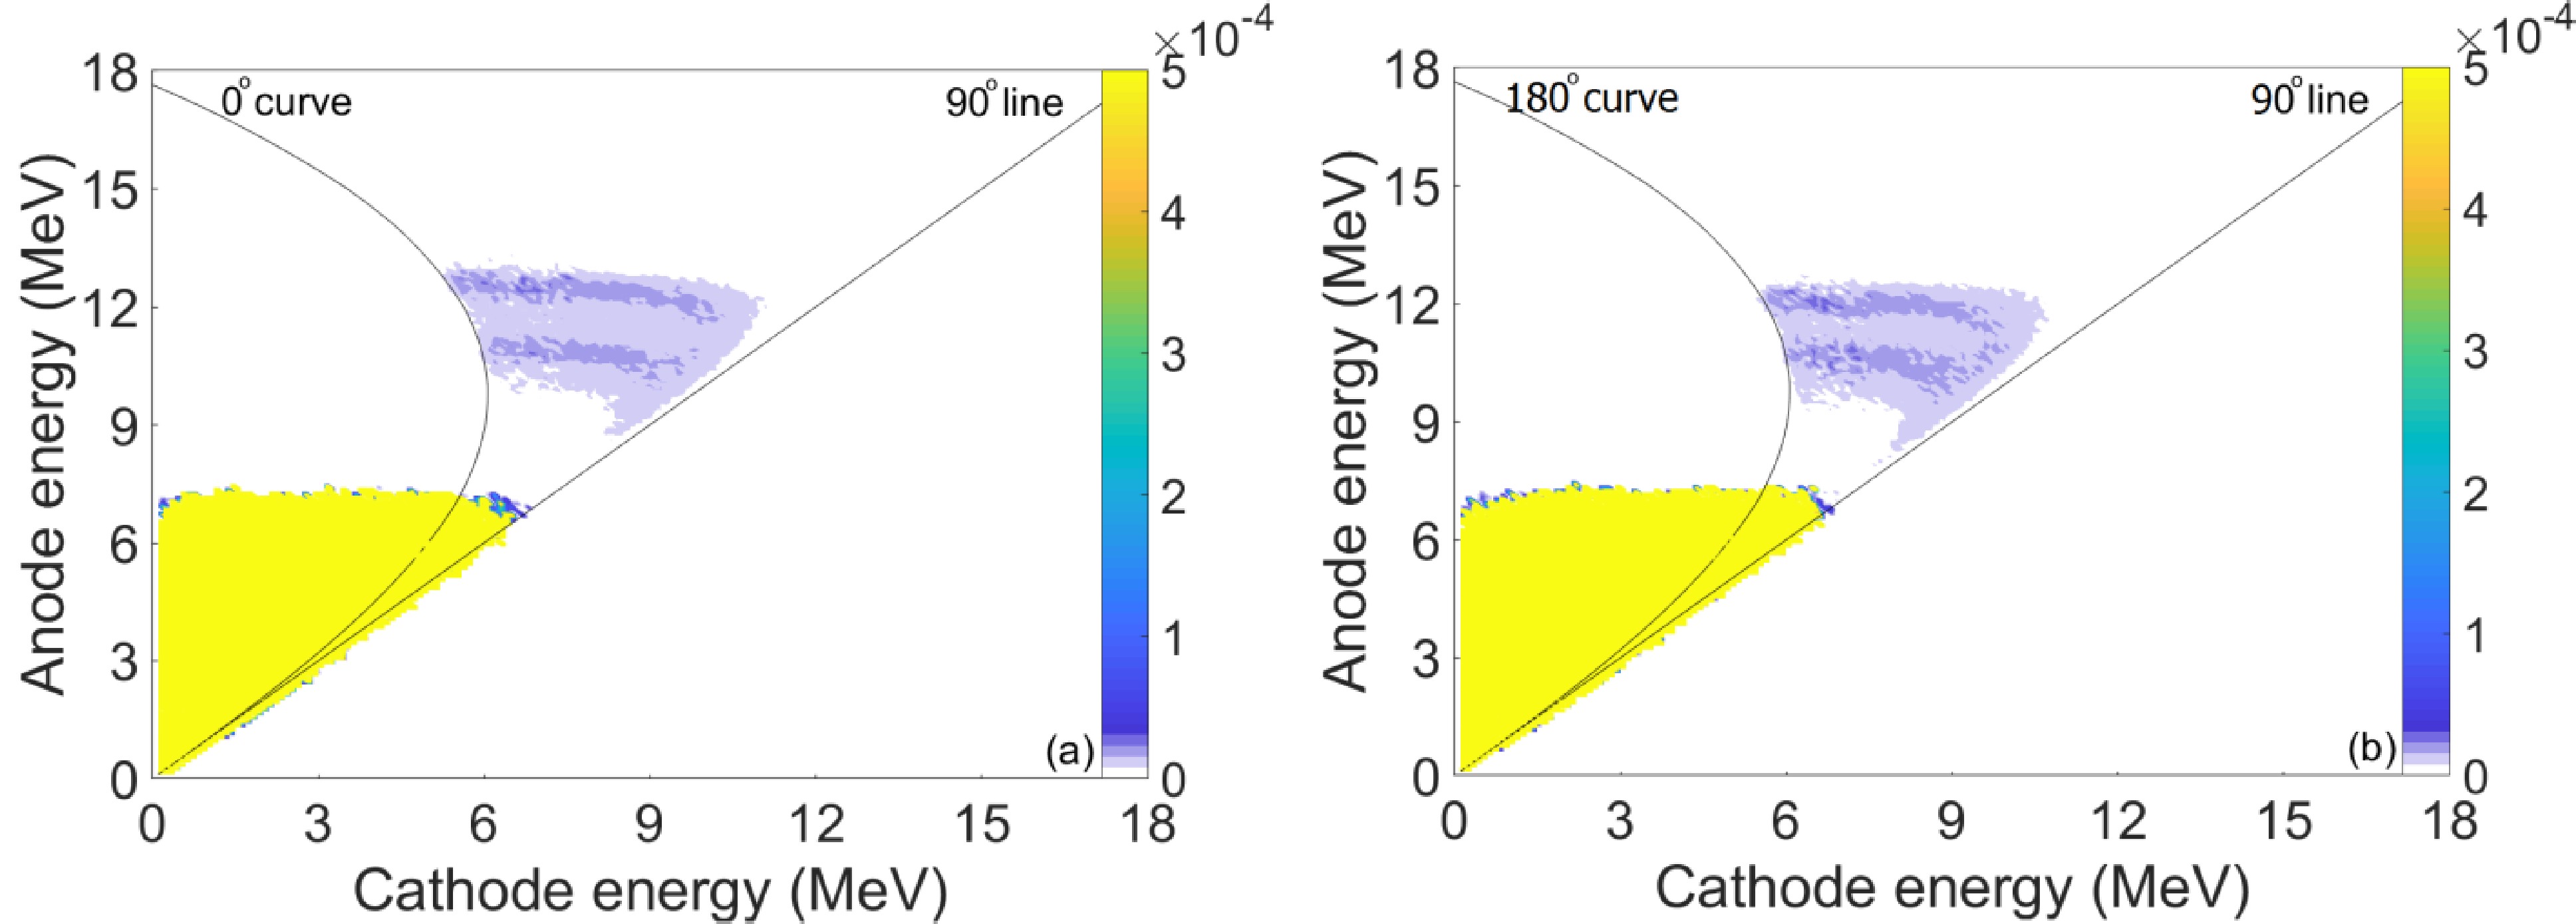
Figure 2.(color online) Calculated two–dimensional cathode–anode spectra of alpha particles from the148Sm(n,α)145Nd reaction at 5.3 MeV neutron energy: (a) forward and (b) backward directions.
-
Measurements for the148Sm(n,α)145Nd reaction were carried out at neutron energies of 4.8, 5.1, and 5.3 MeV. The experimental procedure was performed in several steps at each energy point, as outlined below:
1. Calibration
The system was first calibrated using an alpha source to ensure accurate detector readings before starting the measurements.
2. Foreground measurements
Back–to–back148Sm samples were placed at the common cathode of the GIC to accurately measure the (n,α) reaction.
3. Neutron flux measurements
The absolute neutron flux was measured for each neutron energy point in a separate measurement using the238U(n,f) reaction. The238U3O8sample with the same dimension placed at the same sample position as the148Sm samples. The total fission counts from the238U3O8sample were used to determine the absolute neutron flux.
Figure 3shows an example of the anode spectrum of the fission fragments from the238U(n,f) reaction, which was used to measure the absolute neutron flux.
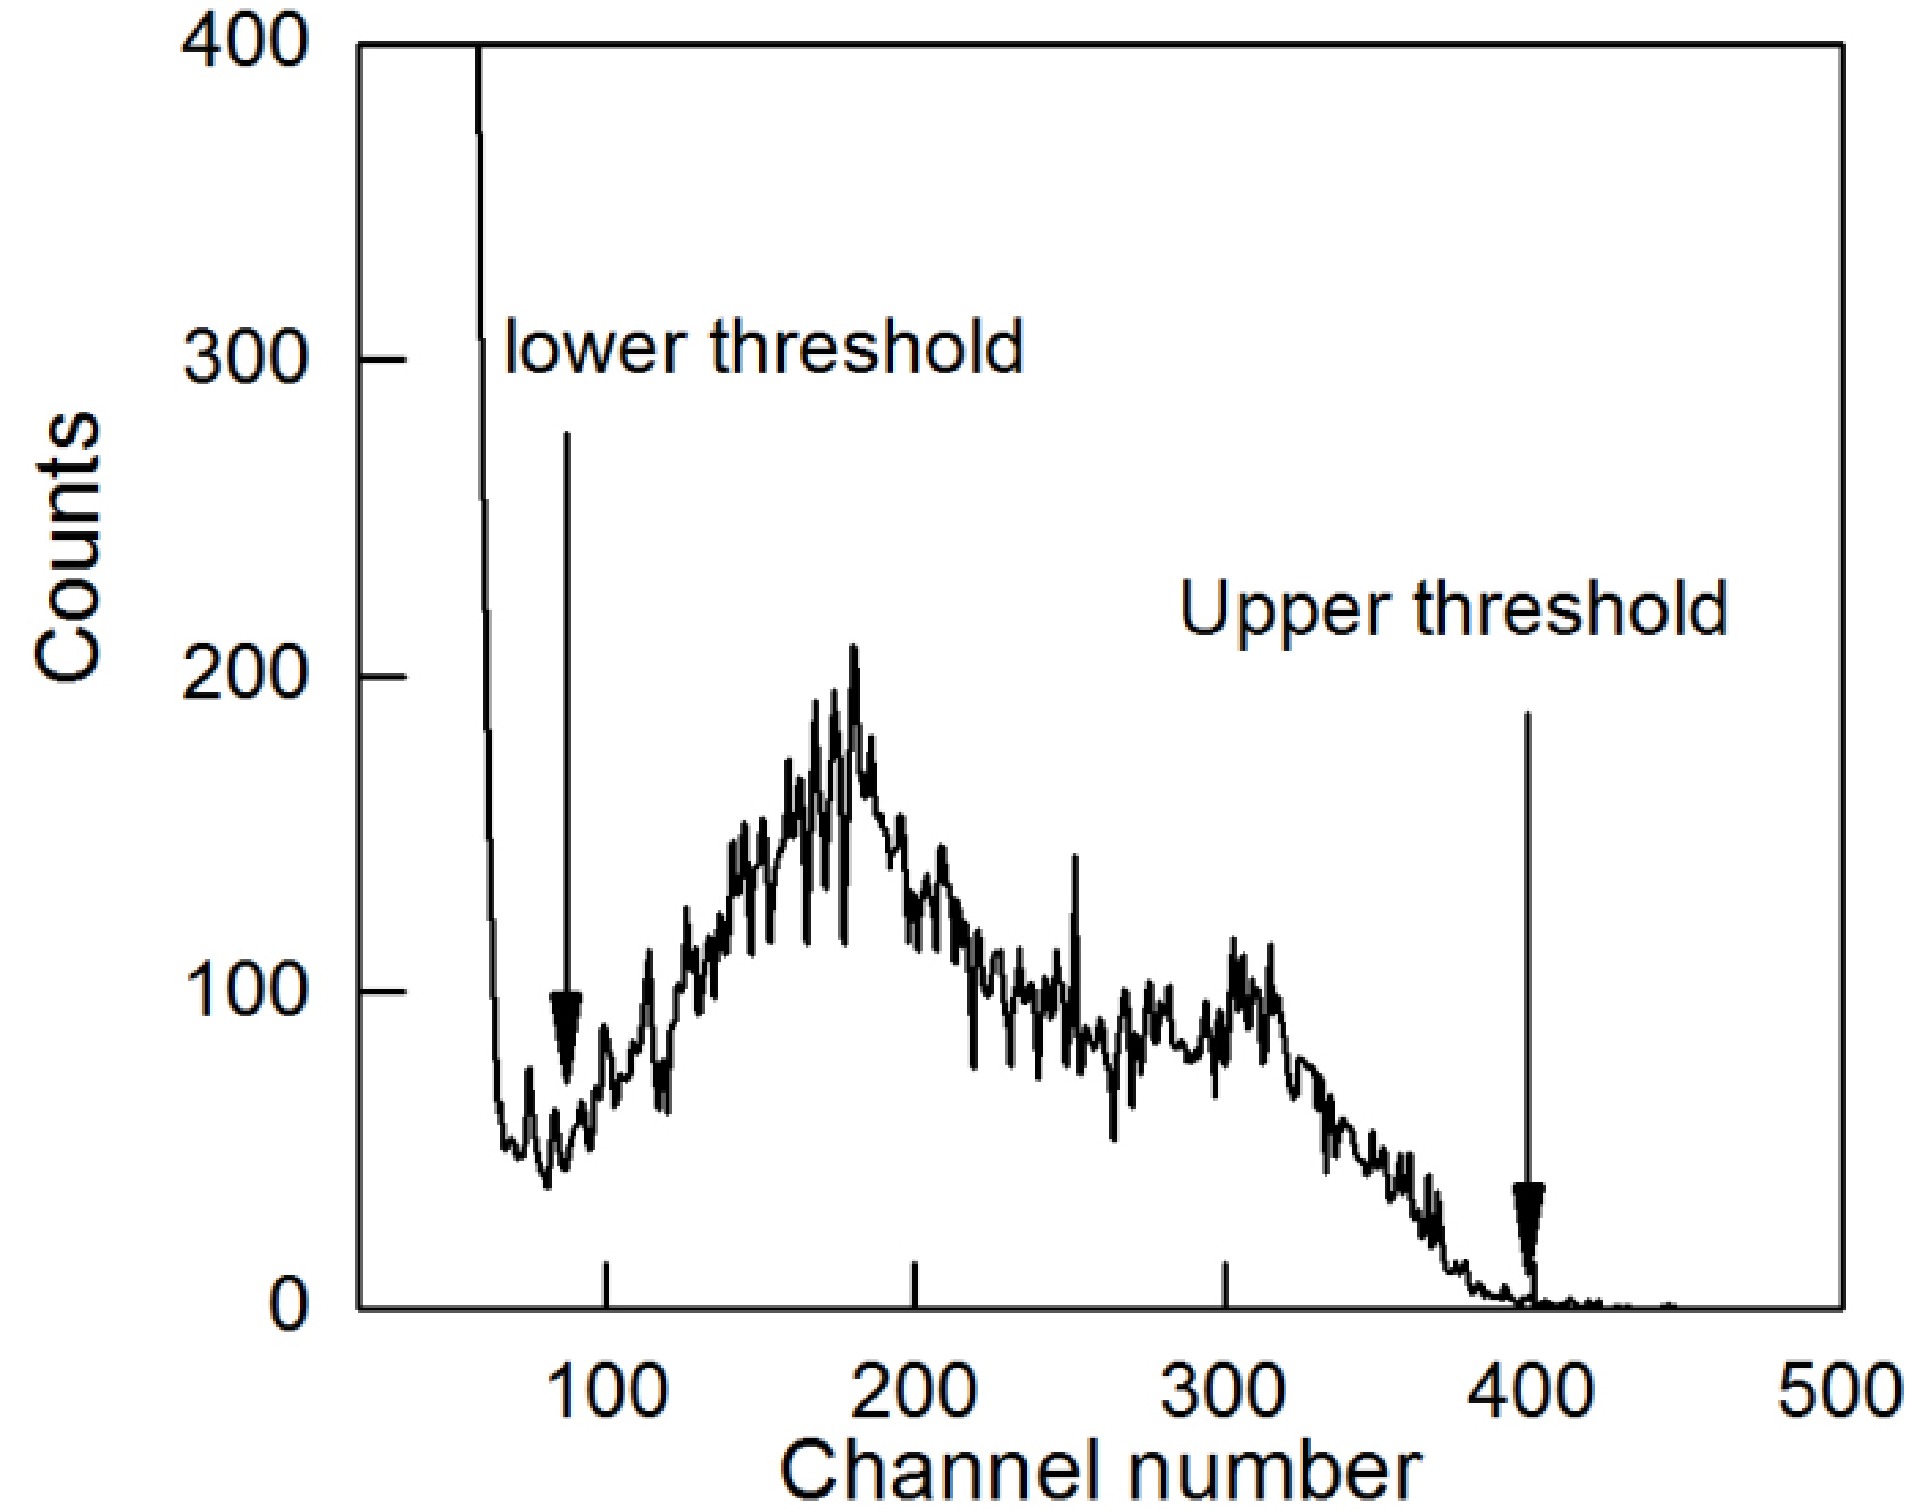
Figure 3.The cathode spectrum of fission fragments for measuring the absolute neutron flux of the238U(n,f) reaction at 5.3 MeV neutron energies.
The measurement durations were about 2 h for each neutron energy point.
4. Background Measurements
Background data were recorded using pure tantalum backings under the same experimental conditions as the foreground measurements. These background measurements were performed at the neutron energy point.
5. Recalibration
After each measurement, the system was recalibrated with the alpha source.
The3He long counter was used as a neutron flux monitor, positioned 3 m from the neutron source during all measurements at each energy point. The counts from the3He counter were used as a normalization factor in the cross section calculation.
The measurement durations for the foreground measurements were 36, 60, and 36 h at 5.3, 5.1, and 4.8 MeV, respectively. For the background measurements, the durations were 19, 39, and 19 h at the corresponding energy points. For the absolute neutron flux measurements, the duration is approximately 2 h for each energy point. The detection efficiencies for both fission and alpha events were calculated using Monte Carlo simulations. The detection efficiency is defined as the ratio of counts within the threshold range to the total counts in the simulated spectrum. The details of the simulations are described in Ref. [25]. The detection efficiencies for fission fragments (εf) and alpha particles (εα) were determined to be 86% and 87%, respectively. These values were used to correct for efficiencies in the cross section calculation.
After data collection, the cathode–anode two–dimensional spectra were analyzed for both foreground and background measurements.Figures 4and5shows the two–dimensional foreground (a) and background (b) spectra of the148Sm(n,α)145Nd reaction at 5.3 MeV neutron energy in the forward and backward direction, respectively.Figure 6presents the anode projection spectrum after subtracting background events from foreground events. A selection cut is then applied based on simulation results, which predict the expected distribution of α events from the148Sm(n,α)145Nd reaction. The selected area is used to generate the anode projection spectrum for further analysis. Additionally, background events are subtracted while accounting for differences in measurement durations, and the ³He counter counts are used for normalization.
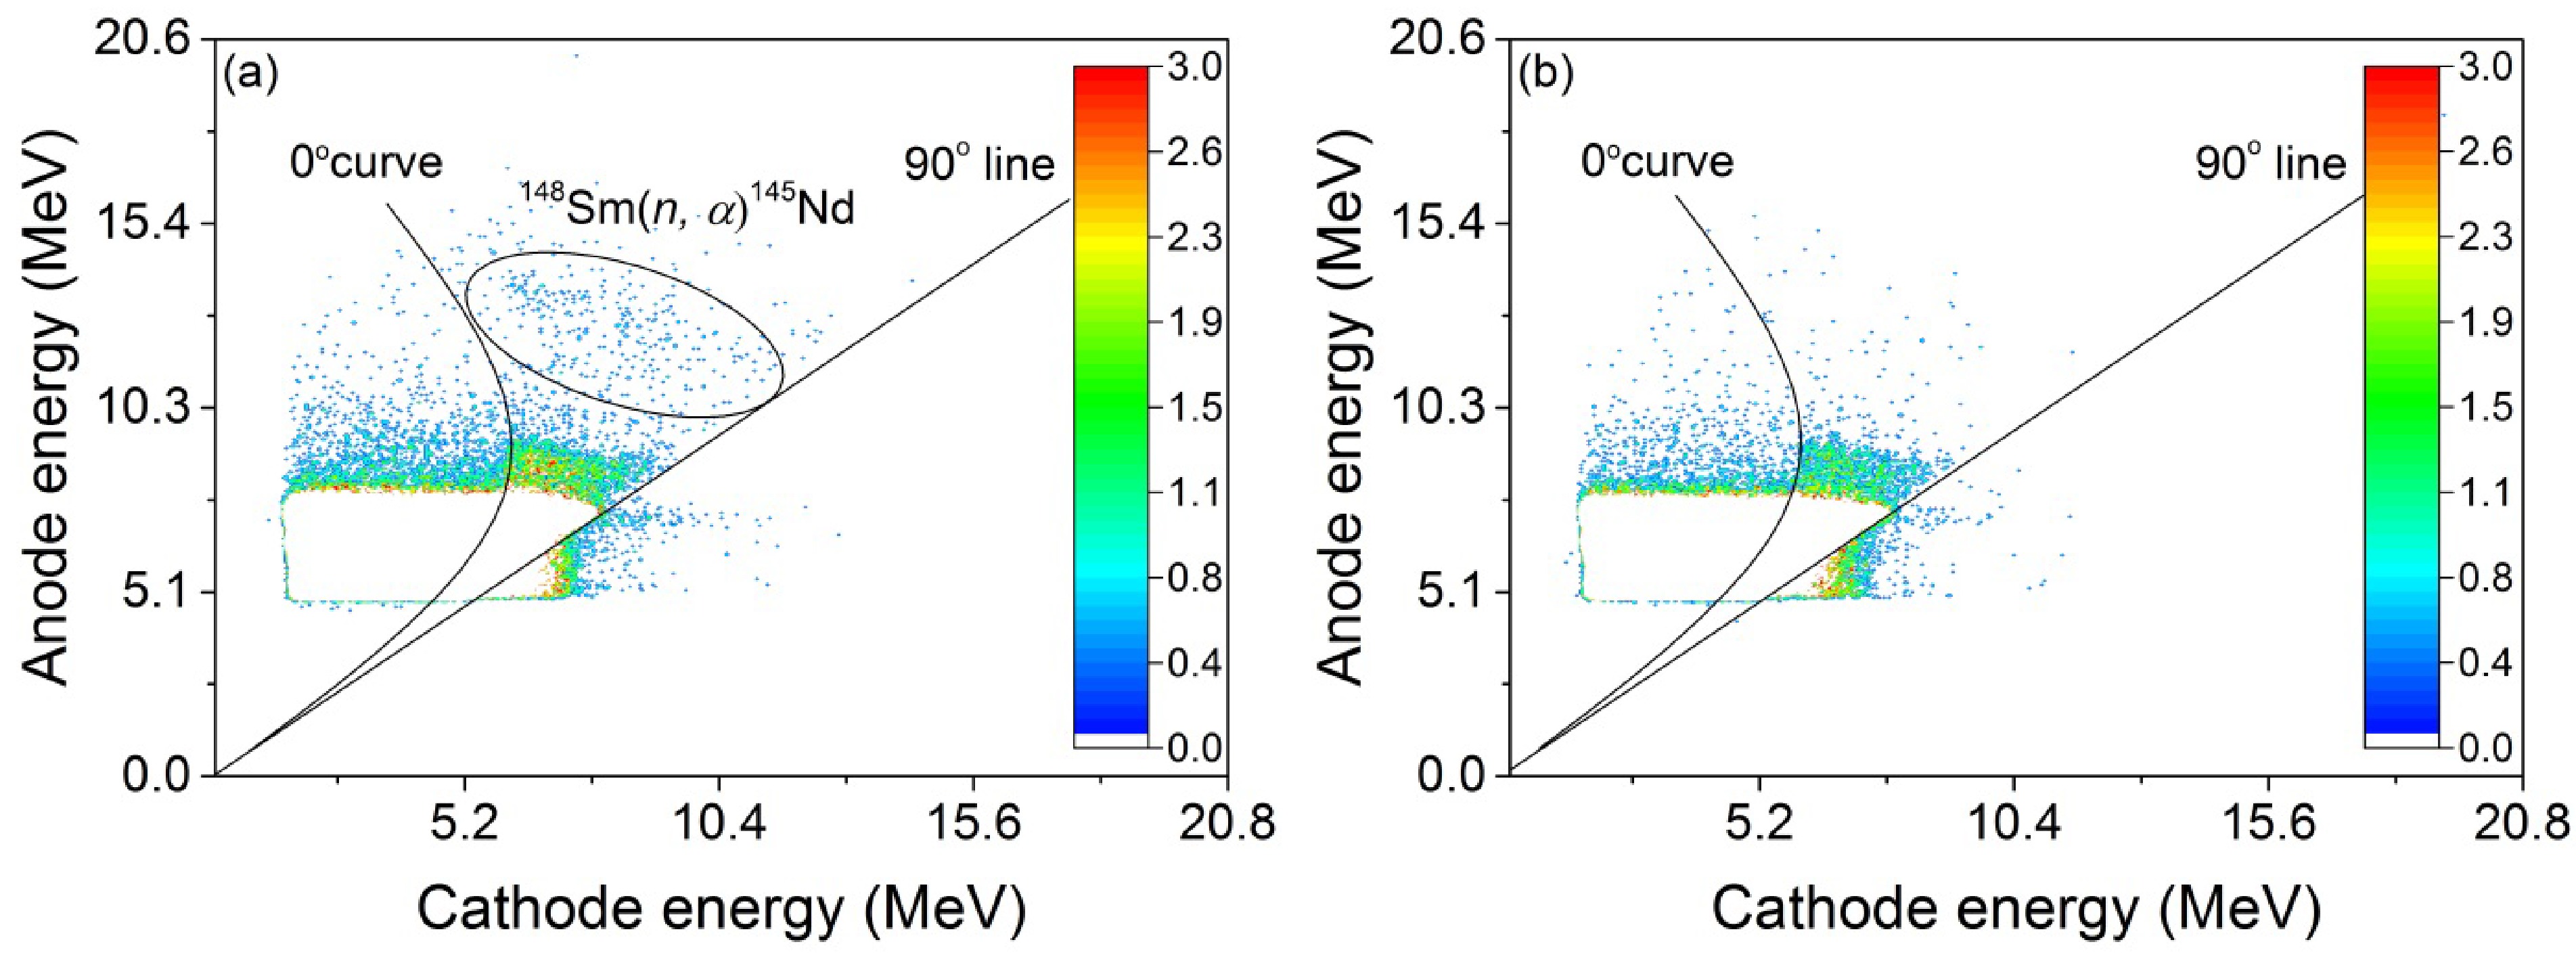
Figure 4.(color online) Two–dimensional foreground (a) and background (b) spectra of the148Sm(n,α)145Nd reaction in the forward direction at 5.3 MeV neutron energy.
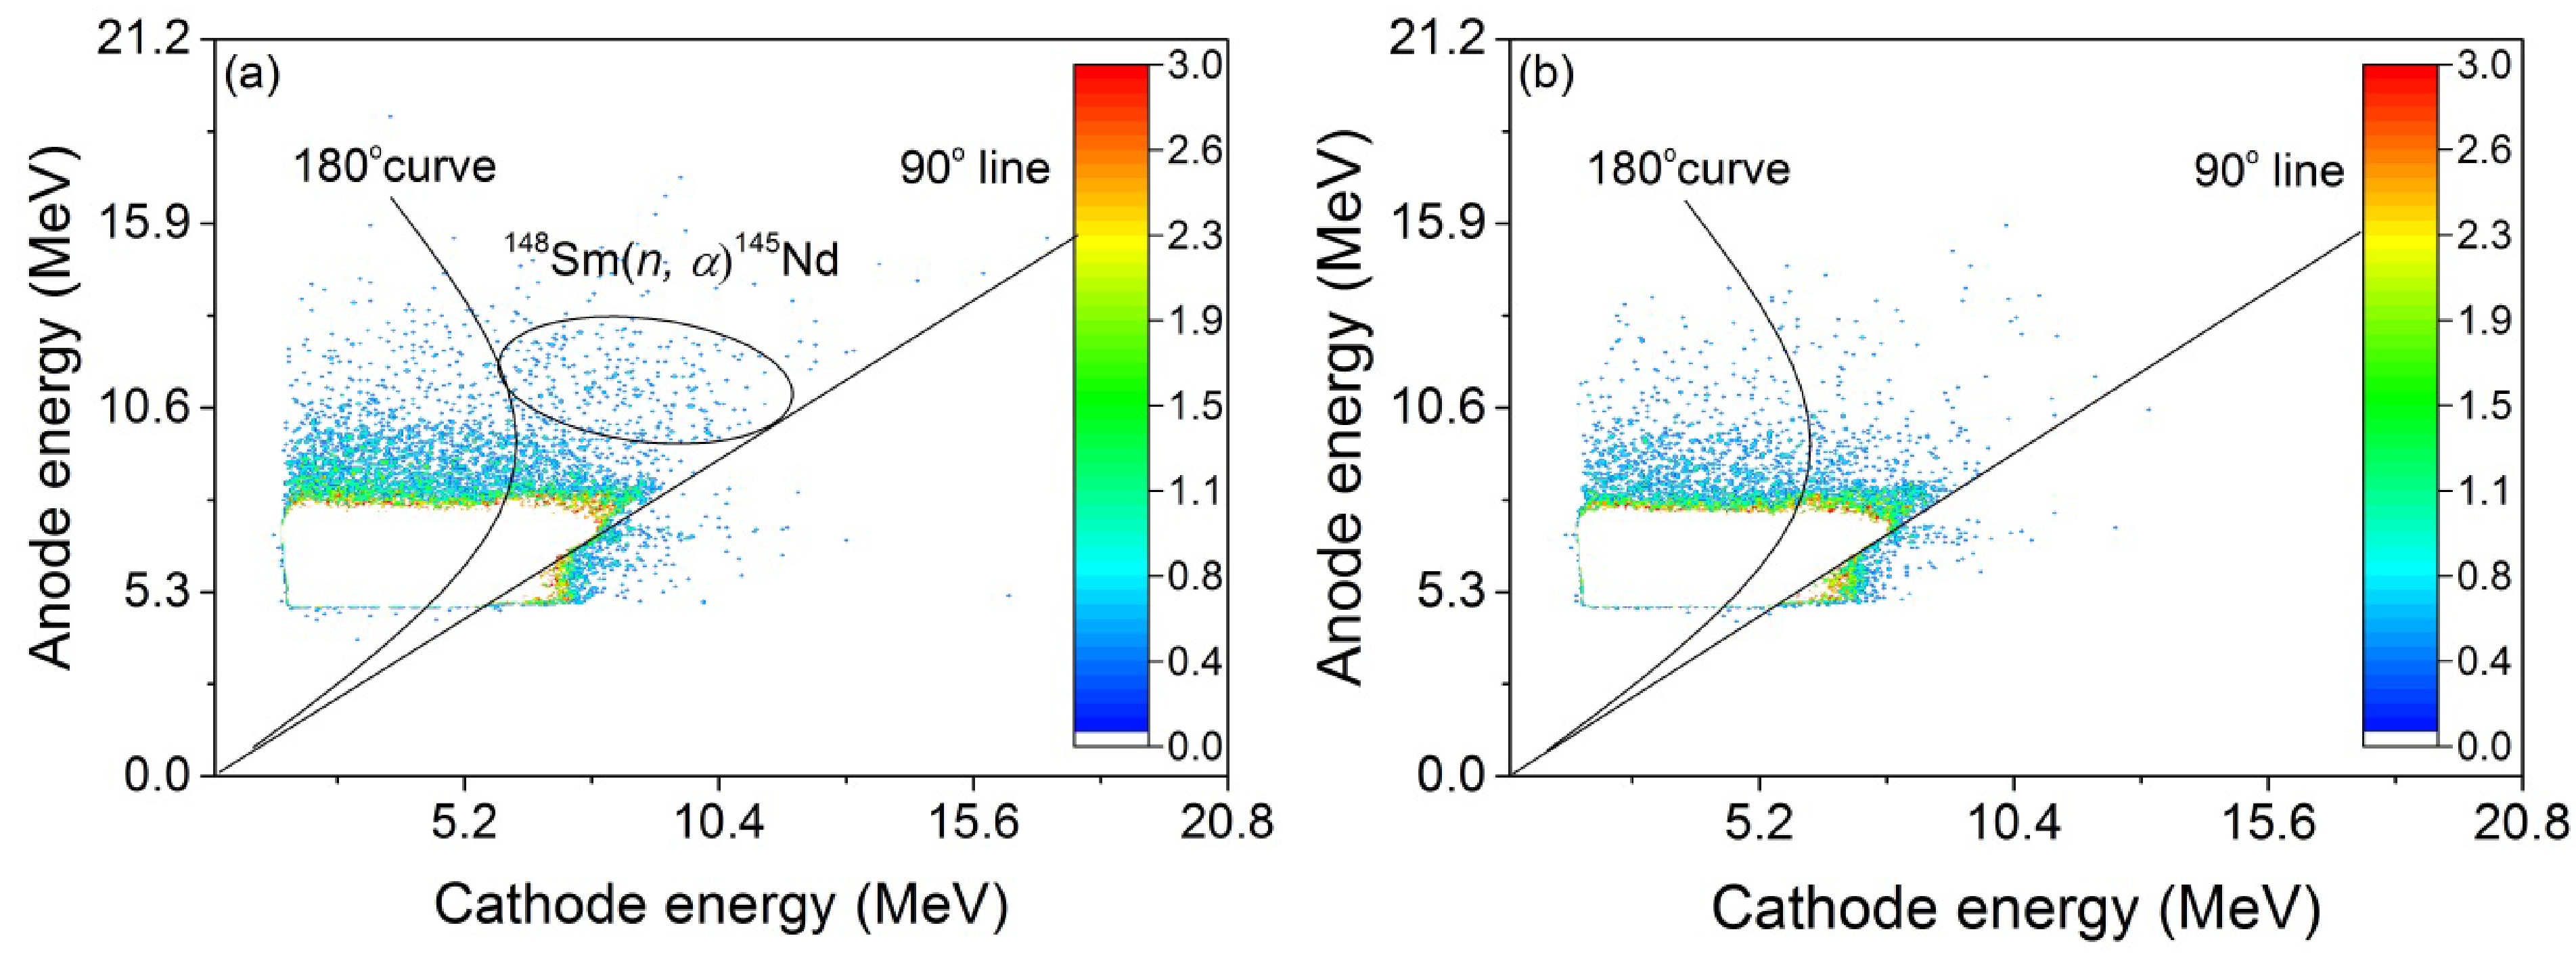
Figure 5.(color online) Two–dimensional foreground (a) and background (b) spectra of the148Sm(n,α)145Nd reaction in the backward direction at 5.3 MeV neutron energy.
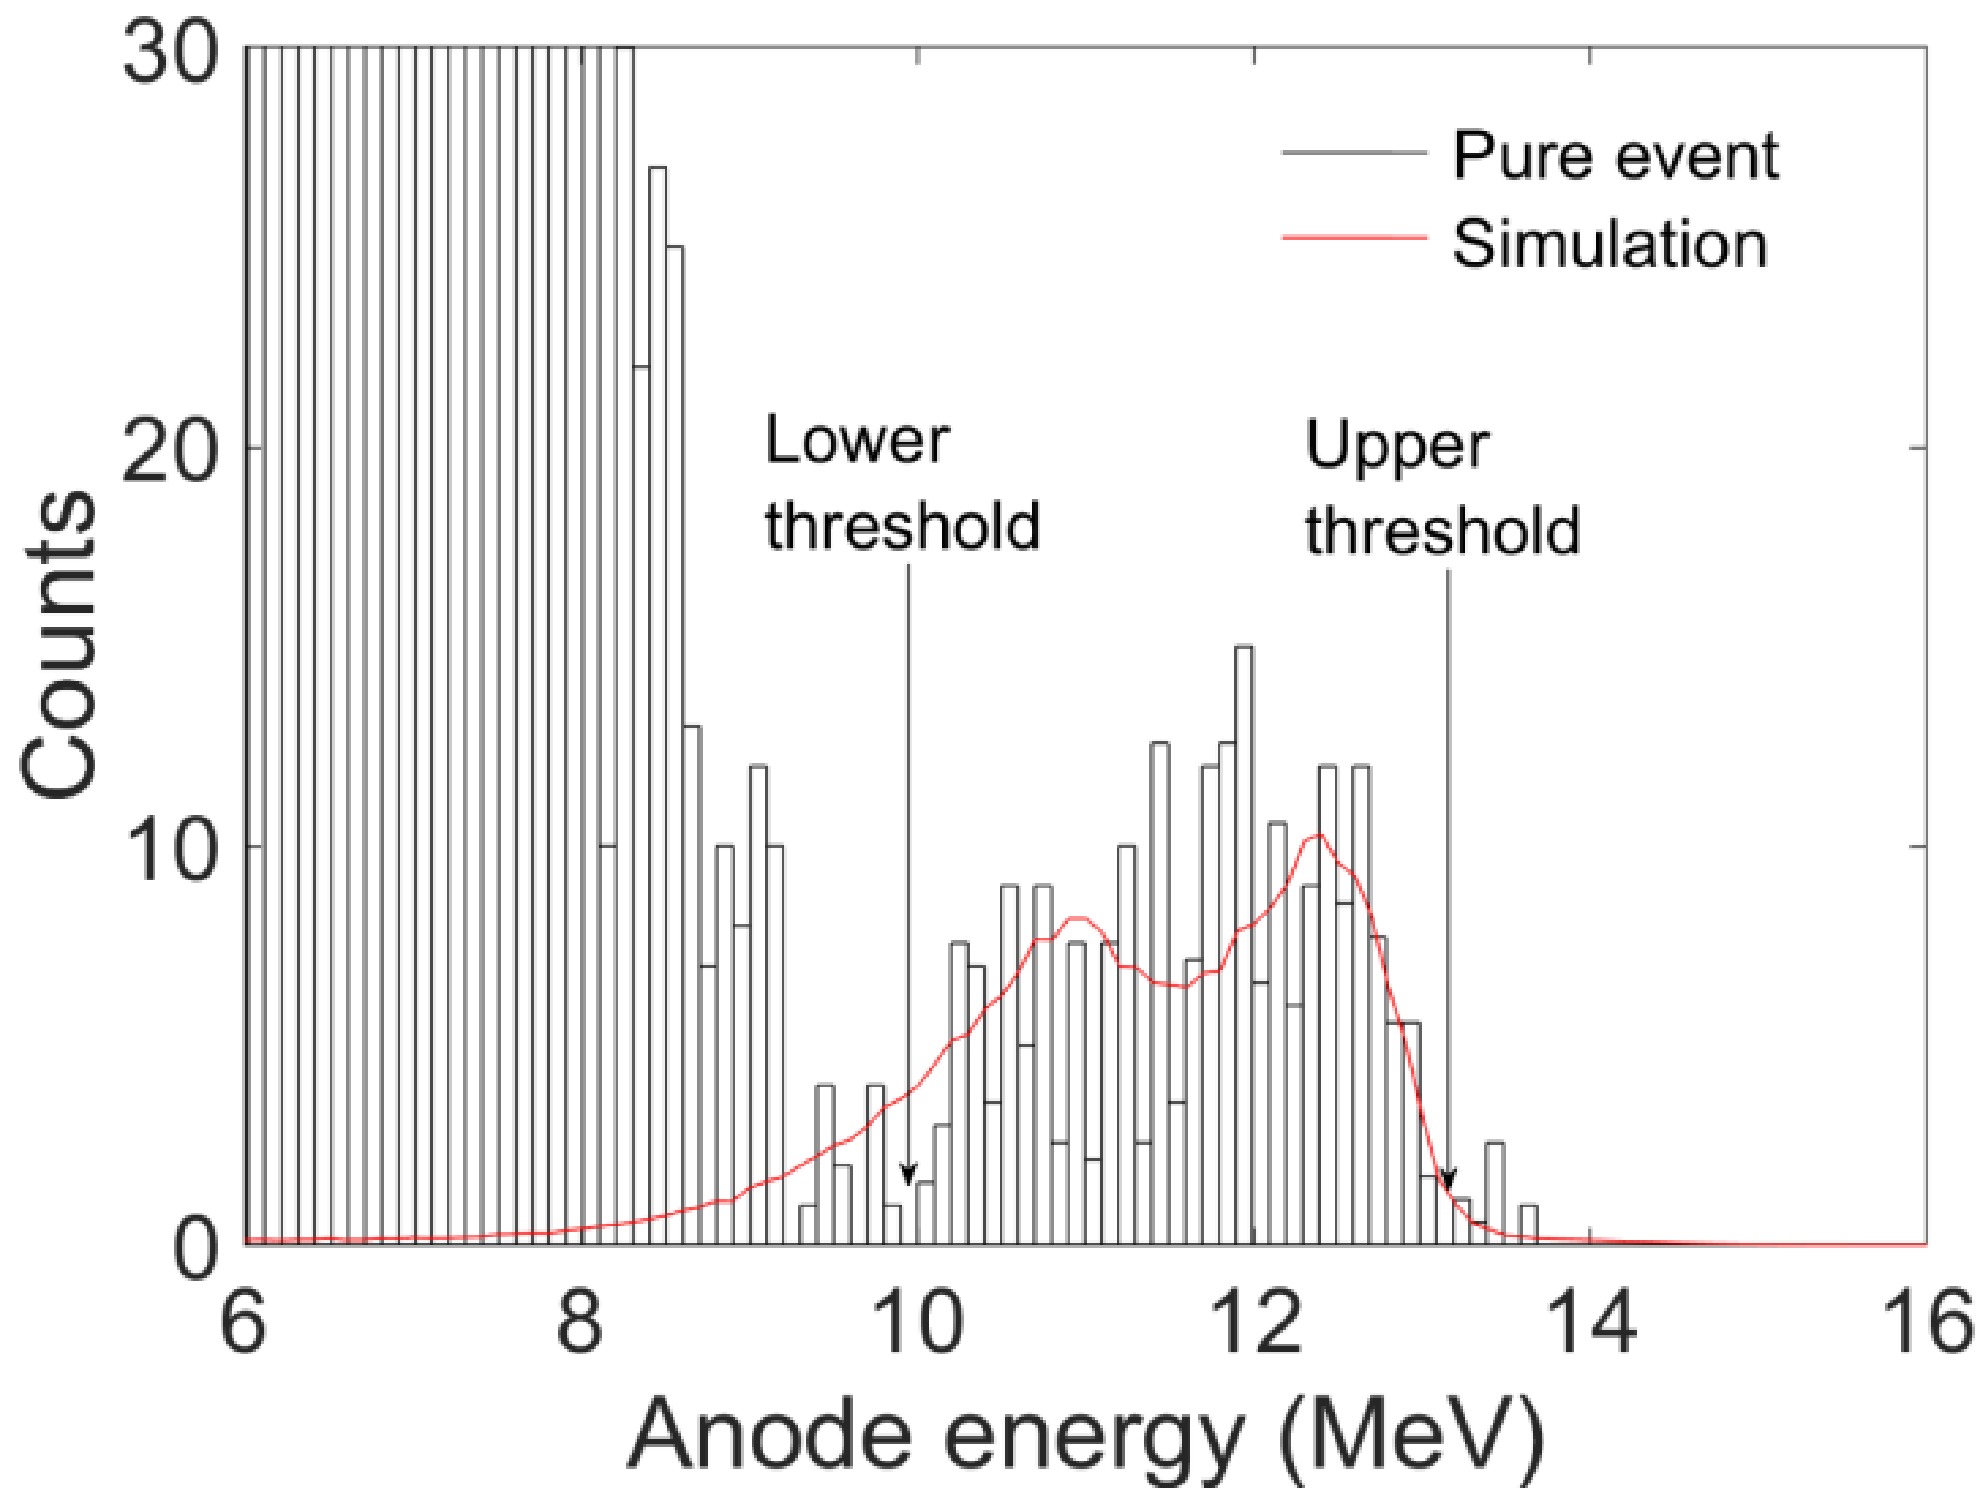
Figure 6.(color online) The anode projection spectrum of the148Sm(n,α)145Nd reaction in the forward direction at 5.3 MeV neutron energy.
The cross section (σn,α) for the148Sm(n,α)145Nd reaction was determined using the following formula:
$ {{\sigma }}_{n,{\alpha }}={K}\cdot {{\sigma }}_{{n},{f}}\frac{{{N}}_{\mathrm{\alpha }}}{{{N}}_{{f}}}\frac{{\epsilon }_{f}}{{\epsilon }_{\alpha }}\frac{{{N}}_{^\text{238}{\rm U}}}{{{N}}_{^\text{148}{\rm Sm}}} , $

(1) whereK= Hef/Heα, with Hefand Heαrepresenting the counts of the3He counter during the measurements of the238U(n,f) and148Sm(n,α)145Nd reactions, respectively.
σn,fis the cross section for the238U(n,f) reaction from the ENDF/B–VIII.0 library.
NαandNfrefer to the number of alpha and fission events, respectively, values of which are determined after distinguishing background events within the specified energy thresholds for the reactions.
εfandεαare the detection efficiencies of the fission and alpha events.
N238UandN148Smare the atom numbers in the238U and148Sm samples, respectively.
-
The experimental cross sections for the148Sm(n,α)145Nd reaction were obtained using Equation (1). The uncertainty was calculated using the error propagation formula. The primary source of uncertainty arises from the number of alpha events, which includes contributions from statistical errors and background subtraction, particularly influenced by the valid–event–area cut and the energy threshold cut. The sources of the uncertainty and their magnitudes are presented inTable 2. Consequenlty, the total uncertainty in the148Sm(n,α)145Nd reaction cross sections ranges from 13% to 20%.
Source Magnitudes (%) N238U 2.0 N148Sm 3.0 σn,f 0.7 Nα 12–18 Nf 3.0 σα 13 - 20 εf 2.0 εα 2.0 Table 2.Sources of the uncertainty.
The measured cross section at each neutron energy was obtained by summing the forward and backward cross sections. Cross sections and forward/backward ratios in the laboratory reference system for148Sm(n,α)145Nd reaction are given inTable 3. The148Sm(n,α)145Nd reaction cross sections are shown inFig. 7, which compared with the data from different evaluation libraries and TALYS–1.96 calculations using default and adjusted parameters as listed inTable 4.
Energy,
/MeVCross sections, mbarn Forward Backward forward/backward ratio Total 4.8 0.033±0.008 0.023±0.007 1.43 0.056±0.011 5.1 0.042±0.008 0.029±0.007 1.45 0.071±0.012 5.3 0.06±0.01 0.04±0.008 1.50 0.1±0.013 Table 3.Measured (n,α) cross section data and forward/ backward ratios in the laboratory reference system for the148Sm(n,α)145Nd reaction.
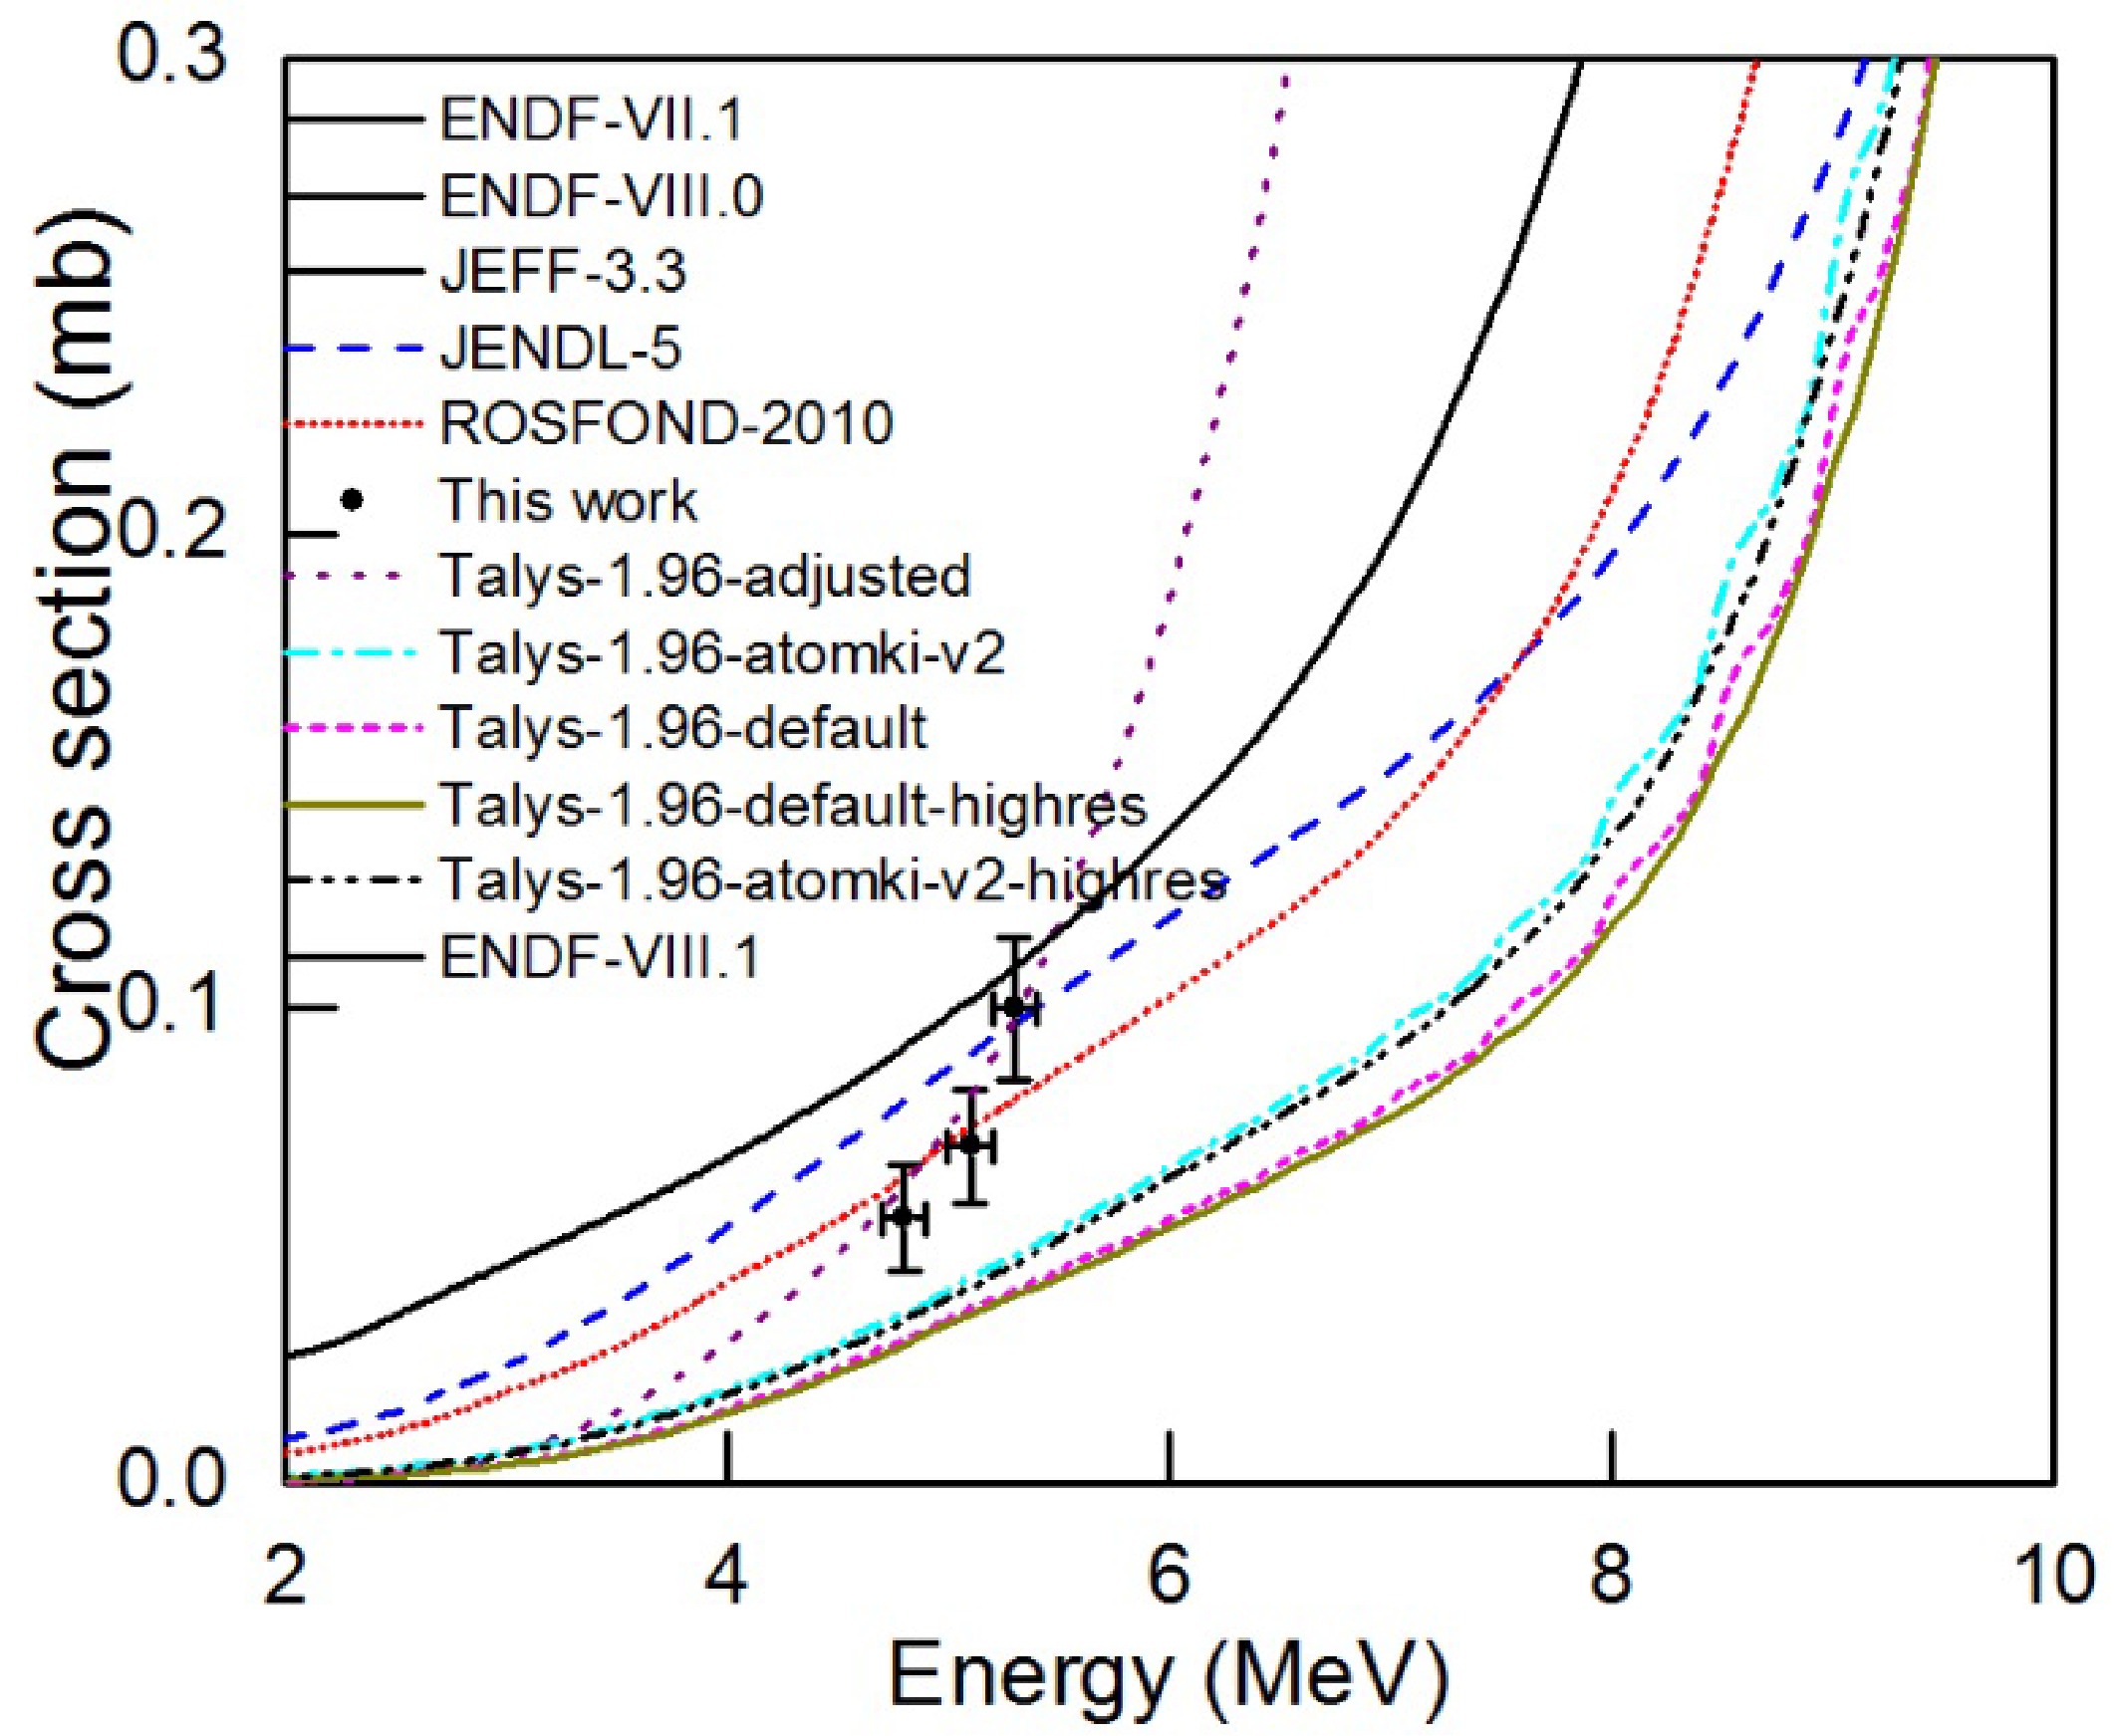
Figure 7.(color online) Experimental and evaluated cross sections for the148Sm(n,α)145Nd reaction compared with the calculated results from TALYS–1.96.
Keyword Parameters ldmodel 2 Ldmodelcn 1 Alphaomp 6 Rvadjust a 0.995 Avadjust a 0.995 Aadjust 60 145 1.28 rvadjust n 1.018 –0.2 0.2 0. 0.98 Pshiftadjust 62 148 0.60 Rvadjust p 1.10 Avadjust p 1.10 Gnadjust 62 149 0.94 Gpadjust 62 149 0.94 Table 4.Adjusted input parameters of the TALYS–1.96.
We performed calculations using three sets of parameters in TALYS–1.96: default input parameters with the Avrigeanu [26] alpha–particle optical model potential (AOMP), default input parameters with the Atomki–V2 [27–29] AOMP, and adjusted parameters as listed in Table IV. The calculations using the default Avrigeanu AOMP significantly underestimated the experimental cross sections in the 4.8–5.3 MeV energy range. A slight improvement was observed when the Atomki–V2 AOMP was used with the default parameters. The calculated cross sections with Atomki–V2 AOMP were about 20% higher than those obtained with the Avrigeanu AOMP, but they still remained much lower than the experimental data. Given these results, we will provide a detailed theoretical analysis in a follow–up paper which will include all of our Sm(n,α) measurement data [11–16].
In the present work, TALYS–1.96 calculations using the adjusted OM parameters and the pairing shift for the Fermi gas level density (as listed in Table IV) give much better results, leading to significantly improved agreement across the measured energy range of 4.8–5.3 MeV.
Our measured cross sections are significantly lower than the evaluated values in ENDF/B–VIII.0, ENDF/B– VII.1, ENDF–VIII.1 and JEFF–3.3 libraries which are identical (by a factor of 1.2 to 1.4), in the neutron energy range of 4.8 to 5.3 MeV. Our experimental data are consistent with the ROSFOND–2010 evaluations at the two lower energy points and with the JENDL–5.0 library at 5.3 MeV neutron energy.
-
The cross section for the148Sm(n,α)145Nd reaction was systematically measured with high accuracy at neutron energies of 4.8, 5.1, and 5.3 MeV. These measurements represent the first experimental results in the MeV energy region. The experiments were performed on the EG–5 Van de Graaff accelerator using the GIC charged particle detector, enriched148SmO2samples, and238U3O8samples. The present experimental data are significantly lower than the values obtained in the ENDF/B–VIII.0, ENDF/B–VII.1, ENDF-VIII.1, and JEFF–3.3 libraries by a factor of 1.2 to 1.4. Our experimental data are consistent with the ROSFOND–2010 evaluations at the two lower energy points and with the JENDL–5.0 library at 5.3 MeV neutron energy, and the TALYS–1.96 calculations using the adjusted parameters produced results that were consistent with our experimental data across the 4.8 – 5.3 MeV neutron energy range.
Cross sections of the148Sm(n,α)145Nd reaction in the 4.8–5.3 MeV neutron energy range
- Received Date:2025-01-31
- Available Online:2025-07-15
Abstract:The cross sections of the148Sm(n,α)145Nd reaction were measured for the first time at neutron energies ranging from 4.8 to 5.3 MeV. The experiment was carried out on the Van de Graaff accelerator EG–5 at the Frank Laboratory of Neutron Physics, Joint Institute for Nuclear Research. Fast neutrons were produced via the2H(d,n)3He reaction with a deuterium gas target. A twin gridded ionization chamber was used as the charged particle detector, with back–to–back148Sm samples mounted on tantalum backings at the common cathode. The absolute neutron flux was measured using the238U3O8sample. The obtained cross section data were compared with those from existing nuclear data libraries and theoretical calculations using the TALYS–1.96 code. The present results for the148Sm(n,α)145Nd reaction are expected to resolve discrepancies among various nuclear evaluation data.


 DownLoad: