


 Abstract
 HTML
HTML Reference
 Related
 PDF
PDF


-
The estimation of the cross sections (CSs) of charged particle induced reactions is important for the design of an accelerator-driven system (ADS), the production of radioisotopes, and the verification of various nuclear models [1−3]. It is also important for understanding the origin ofp-nuclei under astrophysical conditions [4]. Natural neodymium (Nd) is composed of 7 long-lived stable isotopes,142Nd (27.2%),143Nd (12.2%),144Nd (23.8%),145Nd (8.3%),146Nd (17.2%),148Nd (5.7%), and150Nd (5.6%). Nd can be used as a target for producing radioisotopes such as149Pm and140,141Nd, which are medically important and usable for therapeutic purposes [5–8].
Knowledge of the production CSs of proton induced reactions on natural Nd is also important for the experimental observation of doubeβdecay.150Nd, which is one of the 7 long-lived naturally occurring isotopes ofnatNd, is a highly promising candidate for the observation of neutrinoless doubleβdecay (
$ \beta\beta0\nu $ ) with a largeQ-value of 3371.38±0.20 keV [9]. Because the expected signal strength of the doubleβdecay of150Nd is extremely weak, a reduction in background is required. Currently, there are three ongoing experiments in which the neutrinoless doubleβdecay of150Nd is being studied: the Sudbury Neutrino Observatory plus liquid scintillator (SNO+) [10], Drift chamber Beta-ray analyzer (DCBA) [11], and SuperNEMO [12]. A background component in the doubleβdecay experiment is the decay of long-lived radioisotopes such as143Pm,144Pm,146Pm,148Pm and147Nd, produced in natural Nd by its reaction with a proton from cosmic rays. Therefore, the excitation functions of proton induced reactions on natural Nd must be measured.The goal of this study was to perform a systematic investigation of the theoretical estimation of the production CSs of various medically important isotopes of lanthanides via proton induced reactions on neodymium and to compare the calculated CSs with the experimental results obtained till date in various experiments (using natural and enriched Nd targets). Such systematic studies are important for validating the theoretical calculations performed using TALYS code (version 1.96) [13], considering various optical model potentials (OMPs), level density models (LDMs), and preequilibrium models (PEs).
-
For this study, the experimental data of Olkowskyet al.[14,15], Lebedaet al.[16,17], Banerjeeet al.[18], Yanget al.[1], and Tarkanyiet al.[19] were used. In the work of Olkowskyet al., the CSs of149,150Pm produced via proton-induced reactions on150Nd were measured. The chosen energy range of the incident proton beam was from 6.9 to 10.84 MeV. In the work of Lebedaet al.[16,17], proton-induced reactions onnaturalneodymium (natNd) were investigated in the 5−35 MeV energy range to measure the production CSs of different radionuclides. Similarly, in the work of Banerjeeet al.[18], the excitation function of150Nd(p,xnyp) reactions was measured using the stacked-foil activation technique with a 97.65%enriched150Nd target. The chosen proton energy range was 7–15 MeV. In [18], the absolute CSs for the150Nd(p,n)150Pm,150Nd(p, 2n)149Pm, and150Nd(p;d,pn)149Nd reactions were carefully measured at various proton energy values ranging from 7–15 MeV for the first time. It is worth emphasizing that the dead time of the detectors used by Banerjeeet al.[18] was significantly lower (≤10%) than that allowed by Lebedaet al.[16,17],i.e., (≤40%). In the work of Yanget al.[1], the production CSs ofnatNd(p,x) reactions were determined using the stacked-foil activation technique for proton energies up to 45 MeV. In the work of Tarkanyiet al.[19], the excitation functions ofnatNd(p,x) nuclear reactions were measured up to an energy of 65 MeV using the stacked foil activation technique and high resolutionγ-spectrometry.
-
In this study, a systematic investigation of the theoretical estimations of the CSs of150,149,148,146,144,143,141Pm and149,147Nd nuclei was performed via proton-induced reactions on a neodymium target using TALYS code for incident proton beams with energies up to 65 MeV. TALYS is a theoretical nuclear model code in which photons, neutrons, protons, deuterons,
$ ^3 $ He, and$ ^4 $ He can be used as projectiles in the energy range of 1 keV to 200 MeV for target elements with a mass of 12 and heavier [13]. It utilizes state-of-the-art nuclear reaction models and includes direct reaction, preequilibrium emission, and compound reaction mechanisms. The various experimental results taken from EXFOR [15] and the literature were compared with the theoretically calculated values based on the TALYS-1.96 code. In this study, theoretical calculations for each individual reaction were first conducted using various LDMs in the default mode. Subsequently, various combinations of nuclear model parameters were used to fine tune the estimated CSs with the observed experimental results. Finally, calculations were performed using adjusted global parameters for the purpose of fine tuning. The level density parameters were calculated using the six different choices of LDMs available in TALYS-1.96. In TALYS, the six LDMs used for calculating nuclear reaction CSs are as follows: (i) LDM-1: constant temperature model [20] + Fermi gas model [21] (default); (ii) LDM-2: back-shifted Fermi gas model [21]; (iii) LDM-3: generalized superfluid model [22,23] (iv) LDM-4: microscopic model of Goriely [24] based on Hartree-Fock calculations; (v) LDM-5: microscopic combinatorial model of Goriely-Hilaire [25]; (vi) LDM-6: microscopic level density based on temperature dependent Hartree-Fock-Bogoliubov calculations [26] using the D1M Gogny force.In the Fermi gas model, the level density parameter 'a' can be derived fromD0, which is the s-wave average neutron resonance spacing (in keV) at the neutron separation energy. The experimental value ofD0for150Nd was obtained from the RIPL-3 database [27] and compared with the theoretical values predicted by the TALYS code for each LDM. The values ofD0are listed inTable 1.
Level density model Experimental value
ofD0/eVTheoretical value
ofD0/eVConstant temperature 0.165±0.015 6.21 Back-shifted Fermi gas 2.78 Generalized superfluid 3.47 Goriely 11.13 Goriely-Hilaire 2.94 Goriely-Hilaire Gogny force 2.39 Table 1.Experimental value ofD0for150Nd obtained from the RIPL-3 database and compared with the theoretical values predicted for each level density model by the TALYS-1.96 code.
In TALYS, the contribution of the compound nucleus is calculated using the Hauser-Feshbach model [28]. The preequilibrium contribution is calculated using the exciton [29] and multistep direct/compound models. Moreover, the OMP by Koning-Delaroche (KD) [30] is used. To consider theγ-ray emission channel, TALYS uses a fixedγ-ray strength function (γSF) model. In the present study, the Brink-Axel (BA) Lorentzian [31,32] and Kopecky-Uhl (KU) generalized Lorentzian [33] were used as theγSFs.
In this study, a combination of various input parameters and models were used assuming that the CSs of nuclear reactions are dependent on the nuclear level densities (NLDs), OMPs, andγSFs.
-
The results of the production CSs of150,149Pm and149Nd reported by Banerjeeet al.[18] are shown in panels (a), (b), and (c) ofFig. 1, along with the literature data of Lebedaet al.[16,17] and Olkowskyet al.taken from the EXFOR compilation [15]. These data were compared with the evaluated data from the TENDL-2023 [34] database. Note that the CS values obtained by Lebedaet al.via bombardment of protons on a natural150Nd target were scaled up to the absolute values obtained by Banerjeeet al.[18] considering the isotopic enrichment of150Nd. This is because Banerjeeet al.[18] used an enriched150Nd target. Similarly, inFig. 2, the measured CS data of148,146,144,143,141Pm and147Nd taken from the EXFOR compilation [15] and produced experimentally via proton-induced reactions onnatNd by Lebedaet al.[16,17], Yanget al.[1], and Tarkanyiet al.[19] are shown and compared with the evaluated data from the TENDL-2023 [34] database.
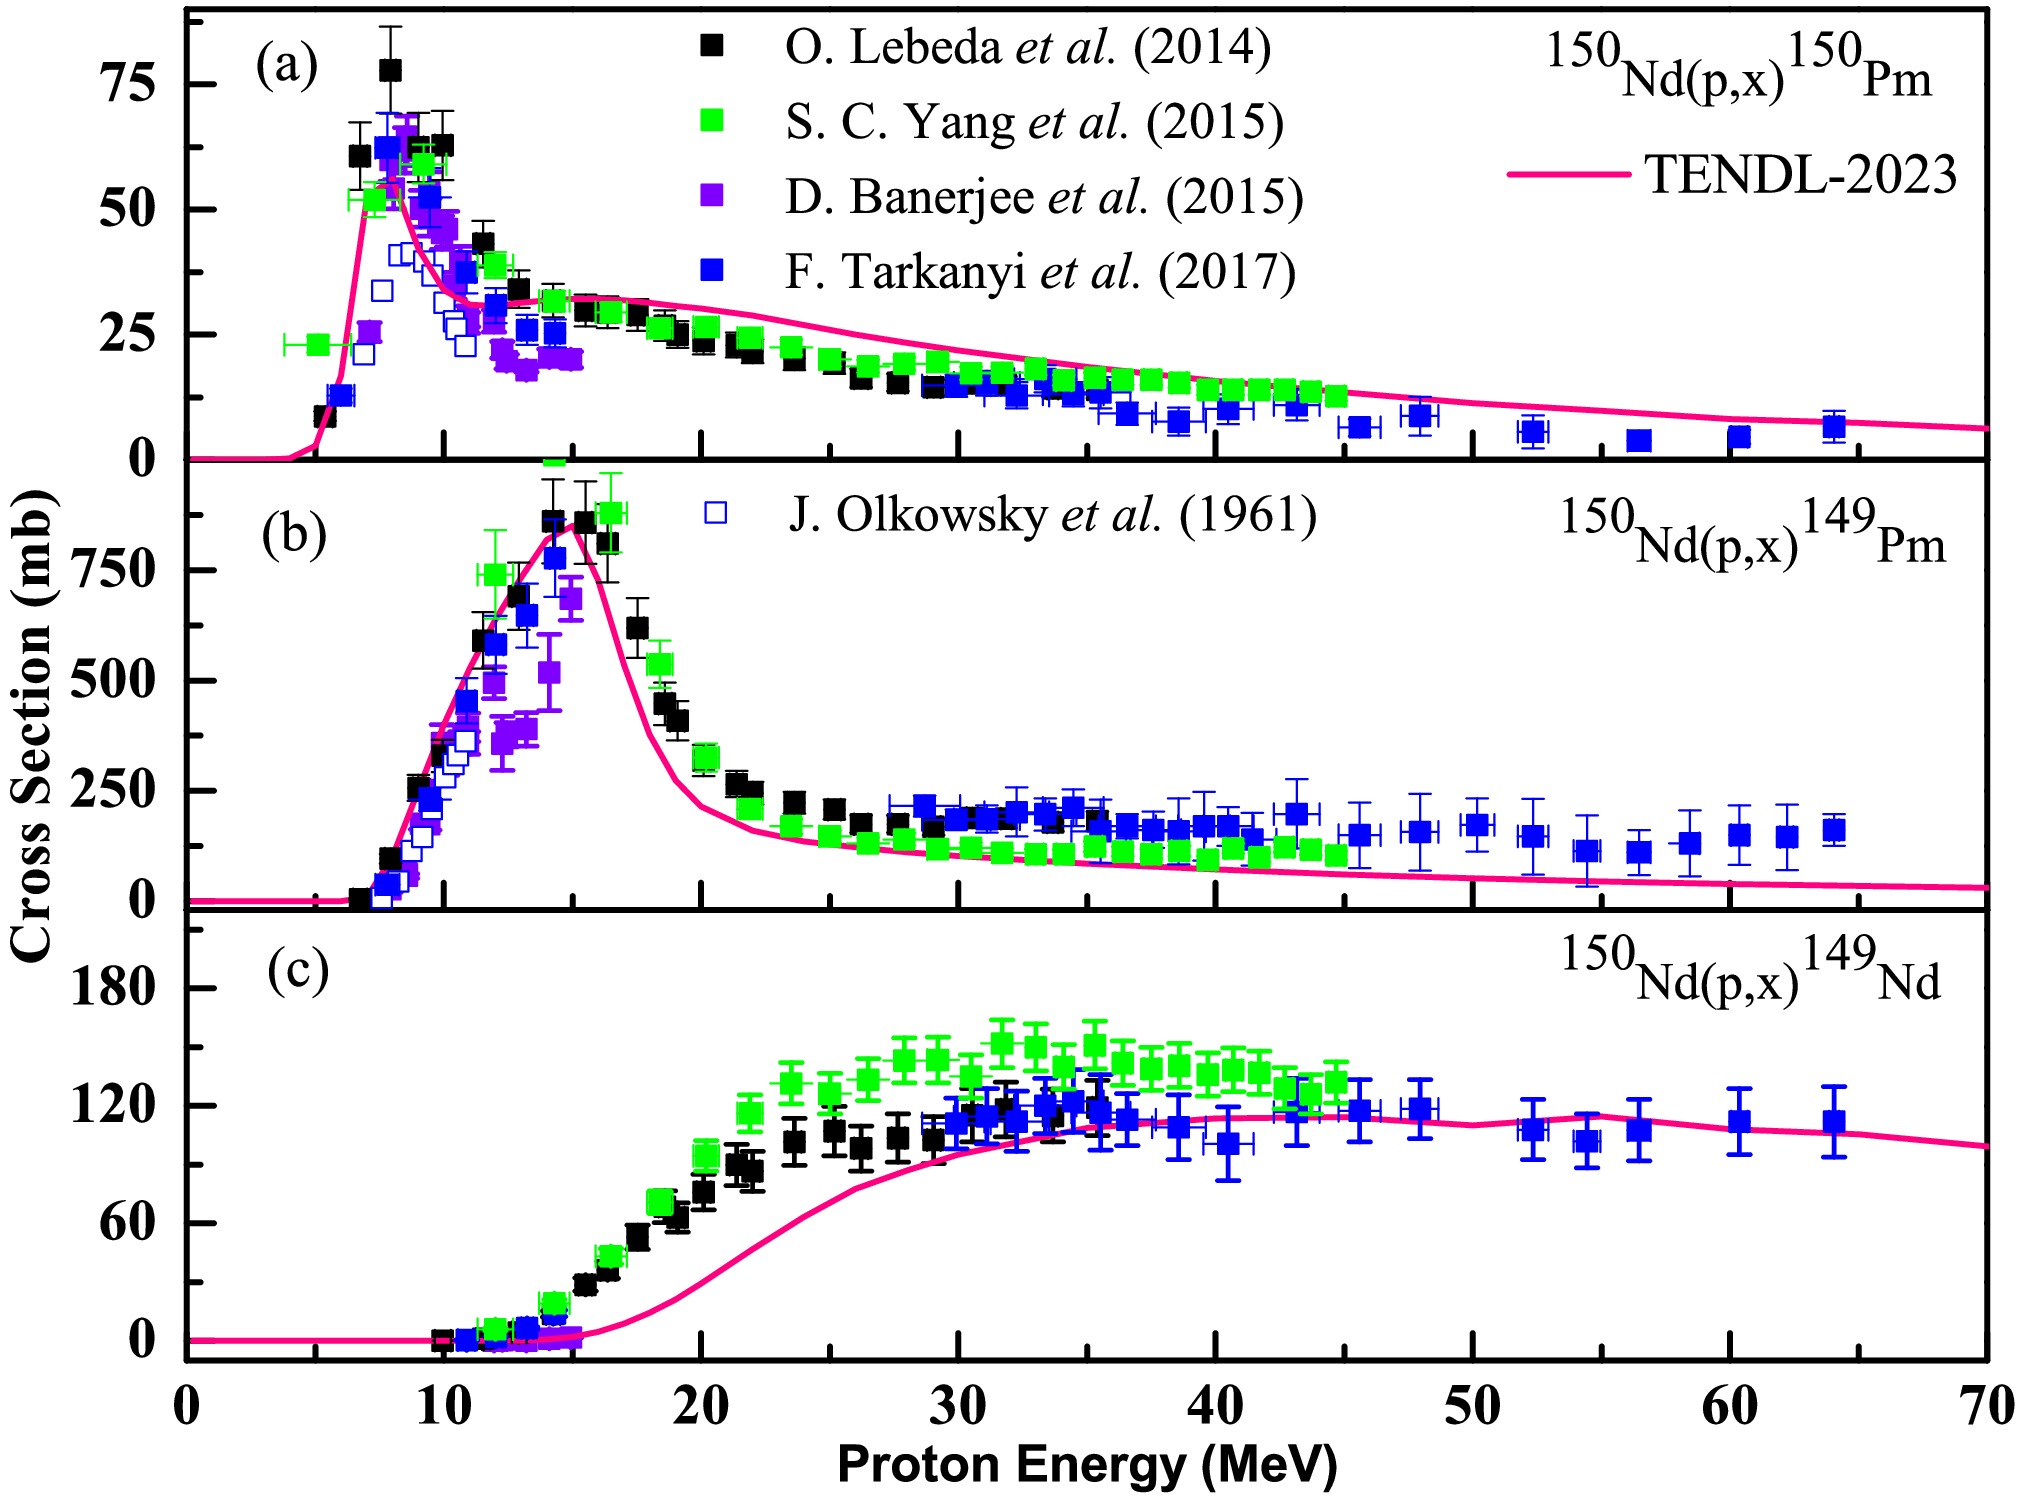
Figure 1.(color online) Data of Banerjeeet al.[18] for the (a)150Nd(p,n)150Pm, (b)150Nd(p, 2n)149Pm, and (c)150Nd(p;d,
$ pn $ )149Nd reactions compared with the previously published results of Olkowskyet al.[14] taken from the EXFOR database [15], Yanget al.[1], Tarkanyiet al.[19], and Lebedaet al.[16,17], along with the TENDL-2023 data [34]. -
TALYS calculations were performed for the150Nd(p,x)150,149Pm,149Nd,natNd(p,x)148,146,144,143,141Pm, and147Nd reactions using the default parameters with different phenomenological and microscopic LDMs along with KD local OMPs and a simplified model Lorentzian (SMLO) E1γSF. Along with the default mode, theoretical calculations were also performed using a combination of various model parameters for each of the above mentioned reactions to fine tune the theoretical results with the experimental data. The results of the theoretical calculations (both using the default mode and using different combinations of model parameters) for the various reactions are shown inFigs. 3to12.
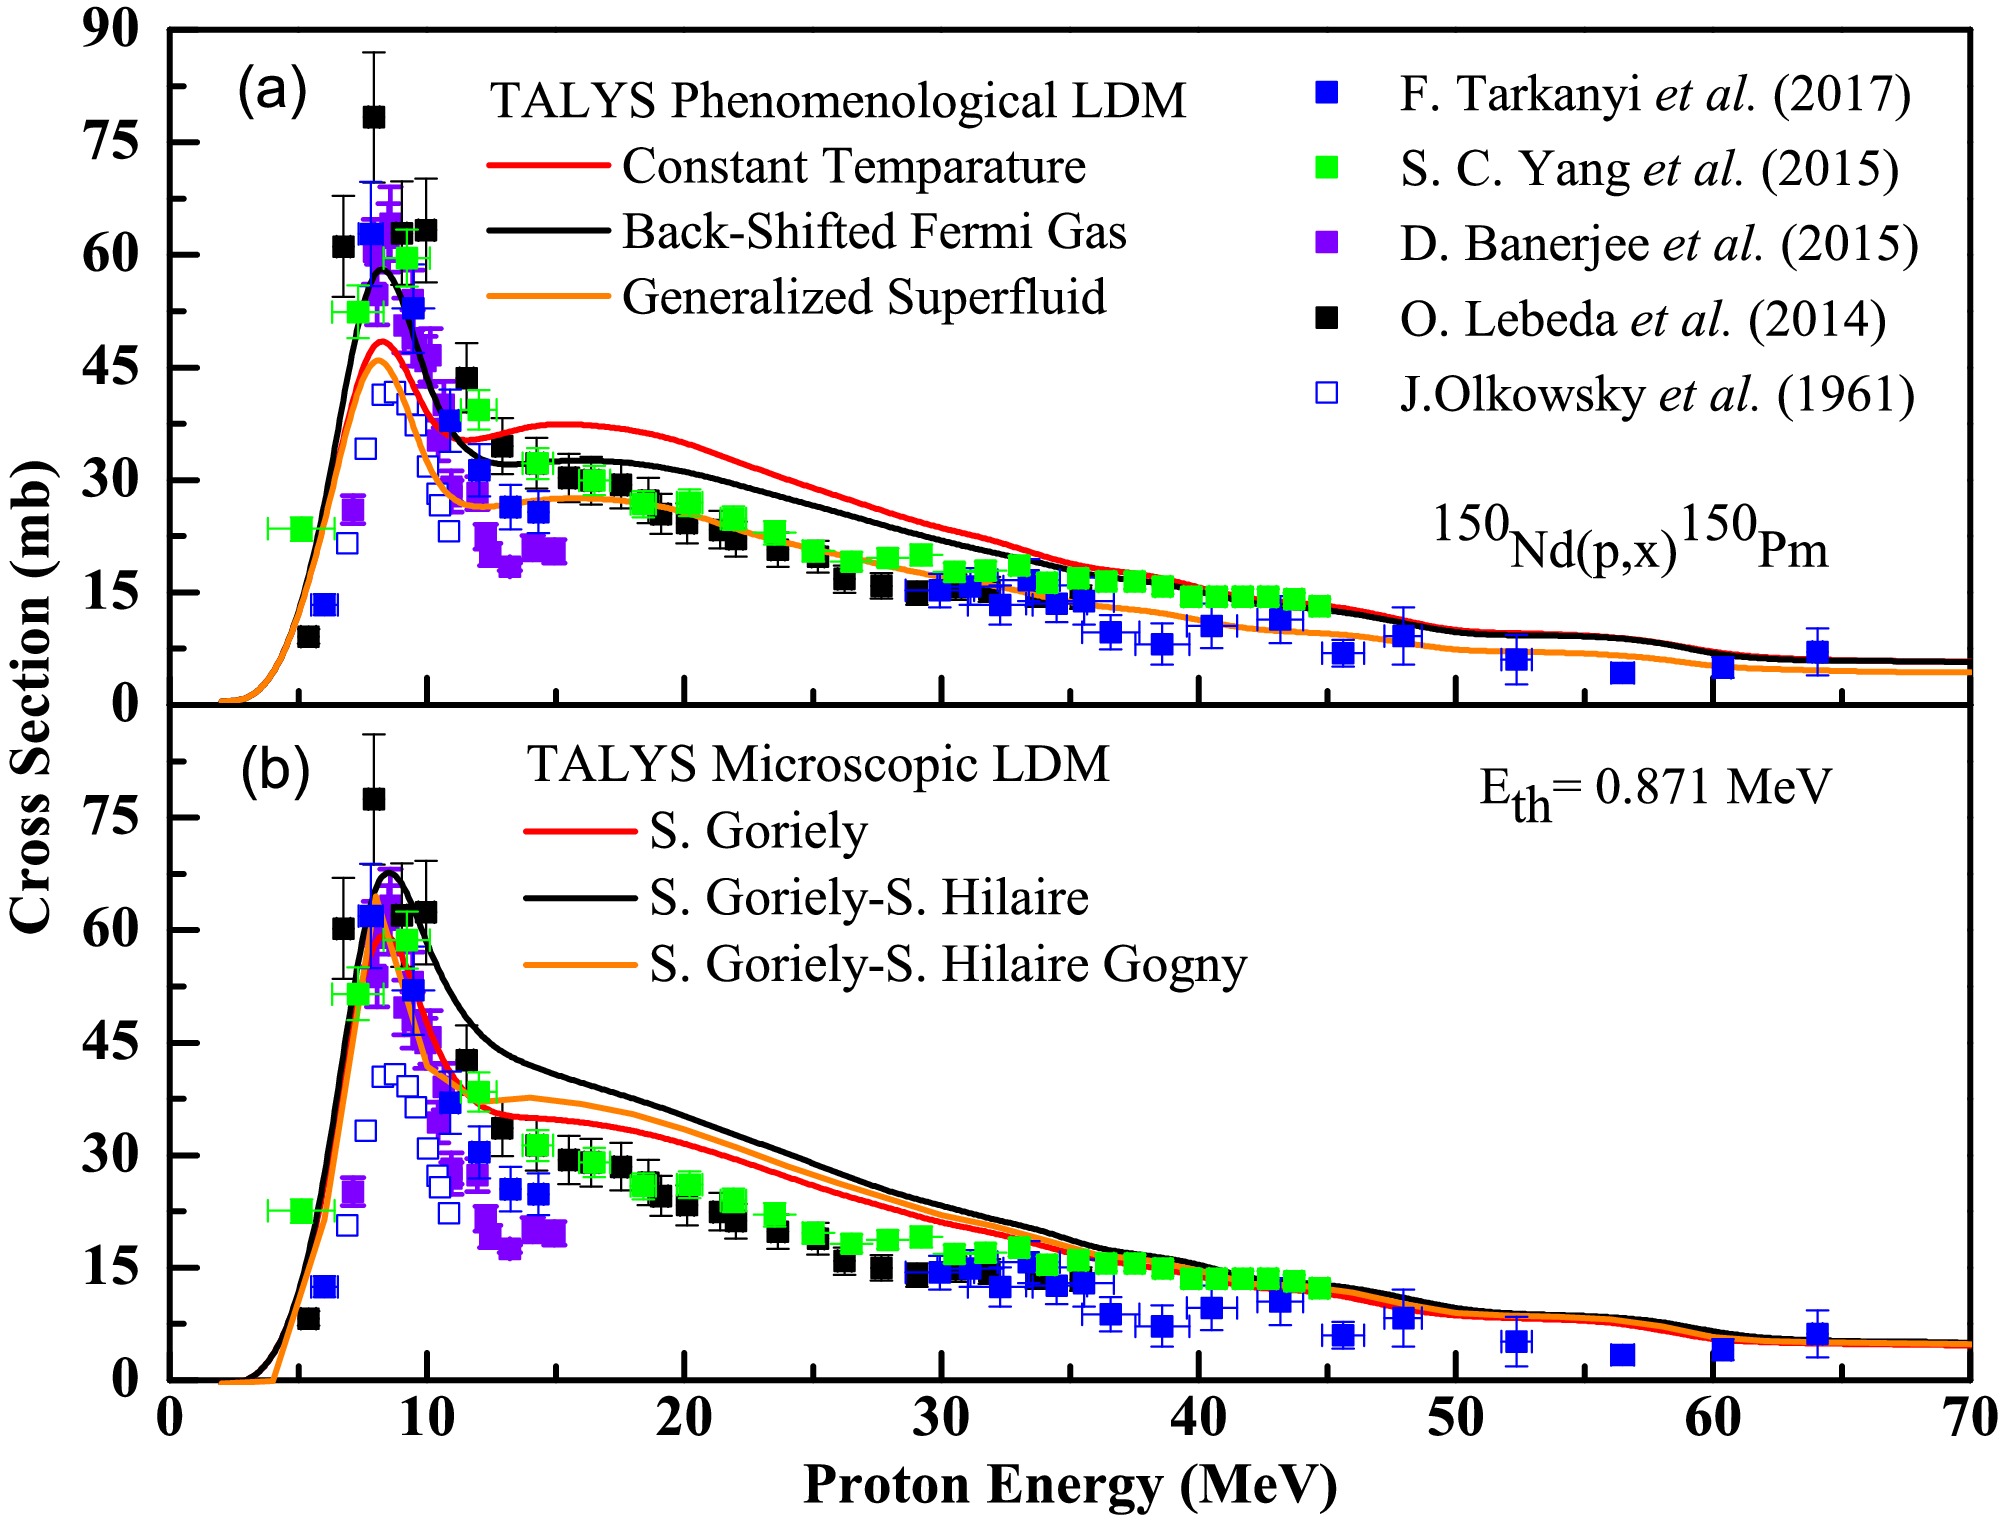
Figure 3.(color online) Experimental data for the150Nd(p,x)150Pm reaction from the previous works of Yanget al.[1], Olkowskyet al.[14], Lebedaet al.[16,17], Banerjeeet al.[18], and Tarkanyiet al.[19] compared with the (a) phenomenological and (b) microscopic level density model calculations based on TALYS code with the default option. Discrepancies were observed between the experimental data and the theoretically predicted cross section values at various energies calculated using six different level density models in the default mode.
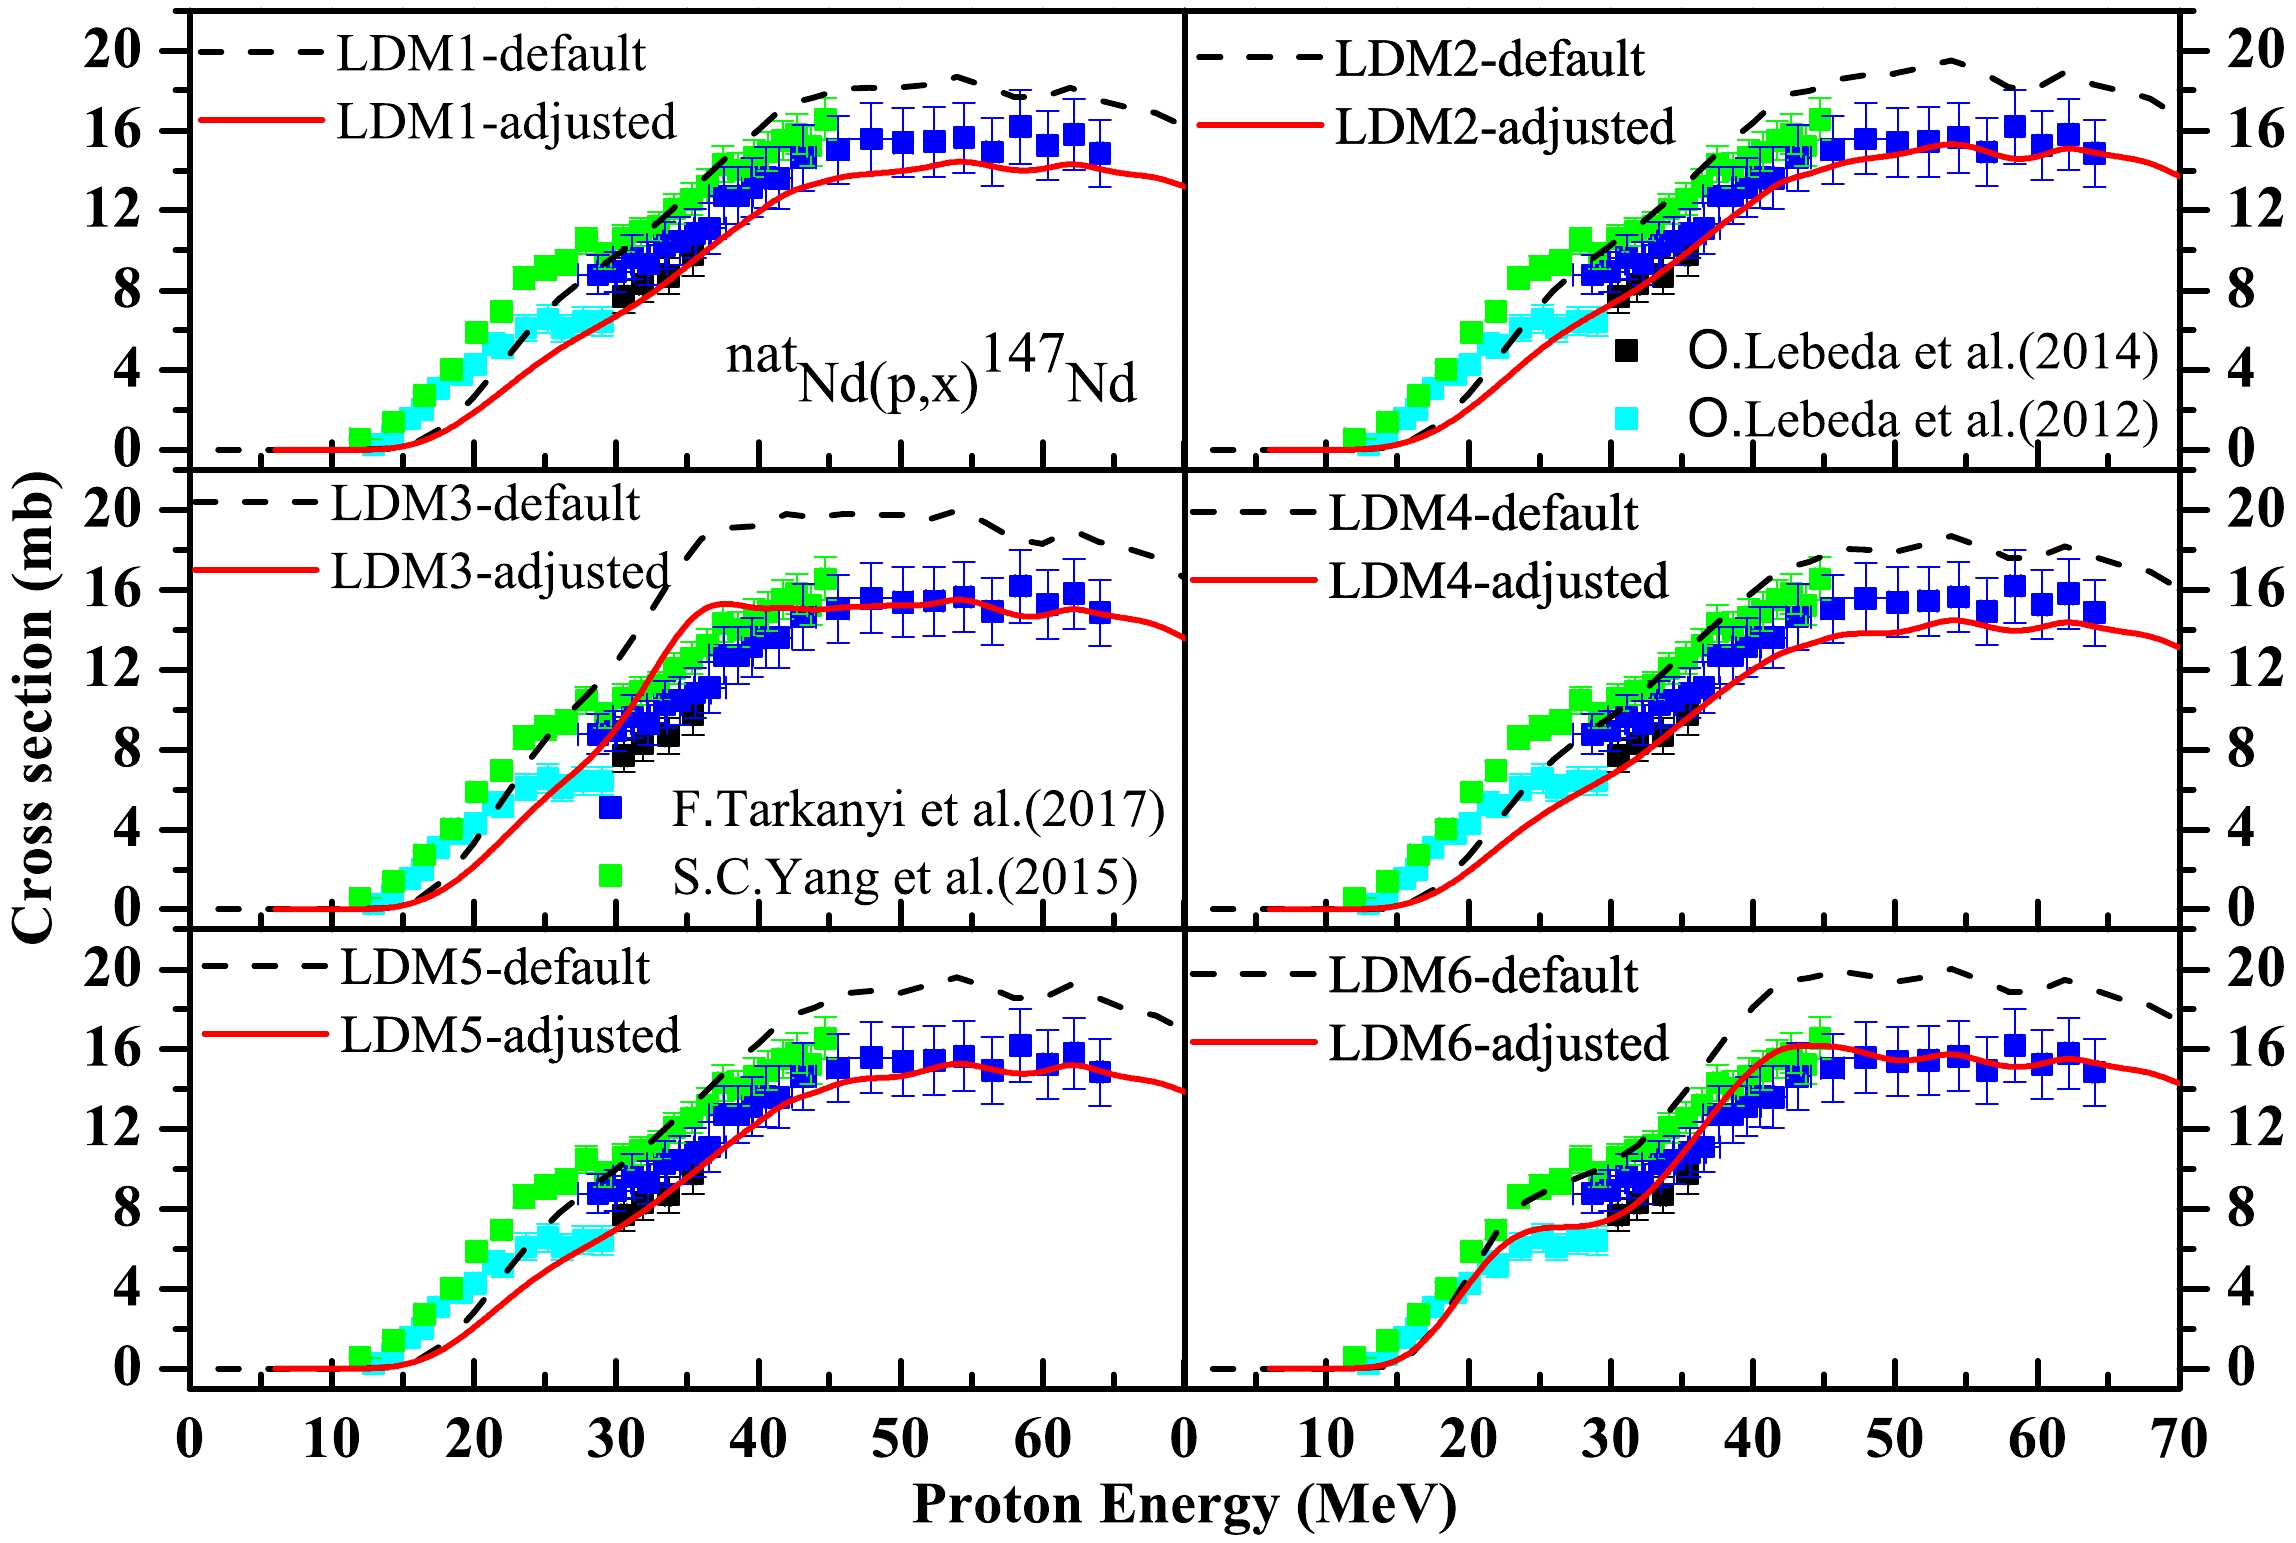
Figure 12.(color online) Experimentally measured data for thenatNd(p,x)147Nd reaction obtained from the literature compared with the phenomenological theoretical calculations based on TALYS code with different combinations of model parameters. The dotted and red continuous lines indicate the theoretically estimated CSs using TALYS in the default mode and using different combinations of model parameters, respectively.ers, respectively.
-
For the150Nd(p,x)150Pm reaction (Fig. 3), the constant temperature model in the default mode could effectively reproduce the variation trend in the CS data reported by the various groups up to a proton energy of 10 MeV. Beyond this energy and up to 35 MeV, the theoretical results generated by the constant temperature model overestimated the experimental data reported by Banerjeeet al.[18], Lebedaet al.[16,17], Yanget al.[1], and Tarkanyiet al.[19]. In the 35–45 MeV proton energy range, the theoretically calculated CSs using the constant temperature model matched well with the data reported by Yanget al.[1], and in the 45−65 MeV range, they matched closely with the data reported by Tarkanyiet al.[19]. The results of the back shifted Fermi gas model in its default mode matched the experimental results reported by Banerjeeet al.[18] only up to a proton energy of
$\sim$ 12.5 MeV. They matched the variation and magnitude trends of the results reported by Lebedaet al.[16,17] reasonably well up to an energy of 17.5 MeV. Beyond this and up to 30 MeV, a discrepancy was observed between the theoretical and experimental results. Beyond this energy, the CS prediction of this model matched well with the data reported by Yanget al.[1] in the 35−45 MeV range and with those by Tarkanyiet al.[19] in the 45−65 MeV range. At a proton energy of 11−15 MeV, a discrepancy was observed between the theoretical calculations of the generalized superfluid model in the default mode and the results reported by Banerjeeet al.[18]. The shape and magnitude of the excitation function produced by this model matched well with the results reported by Olkowskyet al.[14] in the 5−10 MeV range. In the 15–35 MeV range, they matched well with those of Lebedaet al.and Yanget al.[1]. Beyond 35 MeV, the predictions of this model matched only with the data of Tarkanyiet al.[19]. The default theoretical results of all the microscopic LDMs (i.e., LDM-4, LDM-5, and LDM-6) (see panel-(b) ofFig. 3) overestimated the experimental results reported by Lebedaet al.[16,17], Yanget al.[1], and Banerjeeet al.[18] beyond a proton energy of 11–12 MeV and up to 35 MeV. Beyond 35 MeV, they matched closely with the data reported by Yanget al.[1] up to 45 MeV and with those of Tarkanyiet al.[19] in the 45−65 MeV range. The variation pattern of the theoretical results of all the phenomenological and microscopic LDMs was similar to that reported by Olkowskyet al.in the 6−11 MeV range.Considering the large discrepancies between the measured CSs and the theoretical results from TALYS using default parameters, the theoretical values were revised with different combinations of nuclear models and/or model parameters in an attempt to reproduce the experimental results more accurately. Simultaneously, the OMPs, LDMs, and PEs, which are of utmost importance, were individually adjusted. For example, the behavior of the constant temperature model was significantly improved by combining the KD local optical potential with the Brink-Axel Lorentzian as the gamma strength function and preequmode 3 as the PE. The response of the back-shifted Fermi gas model was improved by combining the KD local dispersive model with the Brink-Axel Lorentzian and preeqmode 3. For both of the above LDMs, the parameters "asys" and "fullhf" were enabled to match with the experimental data. The parameter "asys" is a flag to use all level density parameters from systematics by default and "gshell" is used to include the damping of shell effects with excitation energy in single-particle level densities. The generalized superfluid model was improved by combining the KD global potential with the Brink-Axel Lorentzian. For this model, the parameters "asys" and "gshell" were enabled. The response of the microscopic models of Goriely and Goriely-Hilaire was improved via the combination of the KD global OMP and KU generalized LorentzianγSF along with preequilibrium model 3. For the former microscopic model of Goriely, the parameter "gshell" was enabled. Similarly, the behavior of the microscopic model of the Goriely-Hilaire Gogny force was improved by combining the KD global OMP with the Brink-Axel Lorentzian and preequilibrium model 3. For all the aforementioned phenomenological and microscopic LDMs, the parameter "fullhf" was enabled and the Hofmann-Richert-Tepel-Weidenm
$ \ddot{u} $ ller (HRTW) model was used. This is worth mentioning that the parameter "fullhf" takes care of j-l coupling in the Hauser-Feshback theory. SeeFig. 4andTable 2for further details.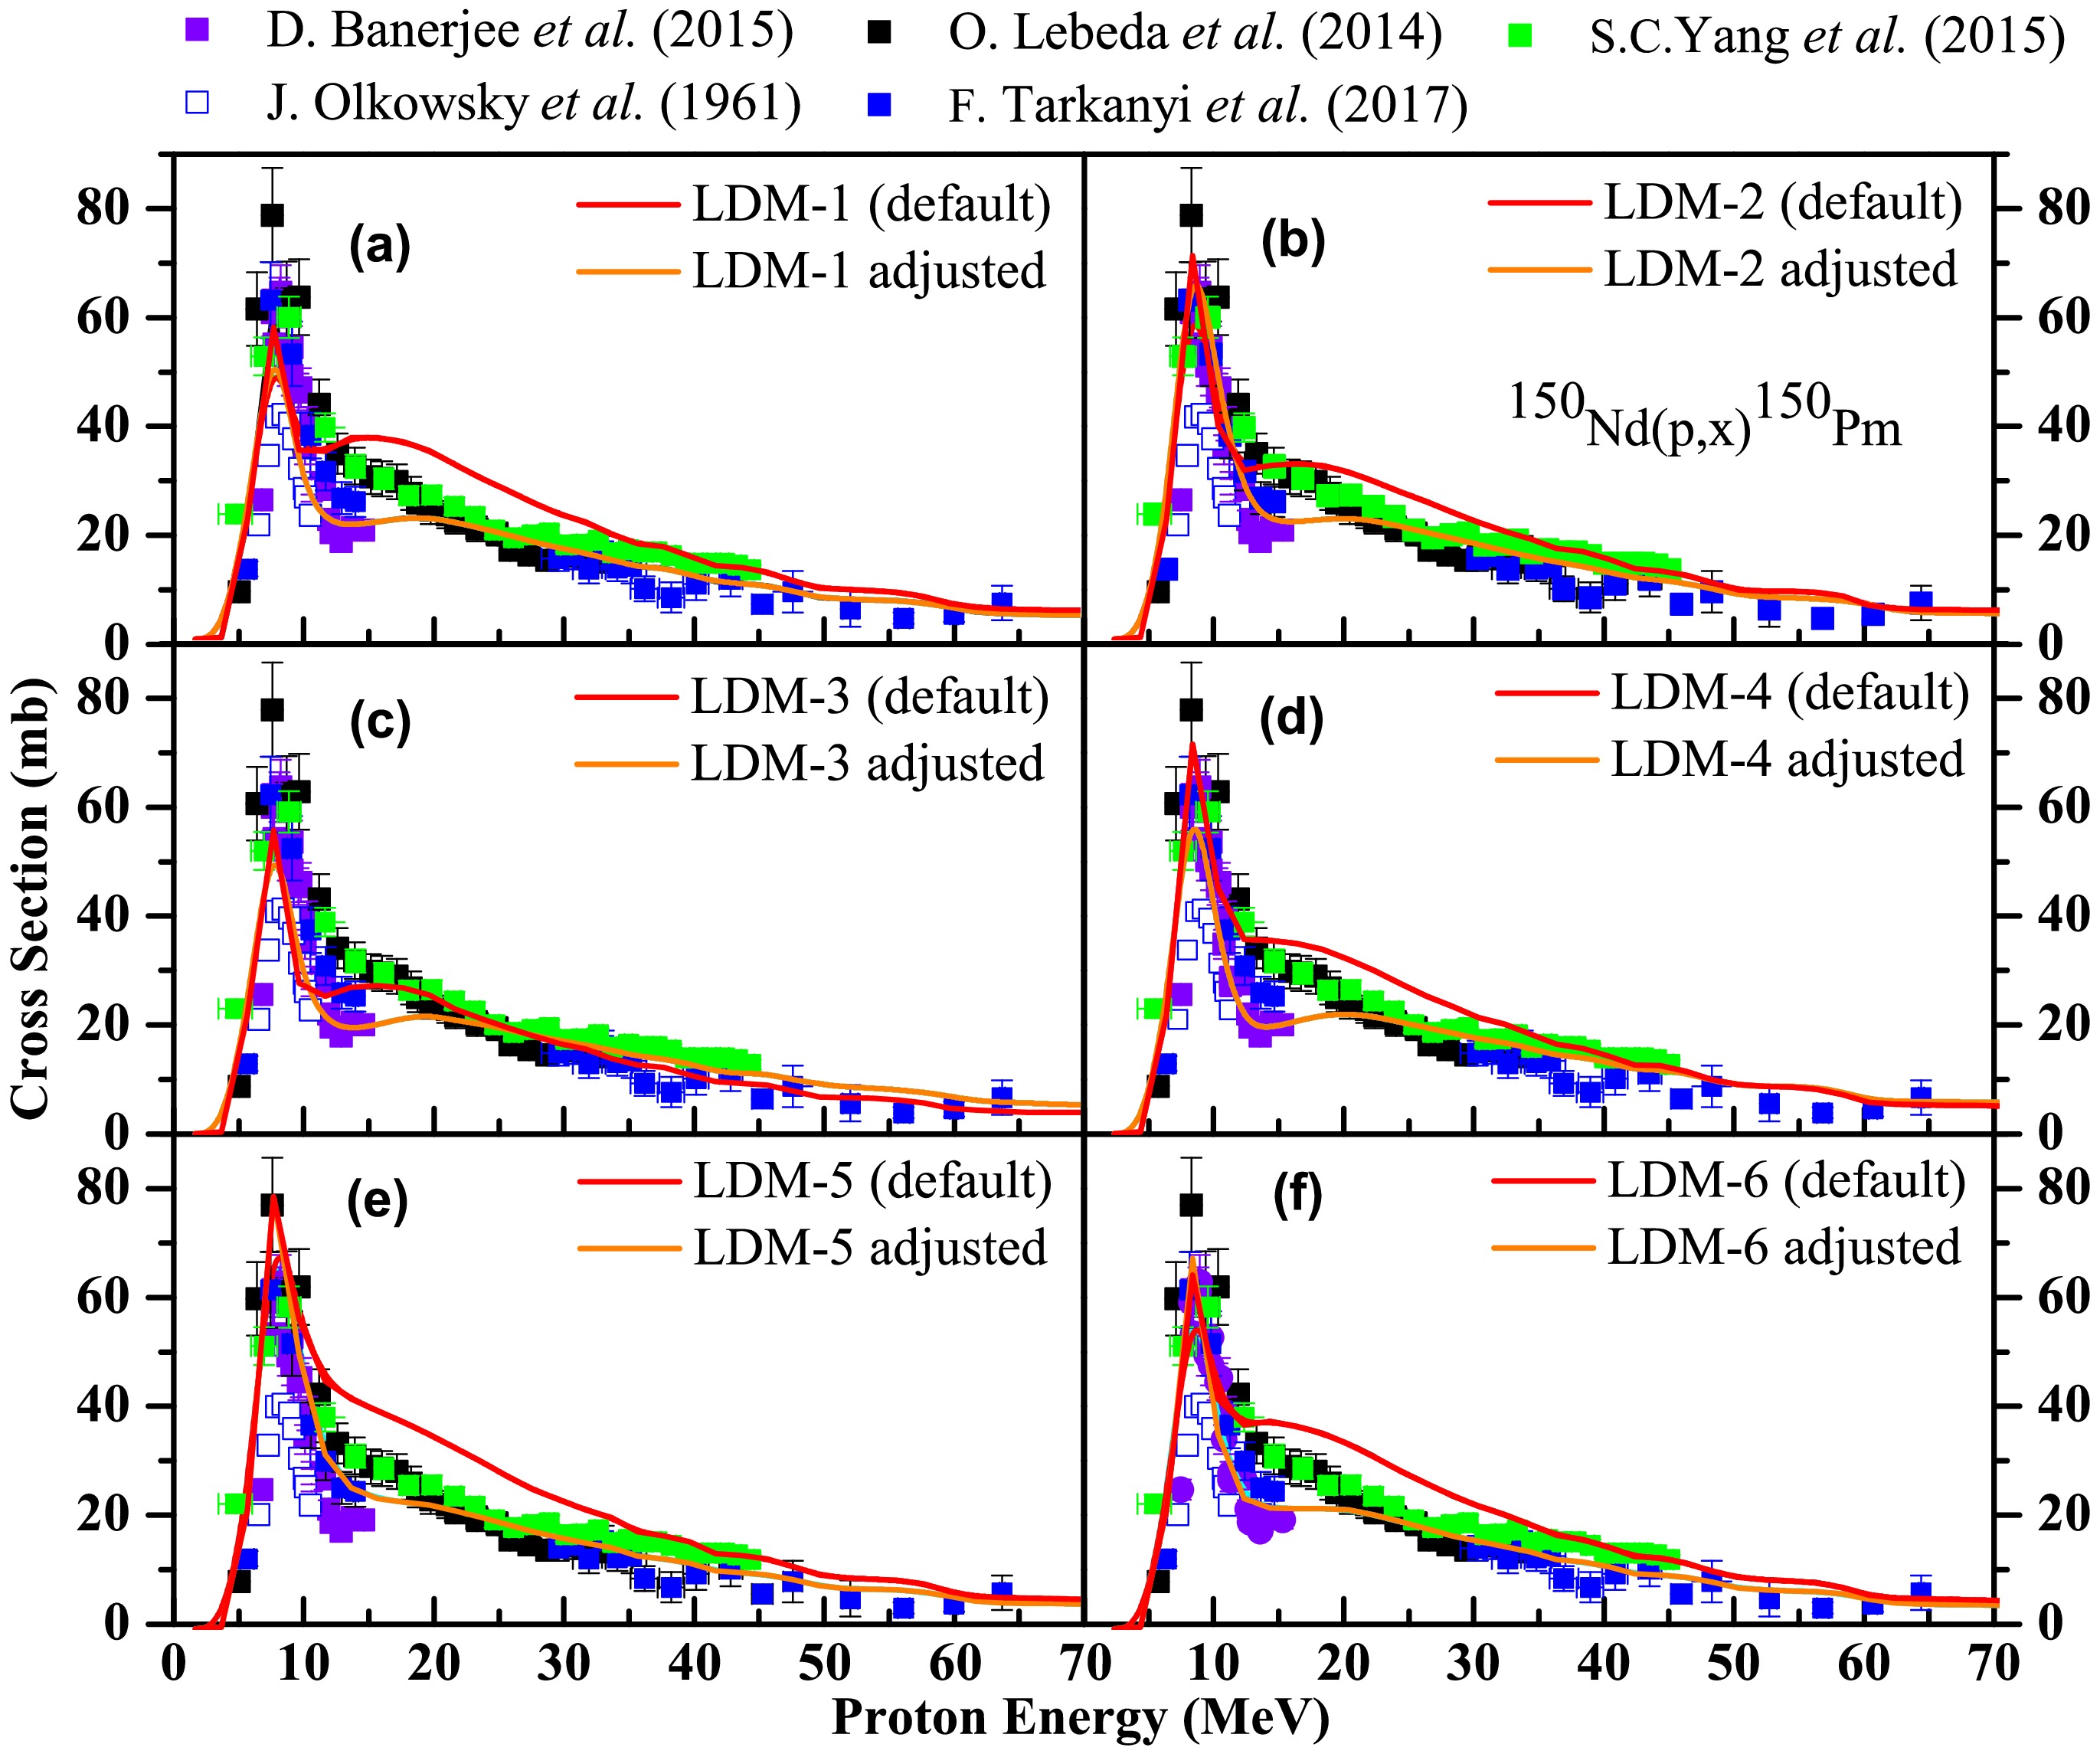
Figure 4.(color online) Experimentally measured data for the150Nd(p,x)150Pm reaction obtained from the literature compared with the phenomenological theoretical calculations based on TALYS code with different combination of nuclear models and model parameters. The red and sky-blue continuous lines indicate the theoretically estimated CSs using TALYS in the default mode and using different combinations of model parameters, respectively
Level density model Optical model potential γSFs Preequilibrium model Widthmode Parameters Constant temperature Koning-Delaroche Brink-Axel preeqmode 3 HRTW model fullhf y local Lorentzian asys y strength 2 widthmode 2 Back-shifted Koning-Delaroche Brink-Axel preeqmode 3 HRTW model fullhf y Fermi gas local dispersive Lorentzian asys y potential strength 2 widthmode 2 Generalized Koning-Delaroche Brink-Axel preeqmode 3 HRTW model fullhf y superfluid global Lorentzian asys y gshell y strength 2 widthmode 2 Goriely Koning-Delaroche Kopecky-Uhl preeqmode 3 HRTW model fullhf y global generalized gshell y lorentzian strength 1 widthmode 2 Goriely-Hilaire Koning-Delaroche Kopecky-Uhl preeqmode 3 HRTW model fullhf y global generalized strength 1 lorentzian widthmode 2 Goriely-Hilaire Koning-Delaroche Brink-Axel preeqmode 3 HRTW model fullhf y Gogny force global Lorentzian strength 2 widthmode 2 Table 2.Details of the different statistical models and parameters used in TALYS calculations for the150Nd(p,x)150Pm reaction.
-
Similarly, for the150Nd(p,x)149Pm reaction (Fig. 5), the excitation function generated by the theoretical calculations of all the phenomenological and microscopic models peaked at approximately 15 MeV. Up to this energy value, the theoretical results calculated by the various models matched the experimentally calculated CS values reasonably well (except the CS values at proton energies of 12.44, 13.21, 14.10, and 14.94 MeV reported by Banerjeeet al.[18]). Beyond the peak value, the phenomenological LDMs underestimated the CS values. Although the microscopic LDMs produced results with a trend similar to that of the experimental results, a small overestimation and underestimation was observed at some energy values in the 15–65 MeV range.
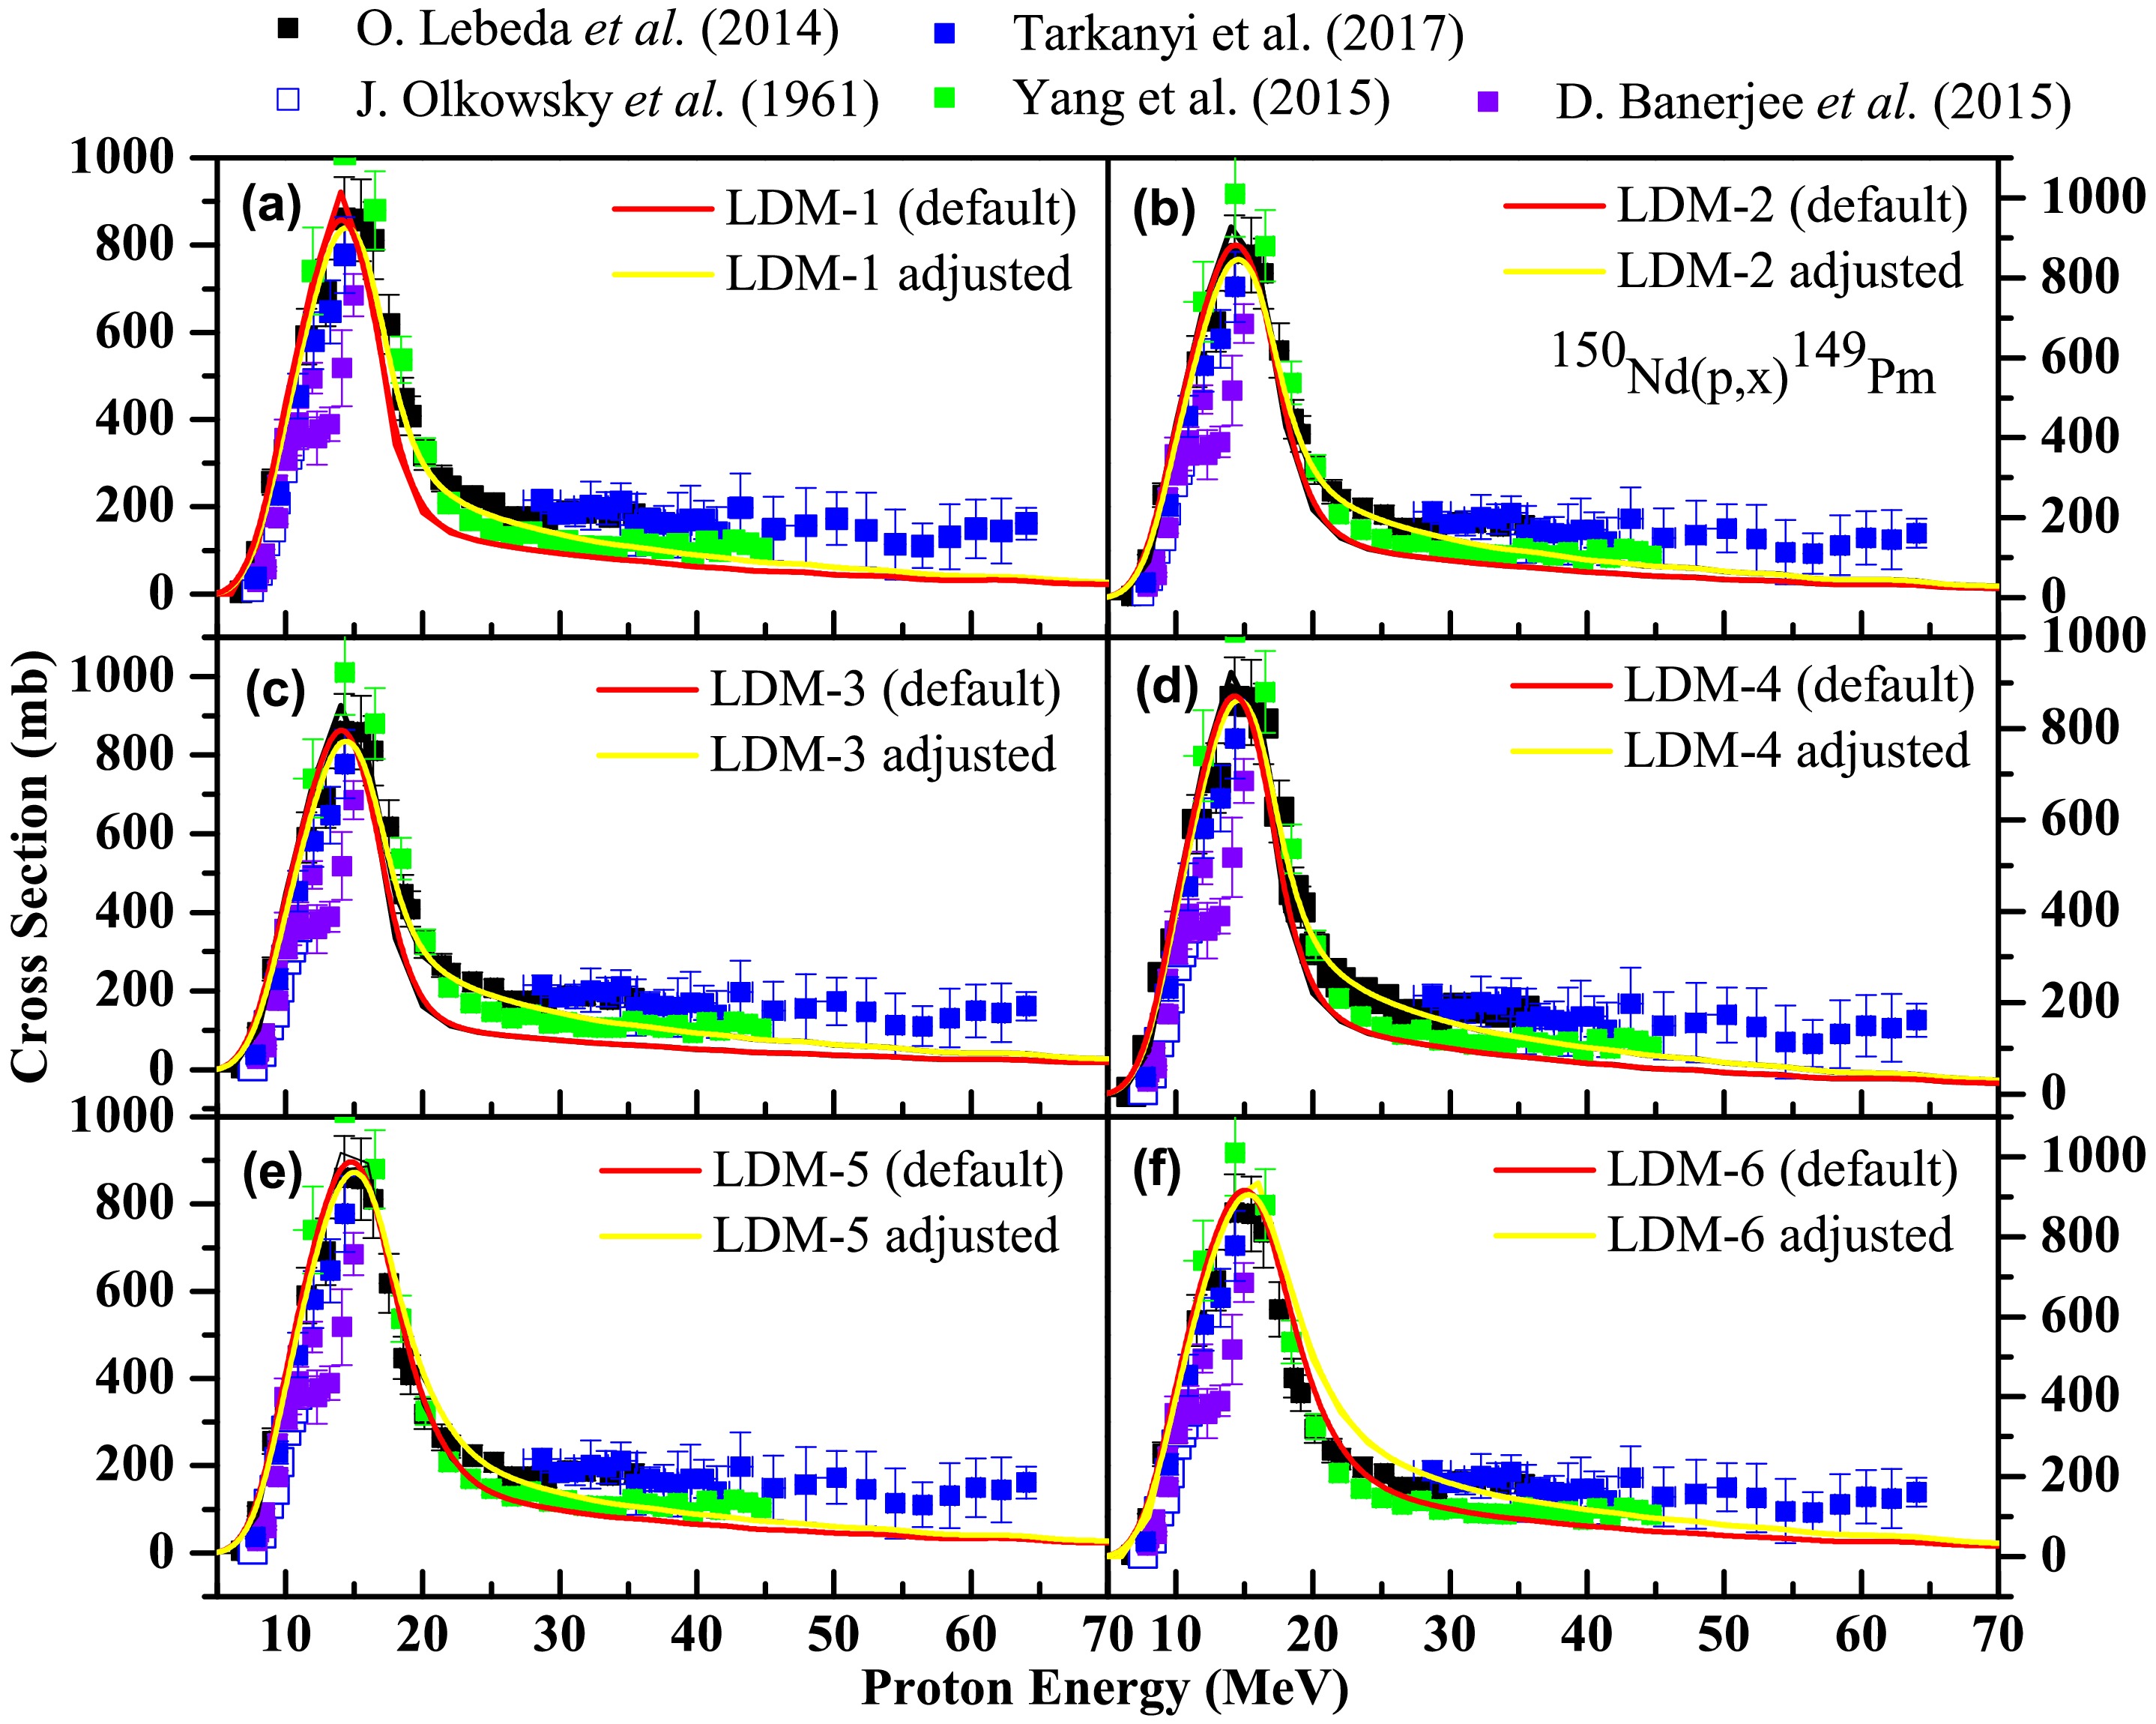
Figure 5.(color online) Experimentally measured data for the150Nd(p,x)149Pm reaction obtained from the literature compared with the phenomenological theoretical calculations based on TALYS code with different combinations of nuclear models and/or model parameters. The red and yellow continuous lines indicate the theoretically estimated CSs using the default mode and different combinations of nuclear models, respectively.
However, to improve the behavior of the constant temperature model, a combination of the KD local OMP and Brink-Axel Lorentzian was used along with enabled "asys" and "gshell" parameters. Similarly, for the back-shifted Fermi gas and generalized superfluid models, the combinations of the KD local dispersive model & KU generalized Lorentzian and KD global & Brink-Axel Lorentzian were used as the OMP andγSF, respectively. The parameter "asys" was also enabled for these LDMs to improve their behavior. For the microscopic models of Goriely & Goriely-Hilaire, the combination of the KD global OMP and KU generalized lorentizianγSF was used along with the enabled parameters of "gshell" and/or "asys." For the LDM of the Goriely-Hilaire Gogny force, the KD global OMP was combined with KU generalized Lorentzian. Moreover, for all the above LDMs, widthmode 2 (i.e., HRTW model) was used and the "fullhf" parameter was enabled. The parameter "widthmode" was used to include a model for width mode fluctuation corrections in compound nucleus calculations. For all the LDMs, preequilibrium model 4,i.e., the multi-step direct or compound model, was used. Refer toFig. 5andTable 3for more details.
Level density model Optical model potential γSFs Preequilibrium model Widthmode Parameters Constant temperature Koning-Delaroche local Brink-Axel Lorentzian preeqmode 4 HRTW model fullhf y strength 2 widthmode 2 asys y gshell y Back-shifted Fermi gas Koning-Delaroche local Kopecky-Uhl generalized preeqmode 4 HRTW model strength 1 dispersive Lorentzian Lorentzian fullhf y widthmode 2 asys y Generalized superfluid Koning-Delaroche global Brink-Axel Lorentzian preeqmode 4 HRTW model fullhf y asys y widthmode 2 Goriely Koning-Delaroche global Kopecky-Uhl generalized preeqmode 4 HRTW model fullhf y lorentzian gshell y ptable 61 149 -0.25238 widthmode 2 Goriely-Hilaire Koning-Delaroche global Kopecky-Uhl generalized preeqmode 4 HRTW model fullhf y lorentzian strength 1 widthmode 2 asys y gshell y Goriely-Hilaire Gogny Koning-Delaroche global Kopecky-Uhl generalized preeqmode 4 HRTW model fullhf y force lorentzian strength 1 widthmode 2 Table 3.Details of the different statistical models and parameters used in TALYS calculations for the150Nd(p,x)149Pm reaction
-
For the150Nd(p,x)149Nd reaction (Fig. 6), the excitation functions generated by the theoretical calculations of all the LDMs (both phenomenological and microscopic) satisfactorily followed the variation and magnitude trends of the experimental data reported by the various groups up to 30 MeV. Beyond this energy, the theoretical calculations overestimated the CS values and did not provide satisfactory results in the default mode.
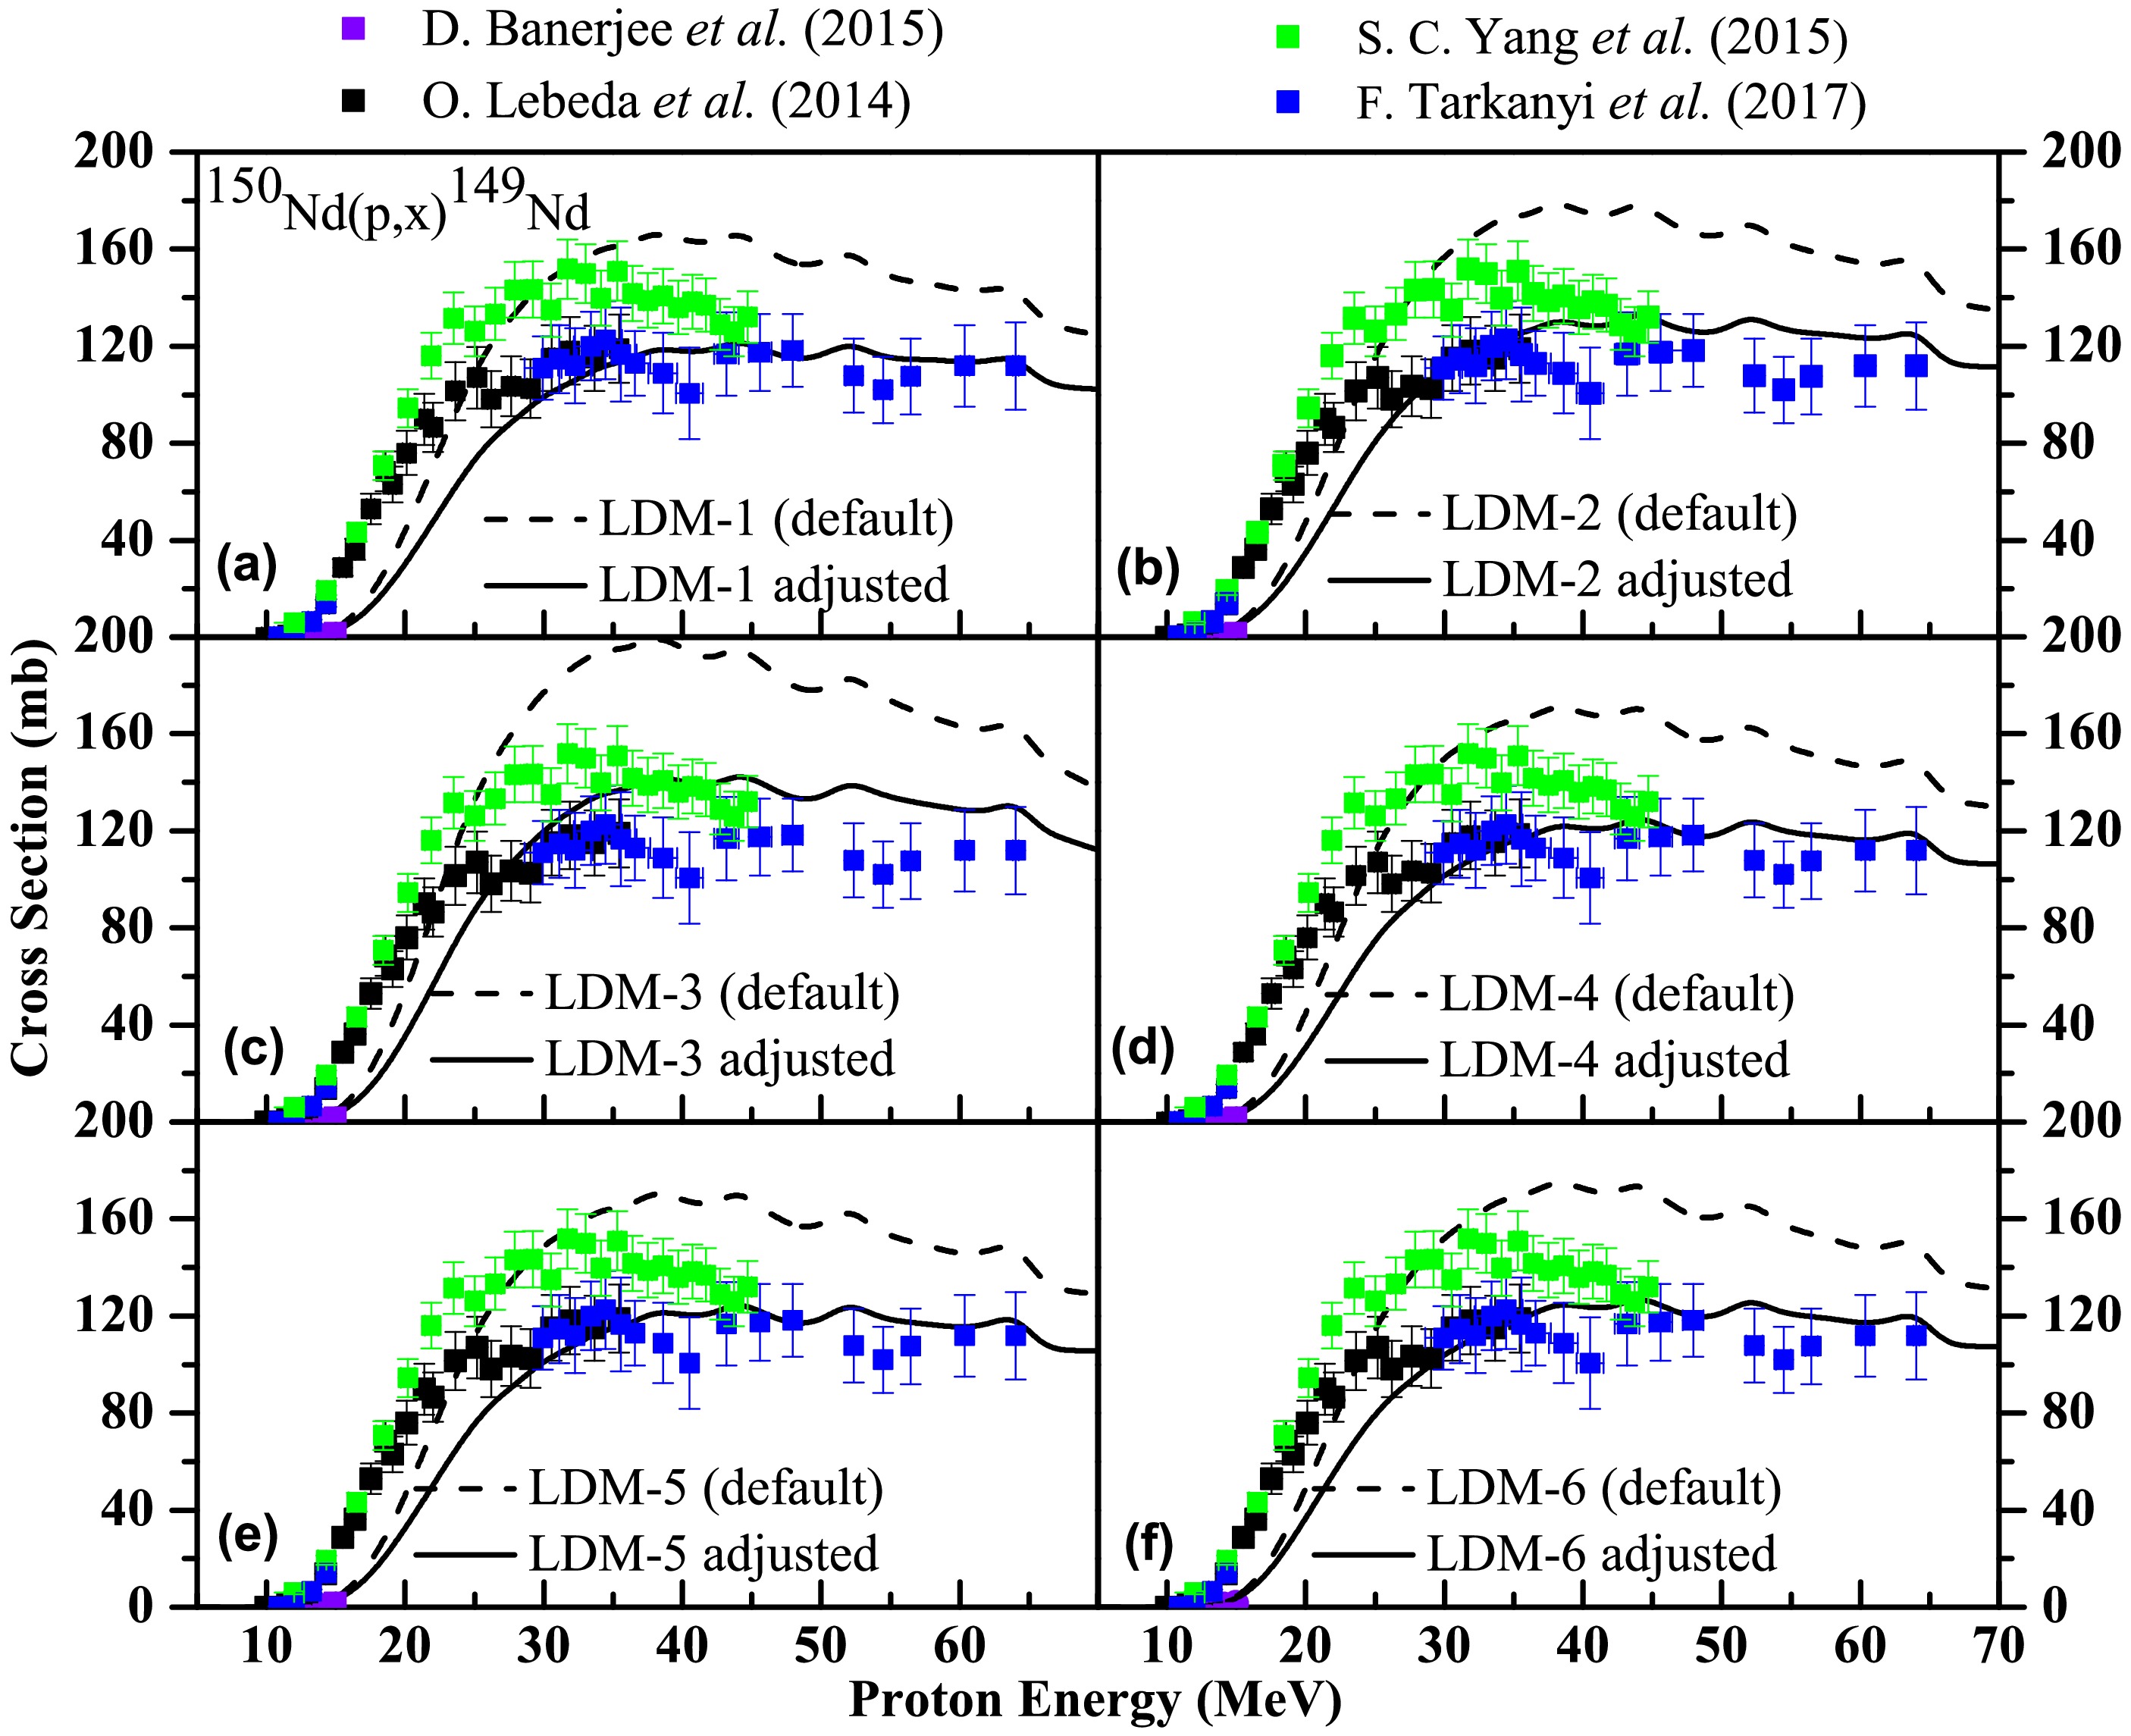
Figure 6.(color online) Experimentally measured data for the150Nd(p,x)149Nd reactions obtained from the literature compared with the phenomenological theoretical calculations based on TALYS code in the default mode and with different combinations of model parameters. The dotted and continuous lines indicate the theoretically estimated CSs using TALYS in the default mode and using different combinations of model parameters, respectively
However, the responses of the various LDMs ranging from LDM-1 to LDM-6 improved significantly for150Nd(p,x)149Nd reactions when the PE was changed from preeqmode 2 (default exciton model) to preeqmode 3 (numerical transition rates with an optical model for collision probability).Fig. 6shows the effect of the change in the preequilibrium mode on the response of the different LDMs for the respective reaction channels.
-
For thenatNd(p,x)148gPm reaction (Fig. 7), the predictions of the theoretical calculations based on both the phenomenological and microscopic LDMs matched reasonably well up to a proton energy of 15 MeV and beyond 30 MeV. In the 15–30 MeV proton energy range, the various LDMs used in the default mode overestimated the CS values when compared to the experimental data reported by the various groups. Moreover, as shown inFigs. 7(a) and7(b), slight changes in the peak position of the excitation functions were observed with the variation in the LDM.
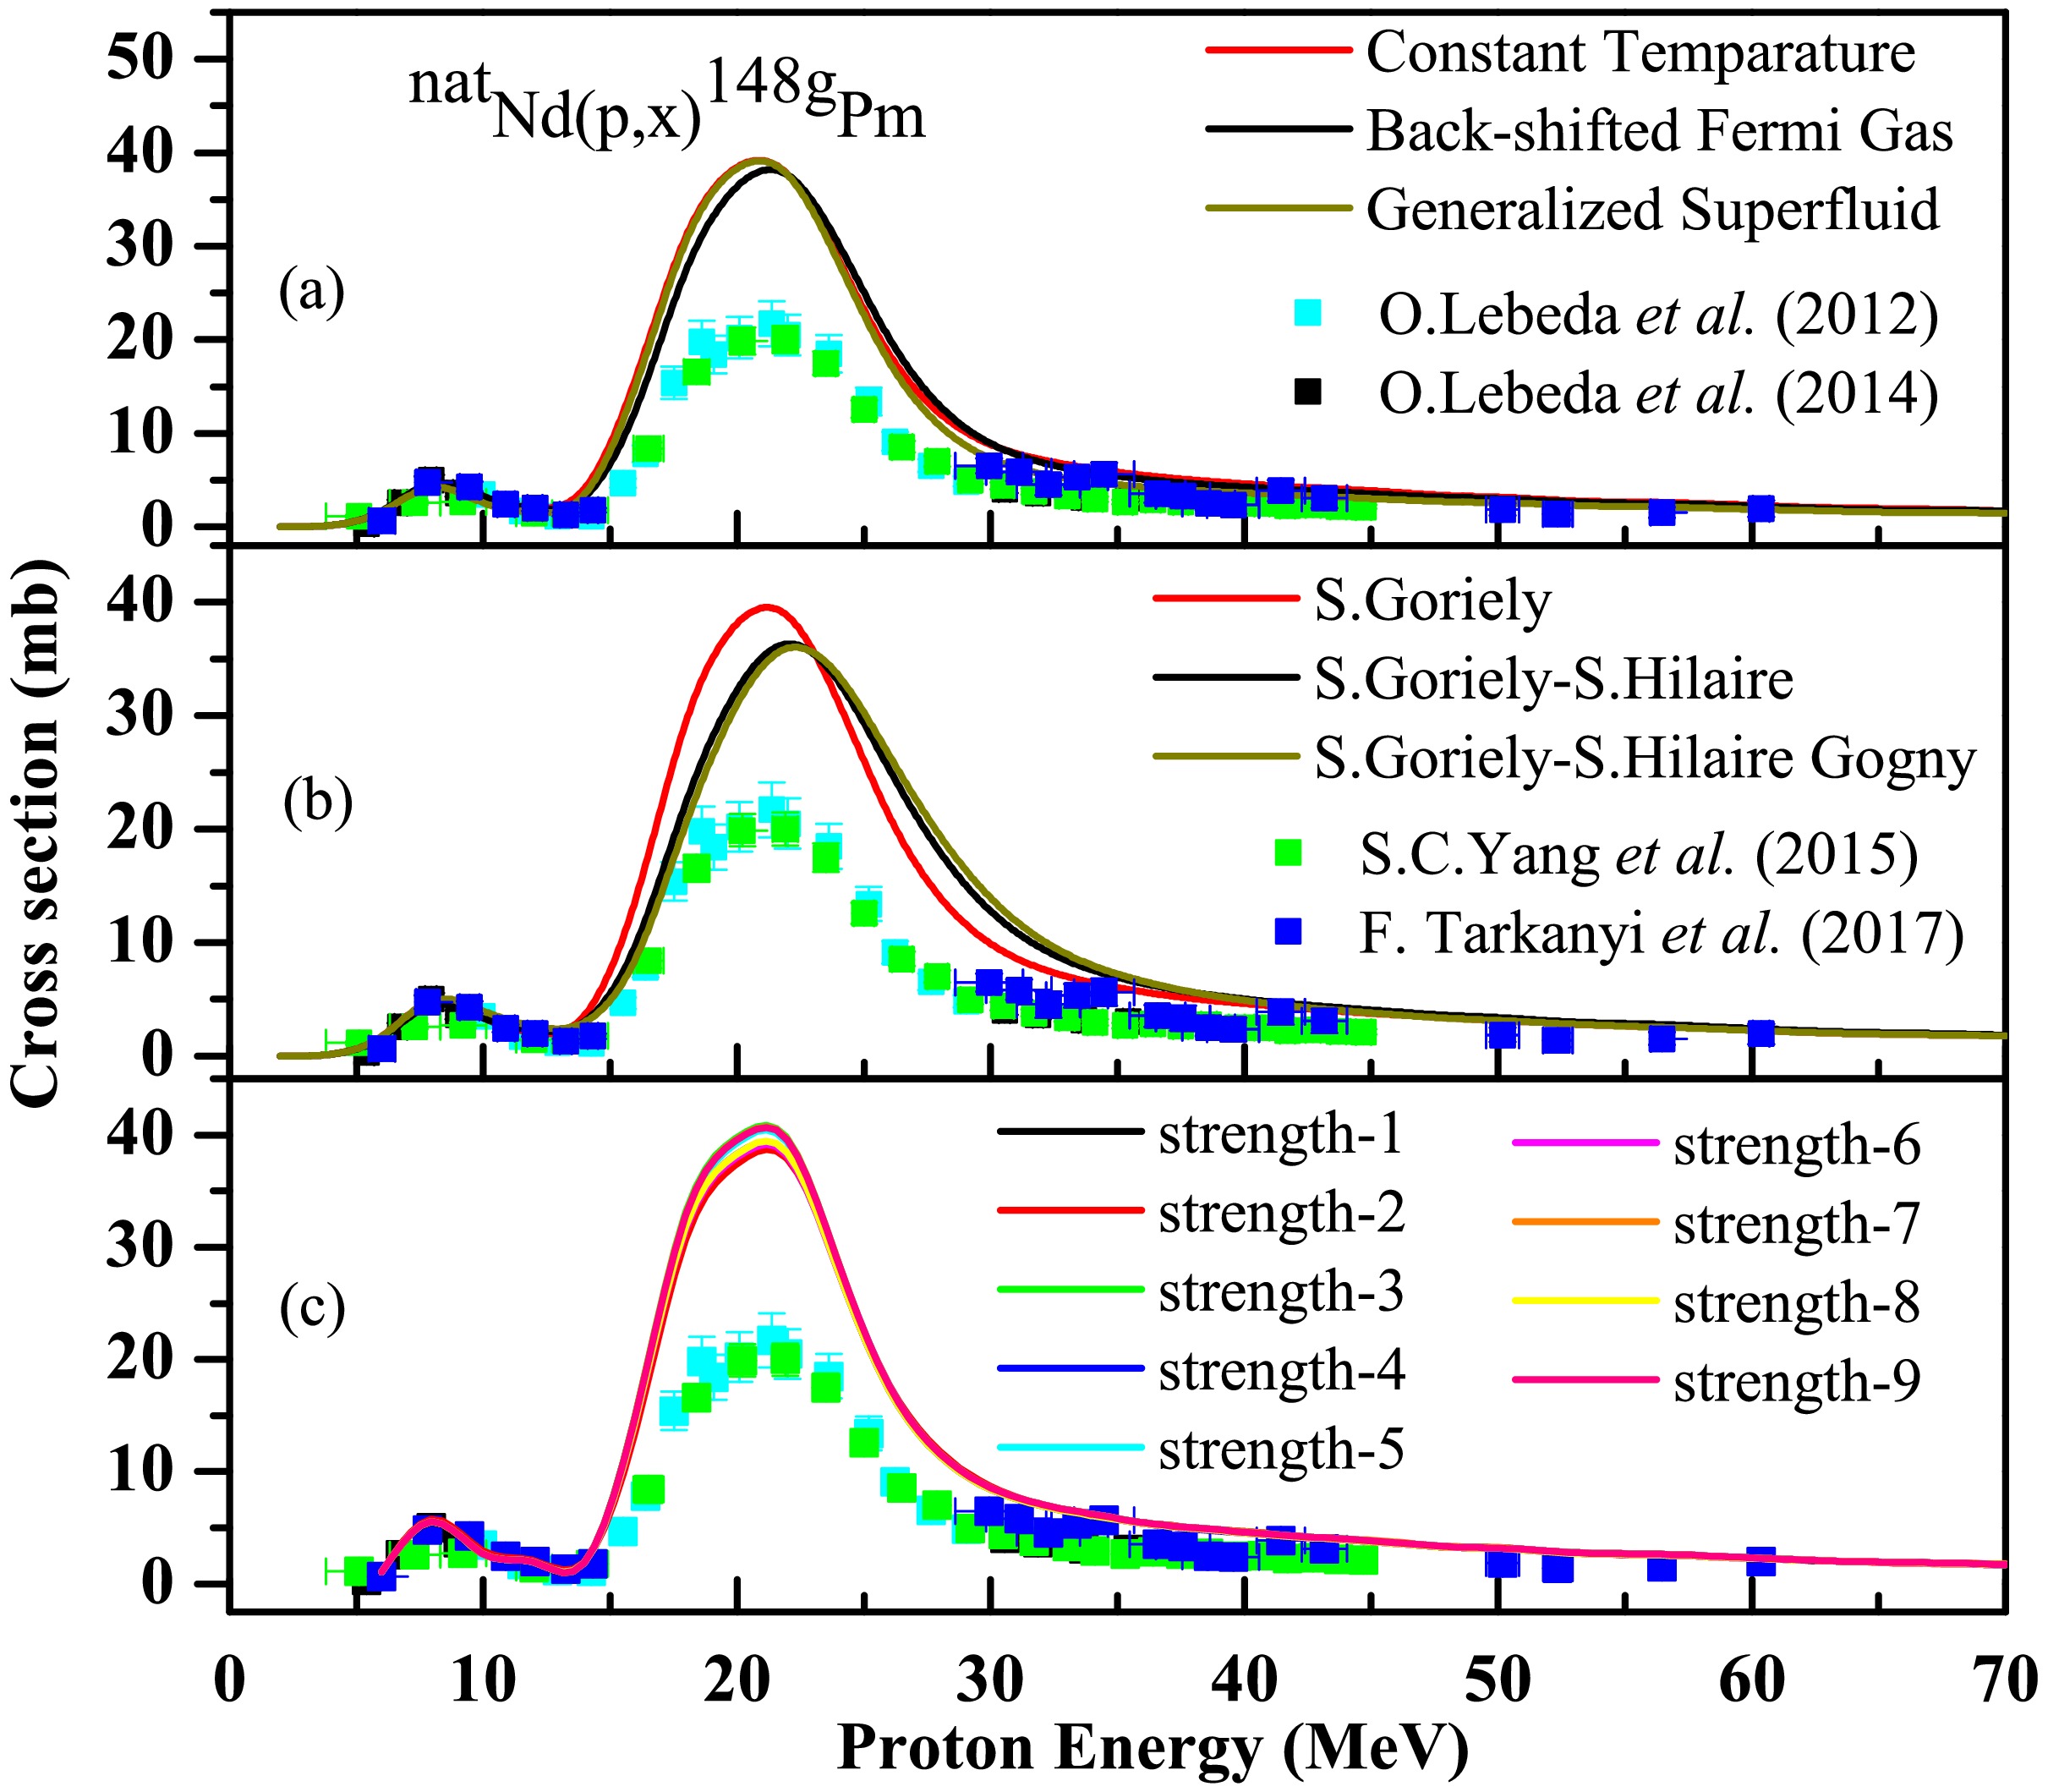
Figure 7.(color online) Experimental data for thenatNd(p,x)148gPm reaction reported by various groups taken from EXFOR [15] compared with the calculations using (a) phenomenological and (b) microscopic level density models and (c) different gamma strength functions (γSFs) based on the TALYS code. No significant improvement was observed from the use of differentγSFs when compared with the default run using different LDMs.
However, no significant improvement was observed in the CS values for thenatNd(p,x)148gPm reaction despite using different gamma strength functions (such as strength-1 to strength-9), as shown inFig. 7(c), compared to those of the default run using the six LDMs.
-
For thenatNd(p,x)146Pm reaction, as shown inFig. 8, the constant temperature and back-shifted Fermi gas models in the default mode predicted the CS values fairly well up to 40 MeV; however, beyond this value, the models underestimated the CS values. The generalized superfluid model also provided satisfactory result up to 35 MeV, after which mismatch between the experimental results and theoretical prediction was observed. Similarly, discrepancies were observed between the theoretical predictions made using the microscopic LDMs in the default mode and the experimental results beyond 40 MeV.
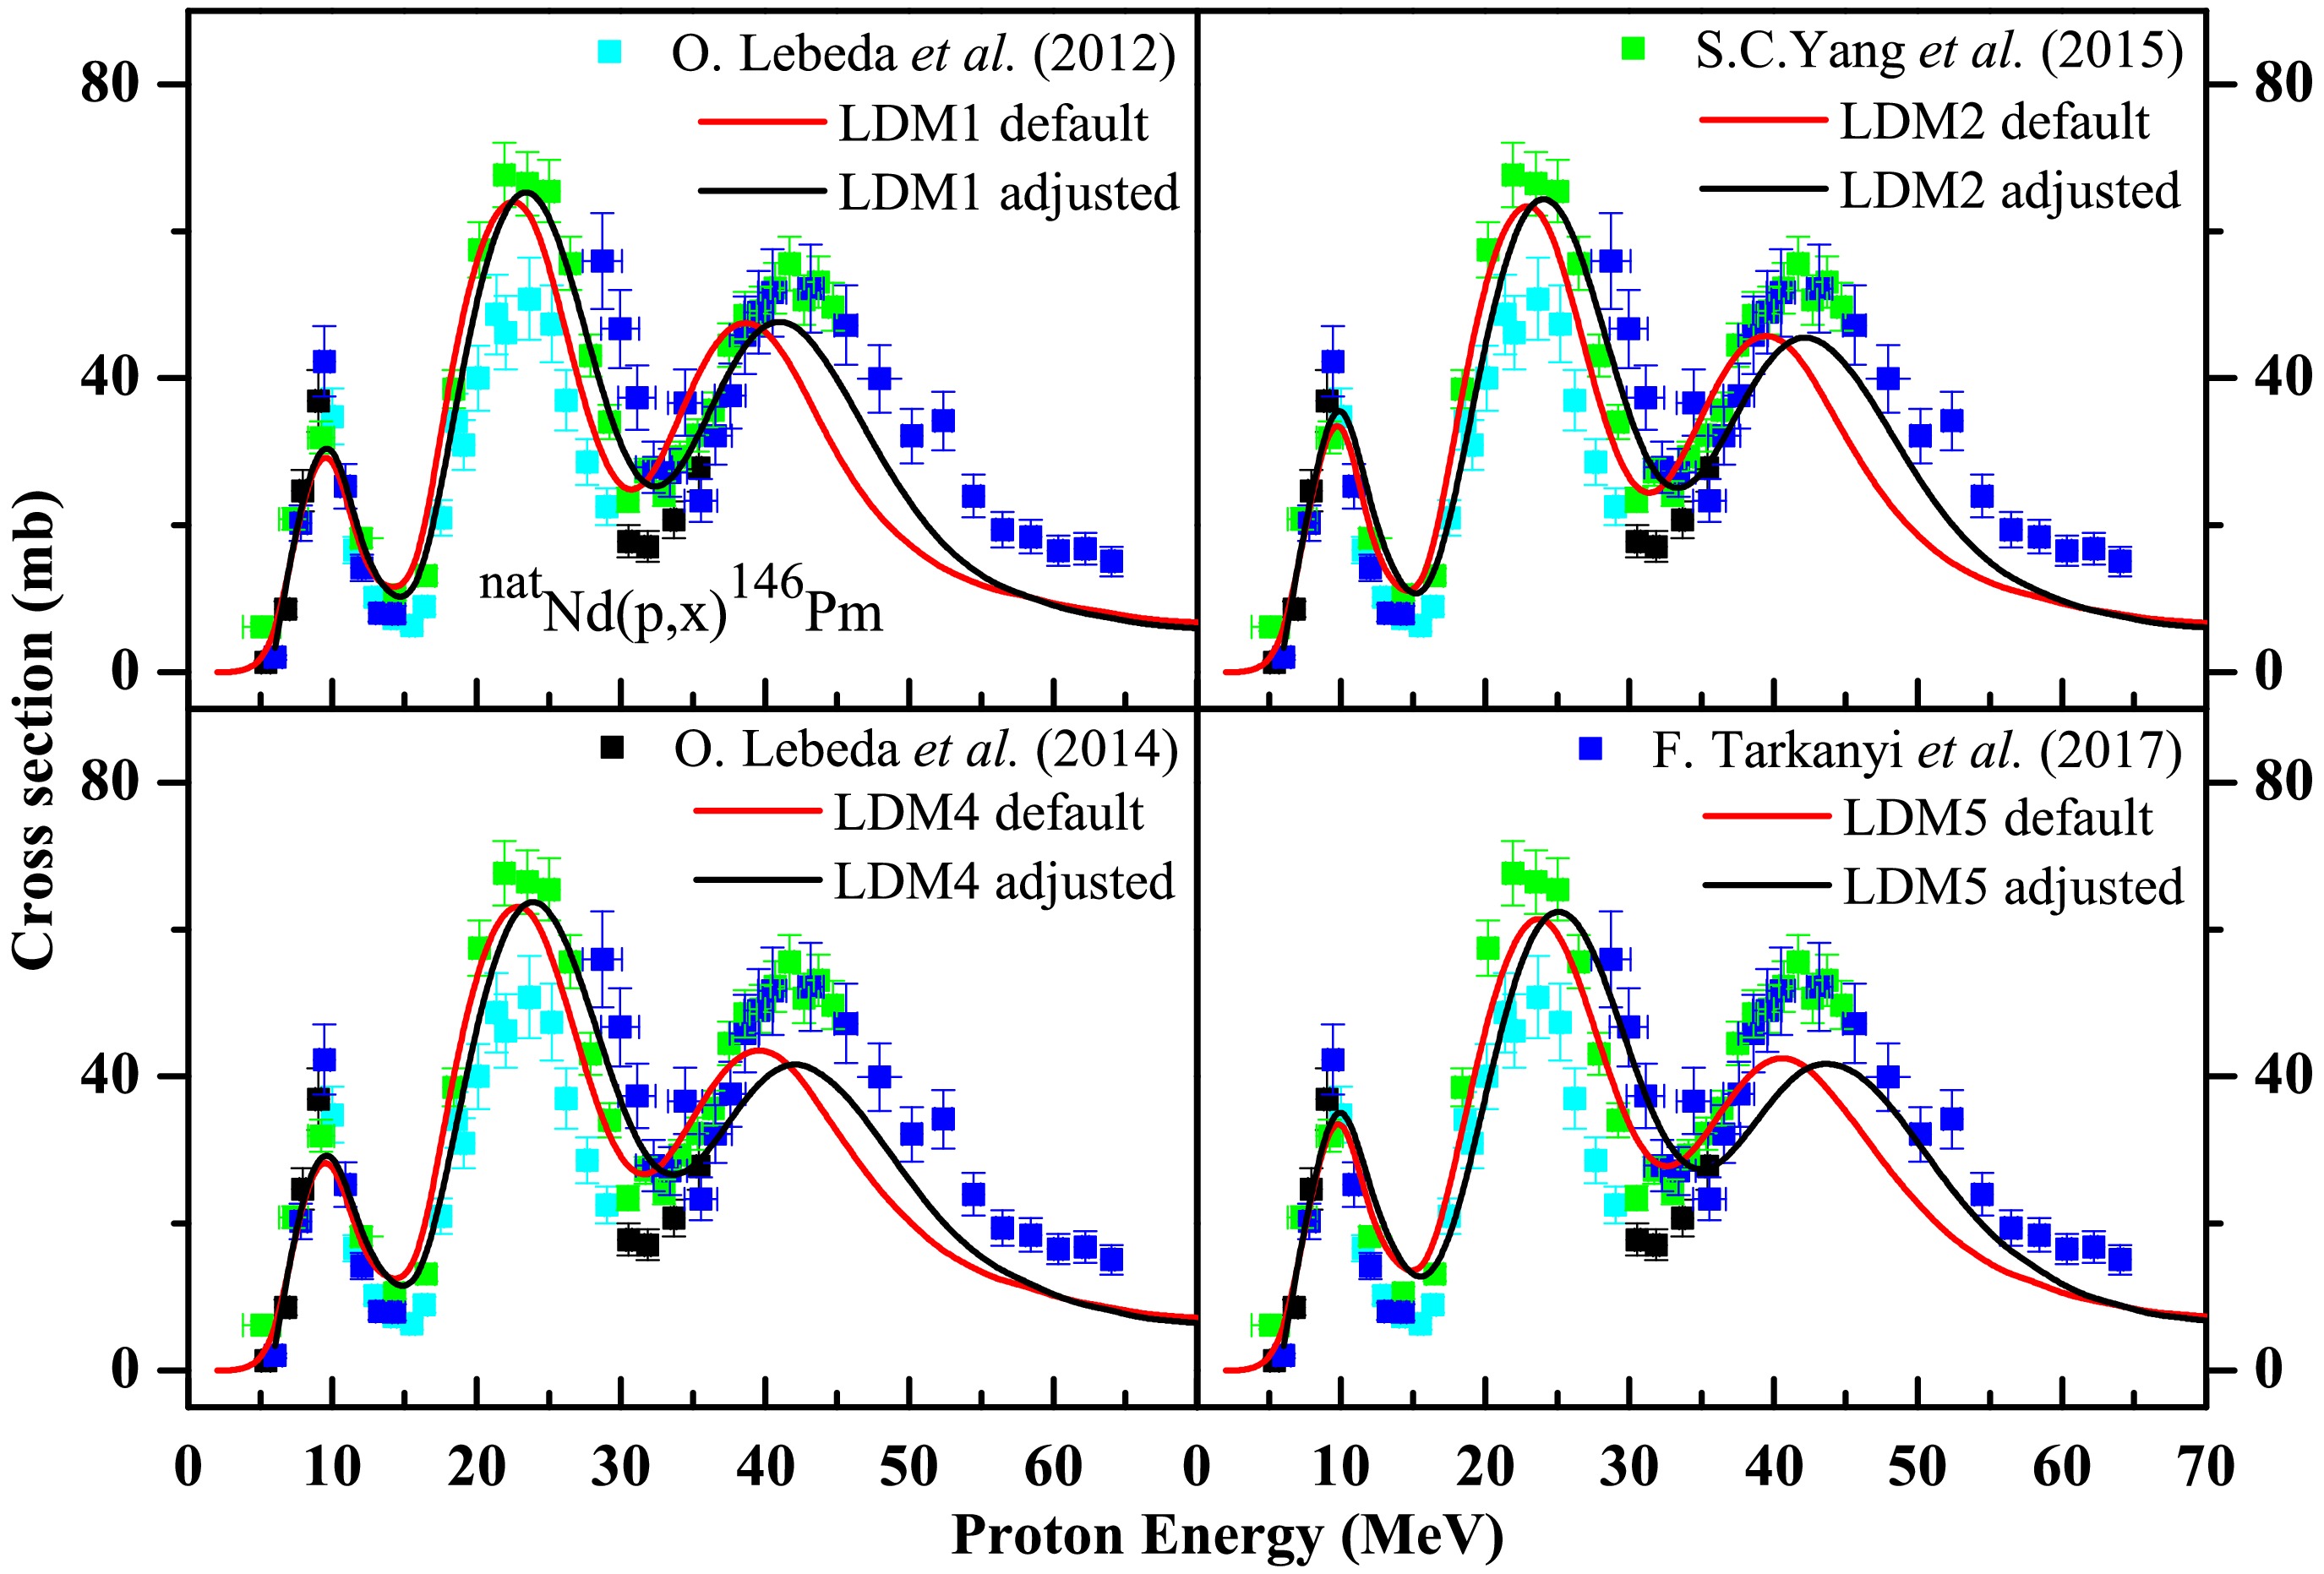
Figure 8.(color online) Experimentally measured data for thenatNd(p,x)146Pm reaction obtained from the literature compared with the phenomenological theoretical calculations based on TALYS code with different combinations of model parameters. The red and black continuous lines indicate the theoretically estimated CSs using TALYS in the default mode and using different combinations of model parameters, respectively. As no significant improvement in the response was observed in the case of LDM-3 and LDM-6 using different combinations of model parameters w.r.t. the TALYS run with NLDs in the default mode, these figures have not been included here.
However, for this reaction, the response of LDMs such as LDM-1, LDM-2, LDM-4, and LDM-5 improved significantly when the KU generalized Lorentzian strength function (i.e., strength 1) was used along with preeqmode 3 and the Bauge-Delaroche JLM potential. As no significant improvement was observed in the case of LDM-3 and LDM-6 after using different combinations of nuclear model parameters, the respective plots have not been included inFig. 8.
-
For thenatNd(p,x)144,143Pm reactions, the theoretically estimated CS values (as shown inFigs. 9and10, respectively) generated using the various LDMs (LDM-1 to LDM-6) in the default mode matched the experimental data reported by the various groups reasonably well.
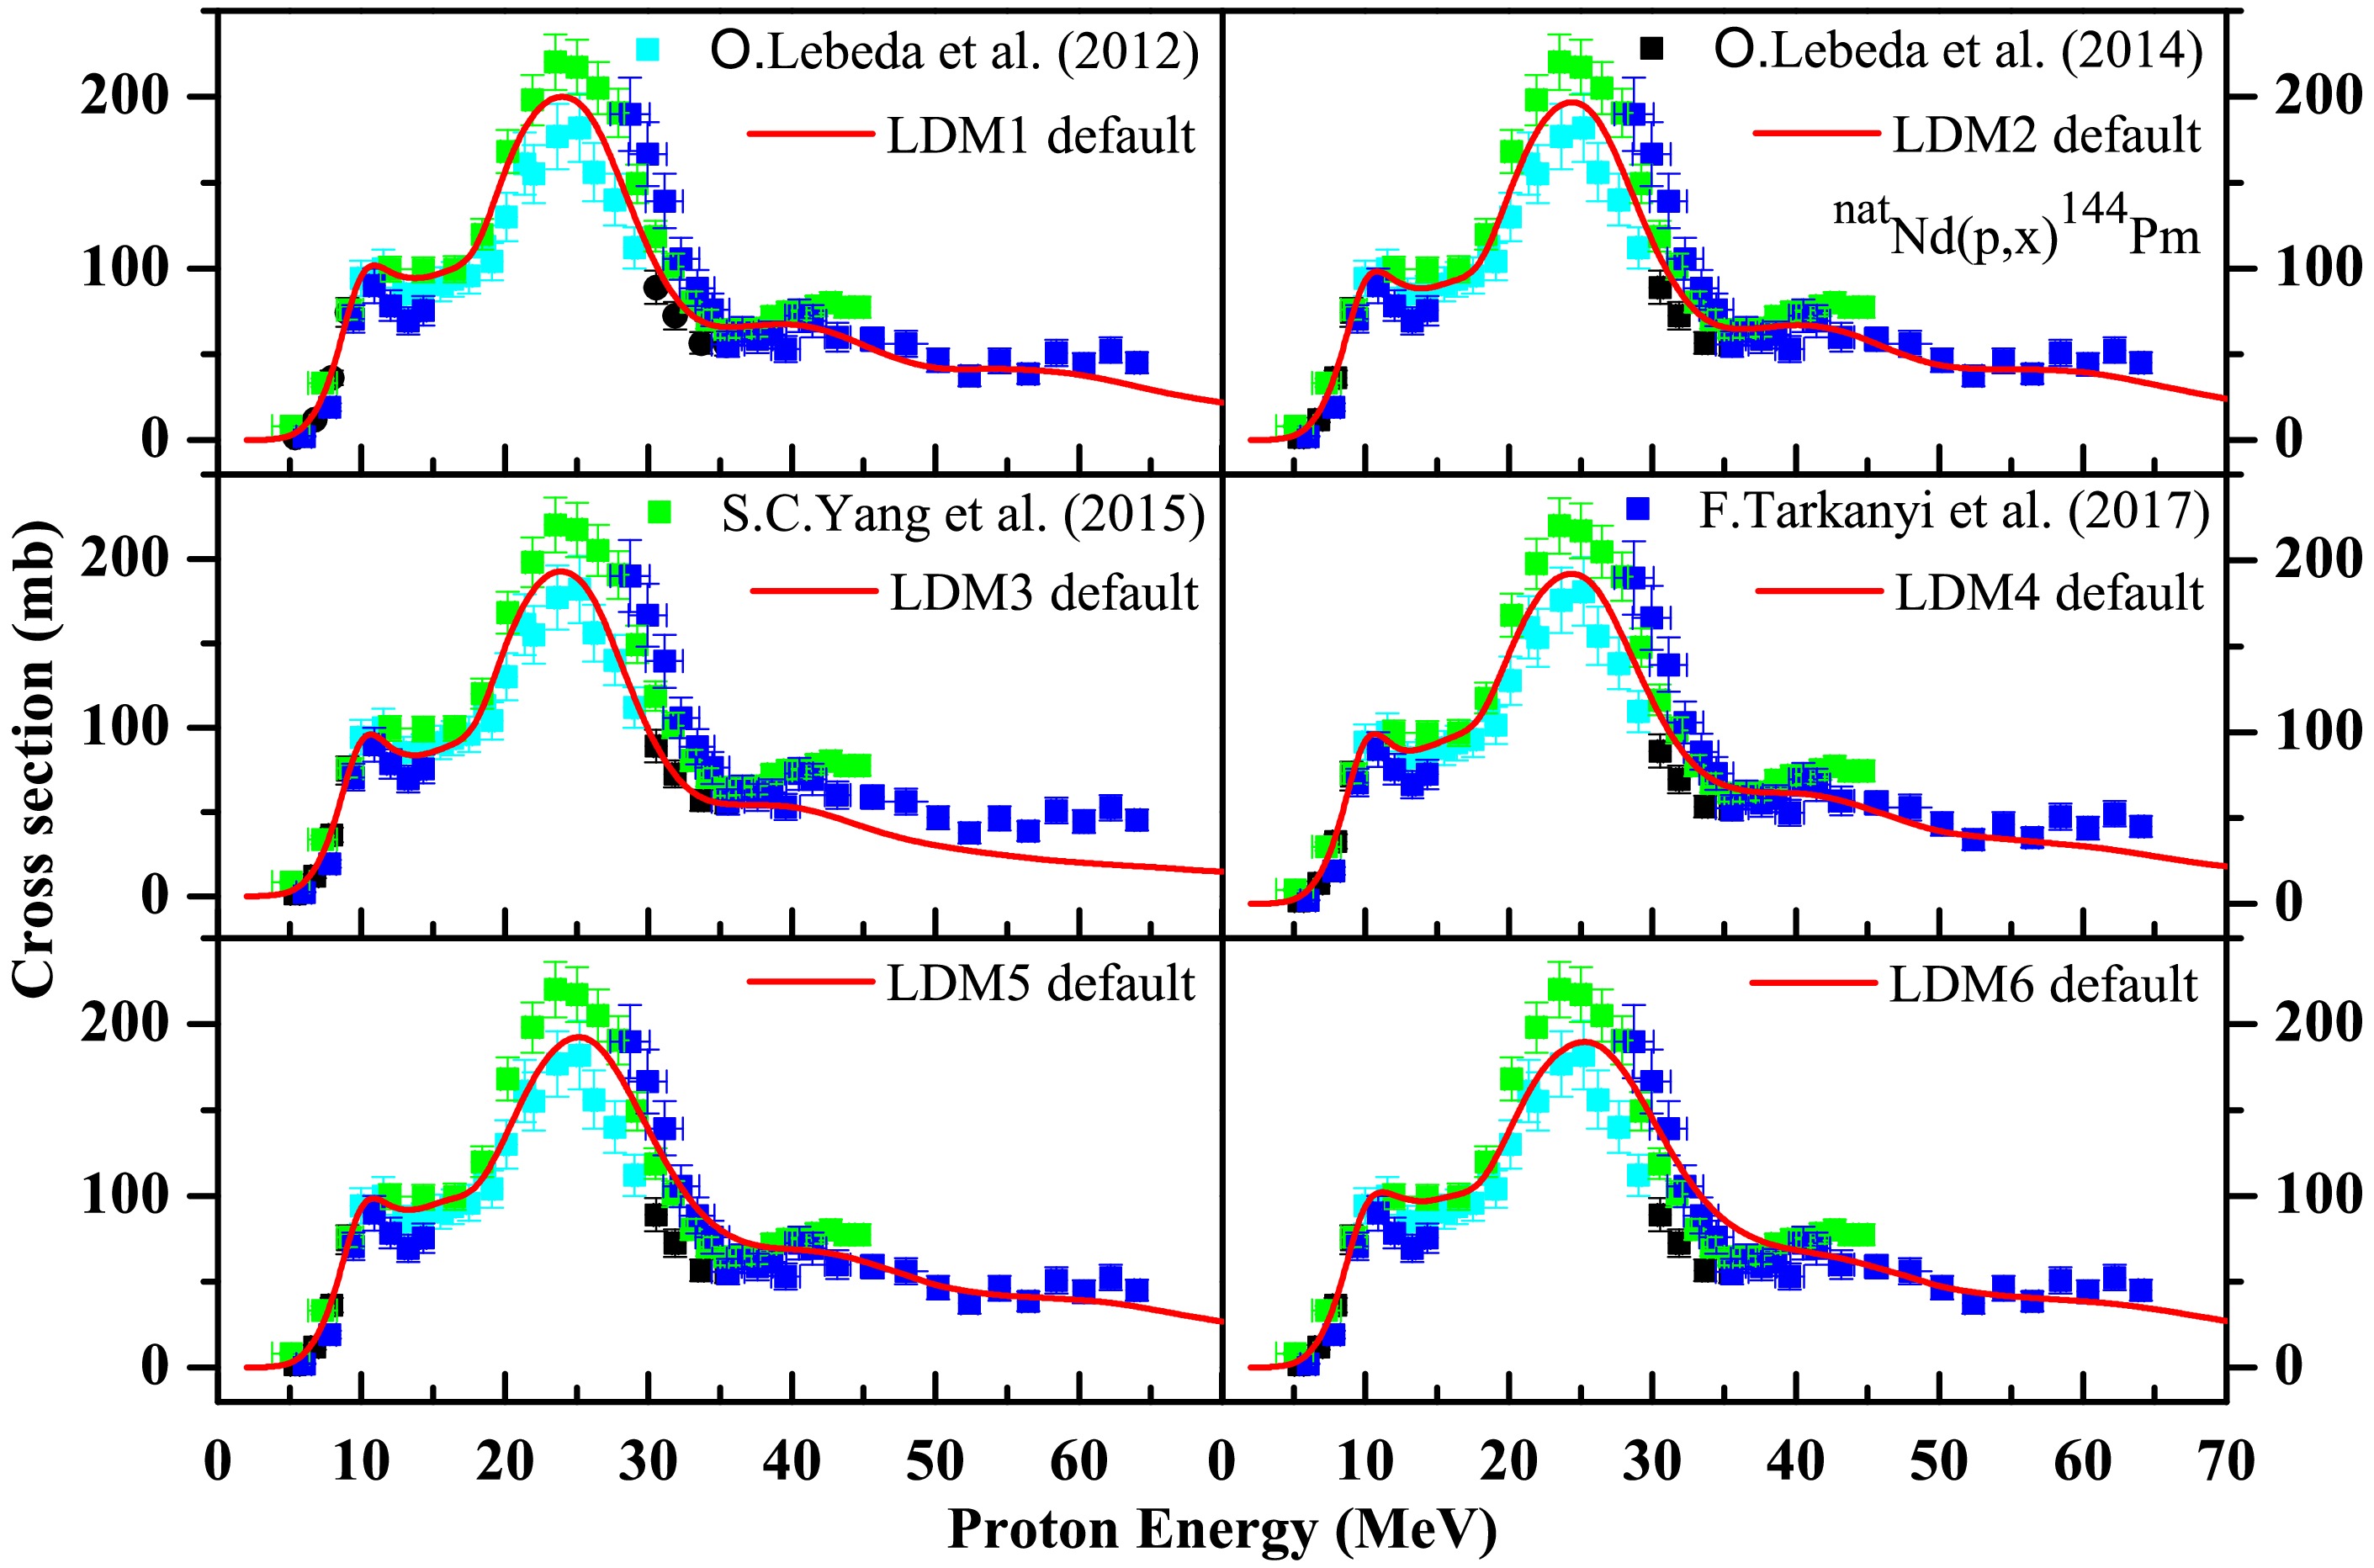
Figure 9.(color online) Experimental data for thenatNd(p,x)144Pm reaction reported by various groups taken from EXFOR [15] compared with the six level density model calculations (i.e., LDM-1 to LDM-6) based on TALYS code with the default option.
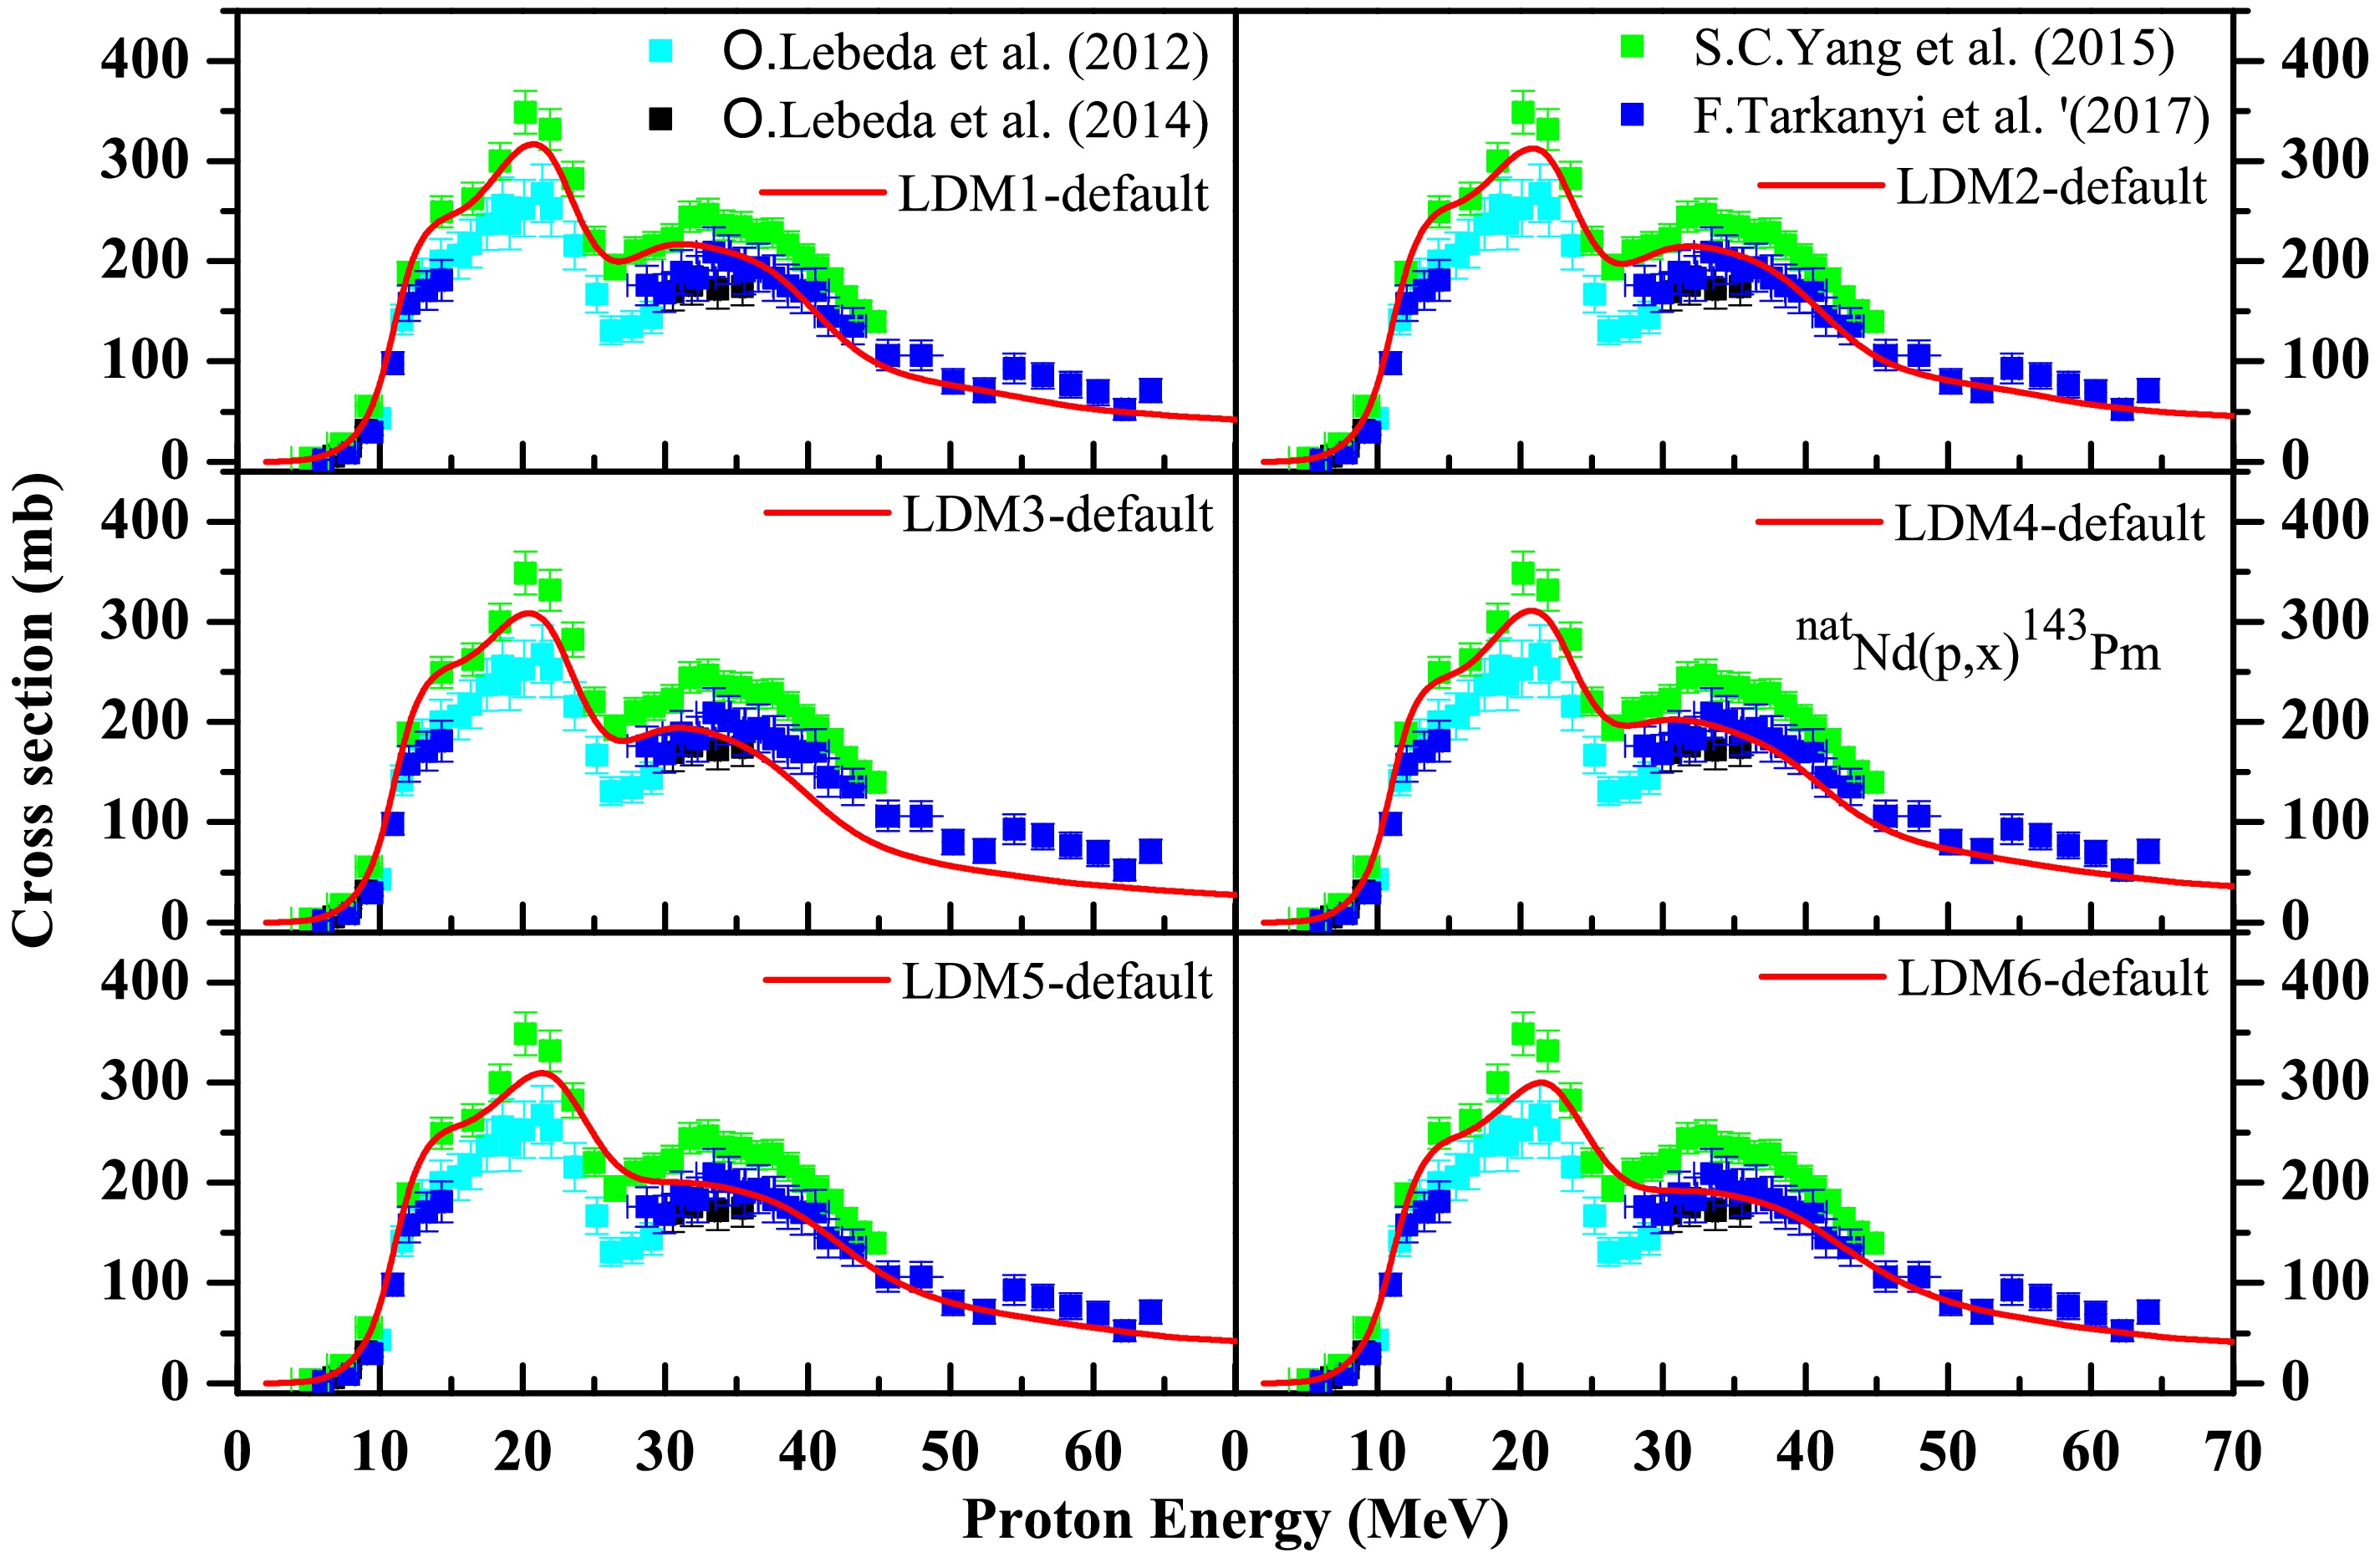
Figure 10.(color online) Experimental data for thenatNd(p,x)143Pm reaction reported by various groups taken from EXFOR [15] compared with the six level density model calculations based on TALYS code with the default option.
-
For thenatNd(p,x)141Pm reaction (Fig. 11), the phenomenological LDMs in the default mode predicted the CS values reasonably well in the 10–65 MeV range; however, in the 20–30 MeV range, these models overestimated the CS values. In the 35–65 MeV range, the microscopic LDMs (particularly LDM-5 and LDM-6) failed to suitably predict the CS values when used in the default mode.
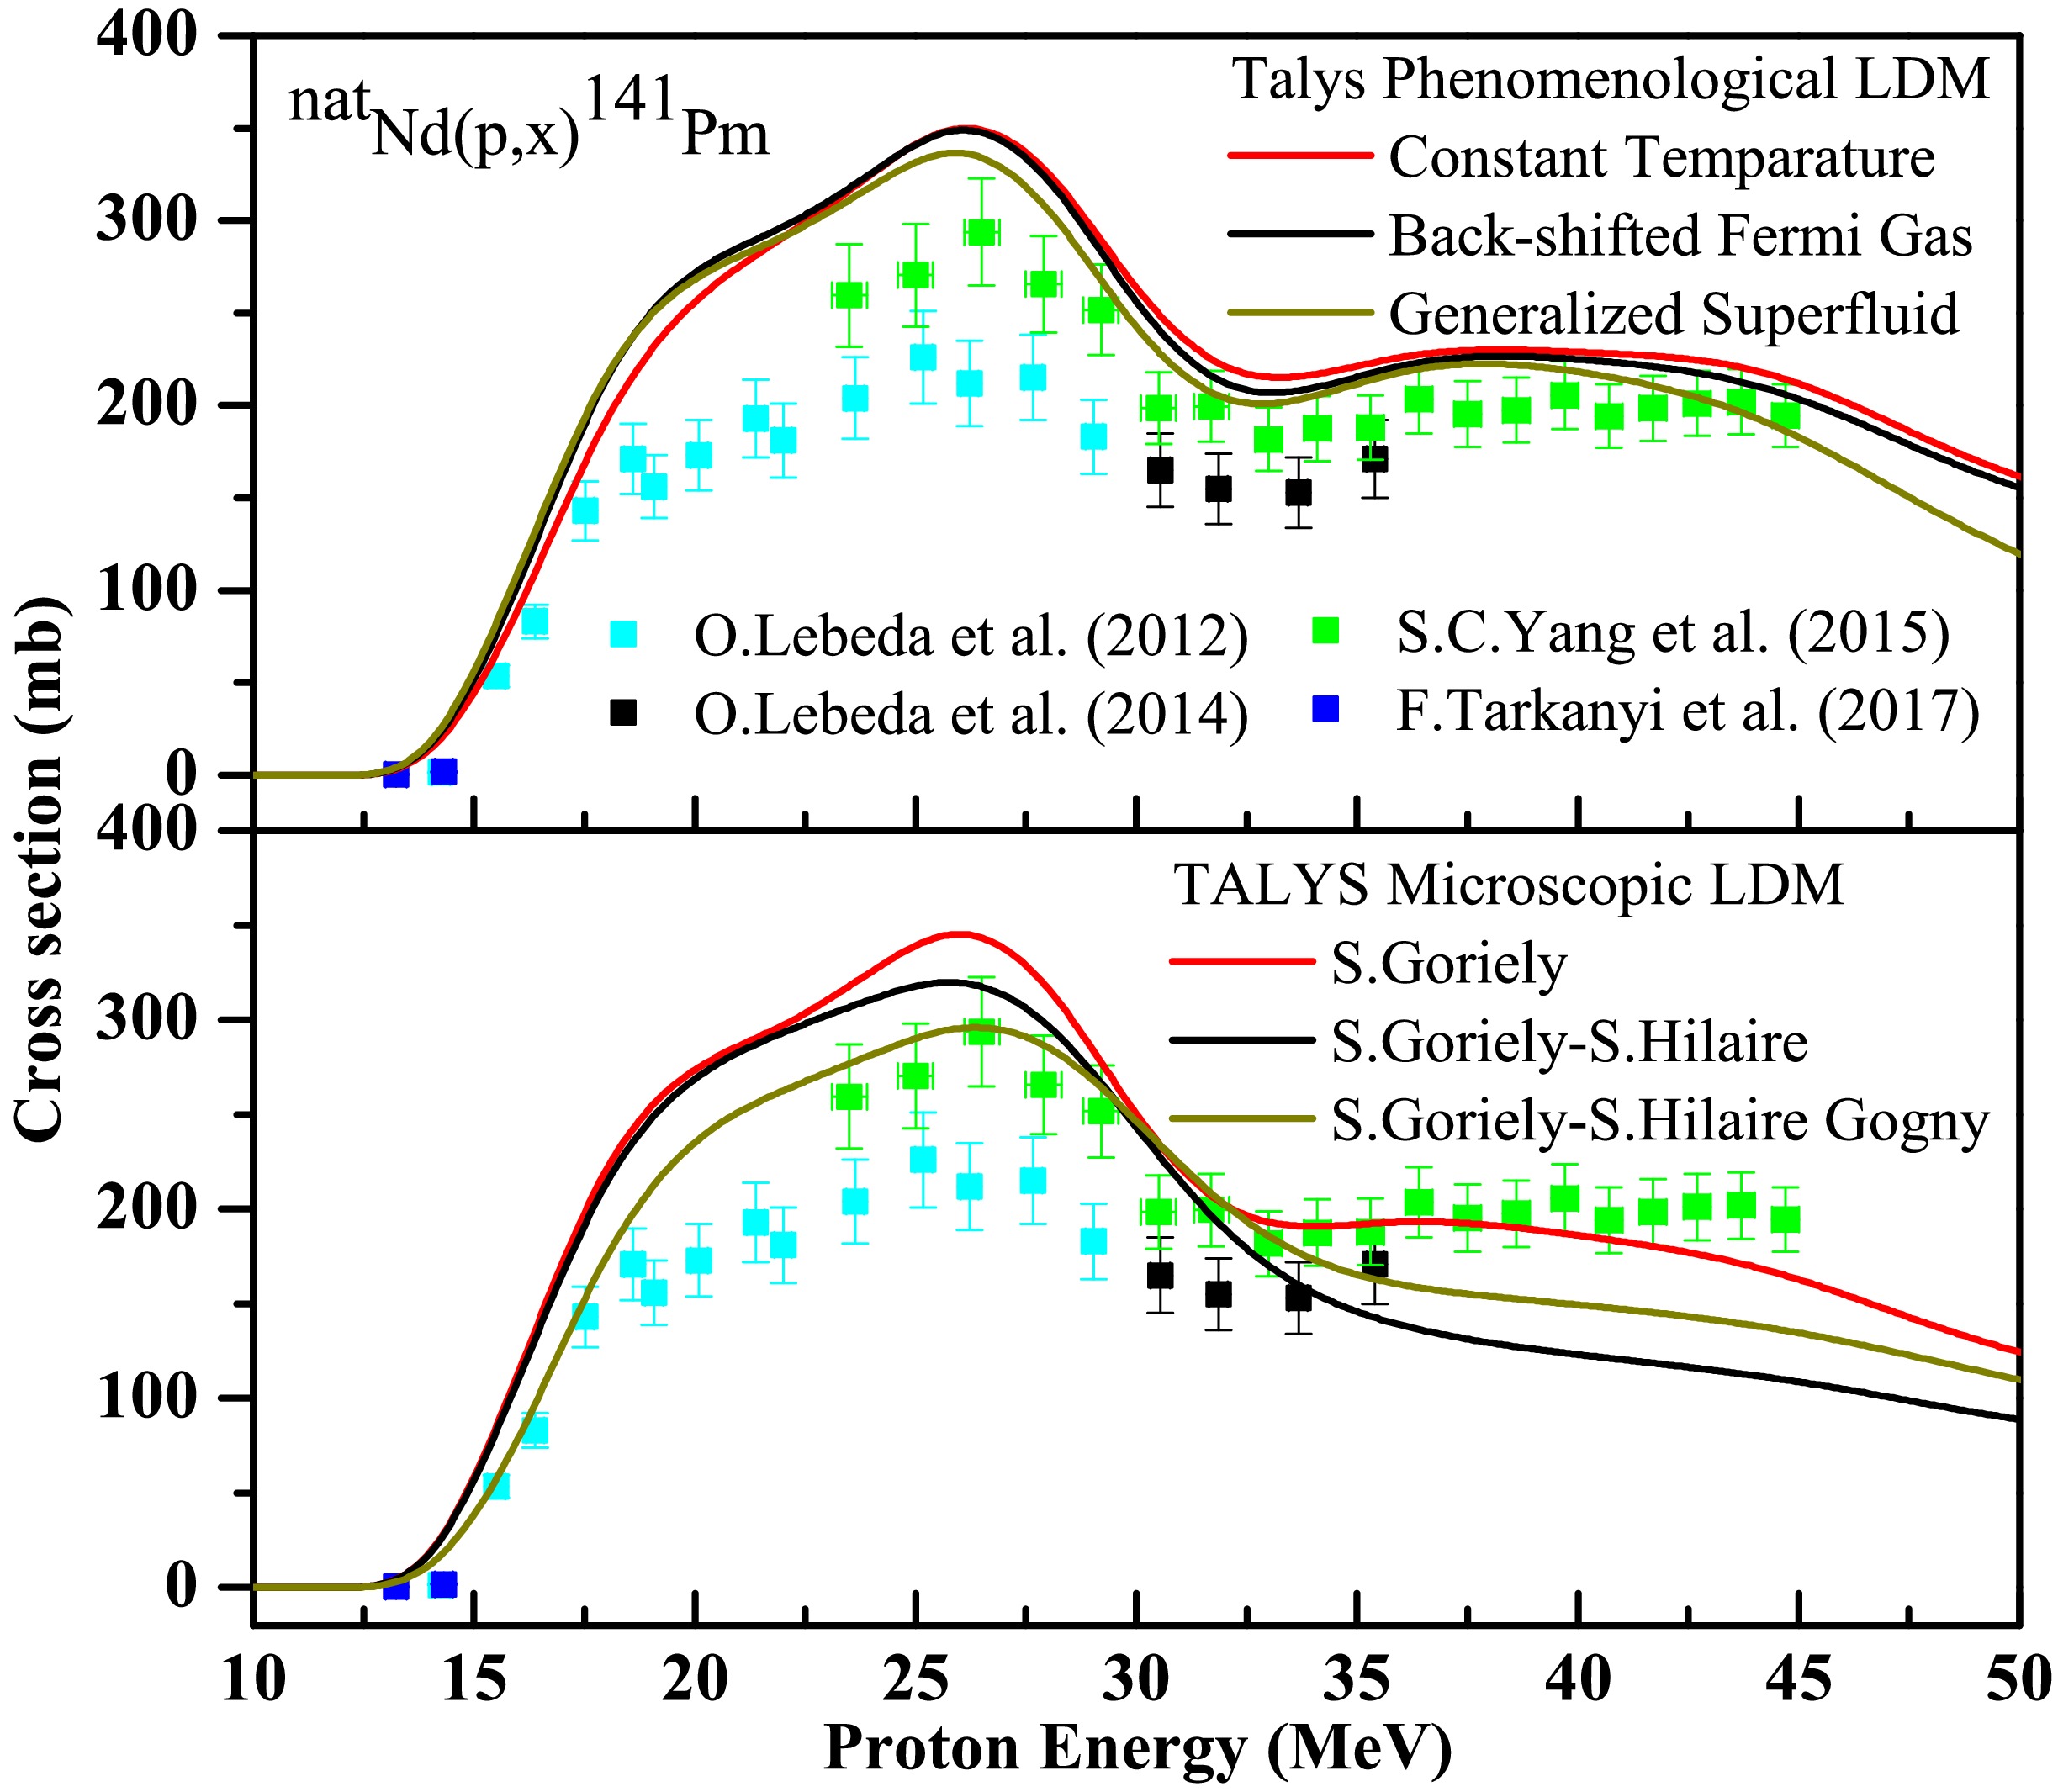
Figure 11.(color online) Experimental data for thenatNd(p,x)141Pm reaction taken from EXFOR [15] compared with the (a) phenomenological and (b) microscopic level density model calculations based on TALYS code with the default option.
No significant improvement was observed in the CS values by using different combinations of nuclear models and model parameters compared to those of the default run using the six LDMs.
-
In the case of thenatNd(p,x)147Nd reaction (Fig. 12), the constant temperature and back-shifted Fermi gas models predicted the CS values well up to a proton beam energy of 50 MeV, after which the CS values were slightly overestimated. The generalized superfluid model failed to suitably predict the CS values in the 30–65 MeV range when used in the default mode. Similarly, the CS values for thenatNd(p,x)147Nd reaction was over estimated by the microscopic LDMs (particularly LDM-5 and LDM-6) beyond 40 MeV.
However, the responses of the various LDMs ranging from LDM-1 to LDM-6 changed significantly for150Nd(p,x)147Nd reactions when the PE was changed from the default exciton model to preequimode 3.Fig. 12shows the effect of the change in the preequilibrium mode on the responses of different LDMs for the respective reaction channels.
-
In this study, as well as from the different combinations of nuclear models and/or model parameters, an alternate process was also adopted to fit the various experimental data using the OMP parameters available in the TALYS code. One motive behind this exercise was to verify the sensitivity of the theoretical CS calculation on the OMP parameters. To fit the150Nd(p,x)150Pm data using the TALYS code, the diffuseness parameter of the volume-central potential for the proton OMP (av) was reduced by 20% from its default value and the PE was changed from the default exciton to preeqmode 3, where the collision rates are based on the optical model. To fit the150Nd(p,x)149Pm data, the diffuseness parameter avwas reduced by 10% from its default value and the PE was changed from the default exciton to the multistep direct or compound model. Similarly, fornatNd(p,x)144,143Pm reactions, the theoretical results were fine tuned by reducing the radius parameter of the volume-central part of the proton OMP (i.e.,rv) value by 10% from its default value. Similarly, for thenatNd(p,x)141Pm data, the value ofrvwas decreased by 30% andavwas increased by 20%. For thenatNd(p,x)149,147Nd reactions, the values ofrvandavwere reduced by 10% and 20%, respectively, from their default values for the purpose of fine tuning. These systematic studies revealed that adjustment of the diffuseness and radius parameters, often coupled with changes in the preequilibrium mode (from the default exciton mode), leads to excellent agreement between the theoretical predictions made by TALYS and the experimental data taken from the literature, in most of the aforementioned reaction channels.Fig. 13shows the effect of the above alterations in the OMP parameters (avand/orrv) and the preequilibrium mode wherever needed.
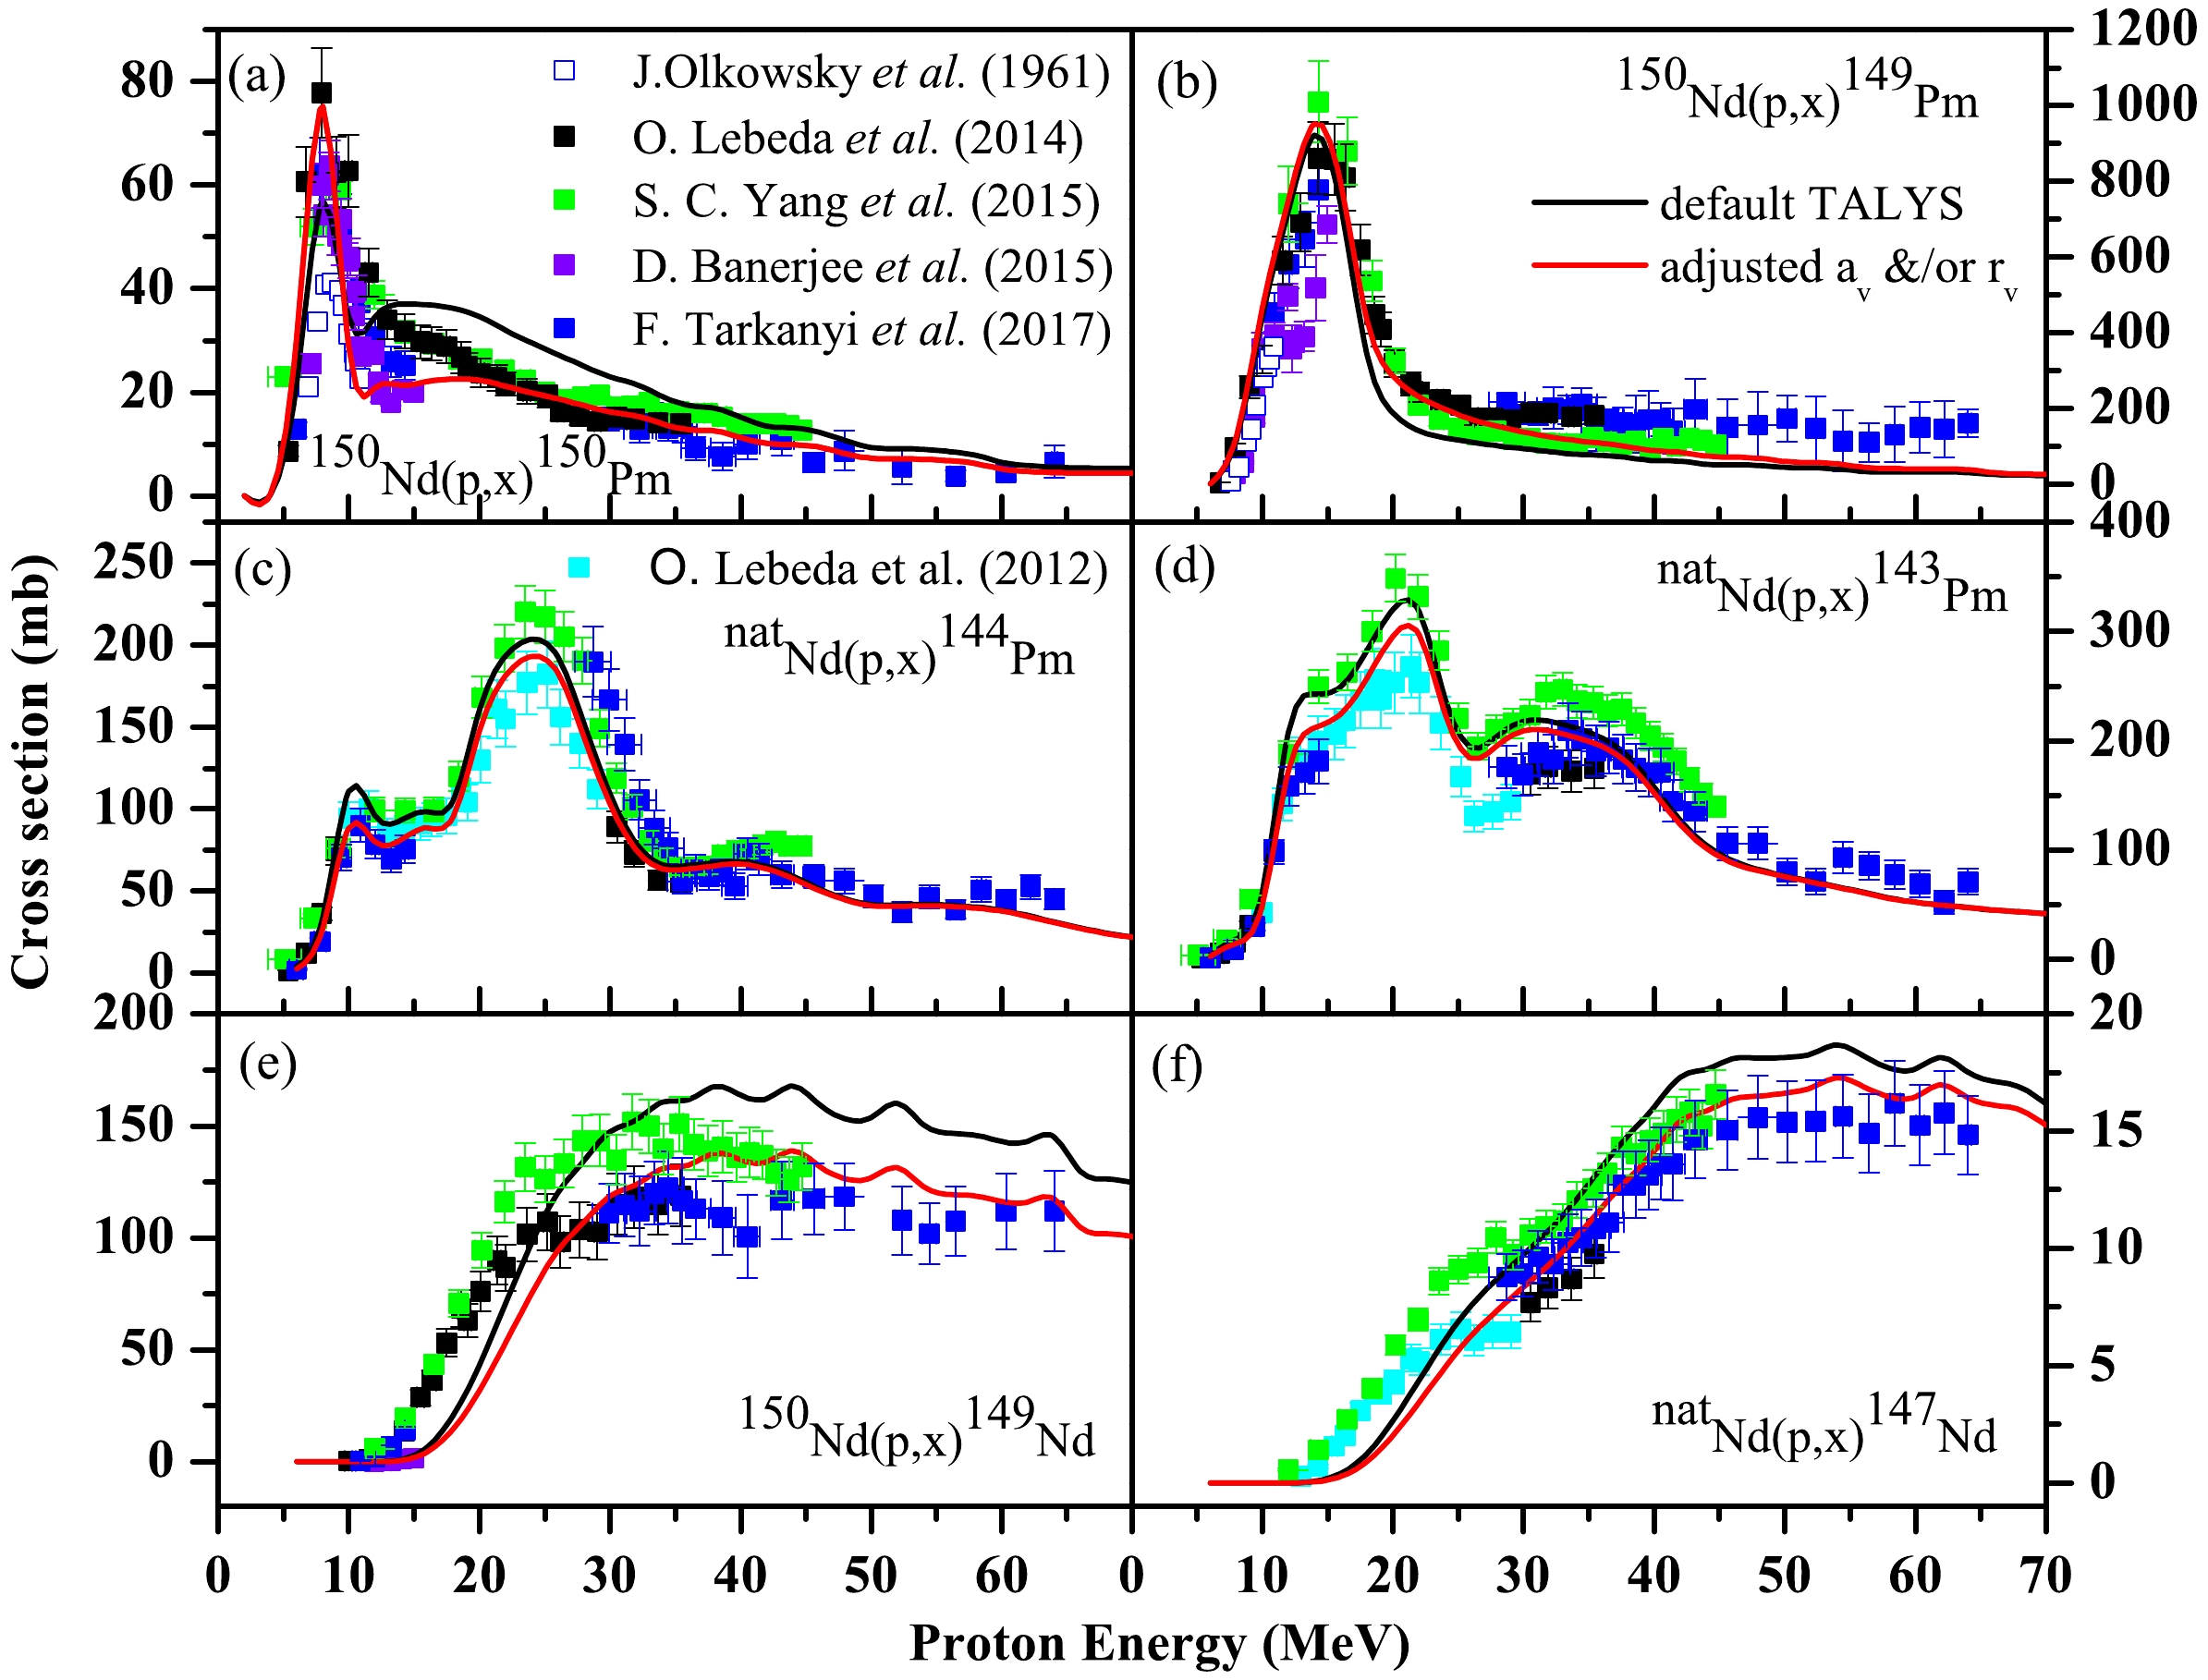
Figure 13.(color online) Experimentally measured CS data for thenatNd(p,x)150,149,144,143Pm,149,147Nd reactions obtained from the literature compared with the default theoretical calculations based on TALYS code and with the adjusted diffuseness and/or radius global parameters of the volume-central part of the proton OMP. The black and red continuous lines indicate the theoretically estimated CSs using TALYS with the default mode and with adjusted OMP parameters, respectively.
-
In summary, the CSs of the150Nd(p,x)150,149Pm,149Nd,natNd(p,x)148,146,144,143,141Pm, and147Nd reactions were theoretically calculated via the TALYS-1.96 code using both the default mode and a combination of different nuclear reaction models and model parameters available in TALYS. The CSs estimated theoretically using the TALYS code with six LDMs in the default mode were compared with the experimental CSs available in the literature reported by various experimental groups. Several discrepancies between theoretical estimates and experimental results were obtained when TALYS was run in its default mode. However, the various theoretically estimated CSs were found to be in good agreement with the experimentally observed data when certain specific nuclear parameters and models were used in combination. The impact of the various PEs andγSF on the CS calculation was also revealed in this study. Moreover, the sensitivity of the theoretically calculated CSs w.r.t the diffuseness and radius parameters of the volume-central part of the proton OMP was investigated. As shown, variation of the above OMP parameters can lead to satisfactory fine tuning of the calculated CSs for most of the reaction channels opened via proton induced reactions on an Nd target.
The theoretically estimated CSs for long-lived radioisotopes such as143Pm,144Pm,146Pm,148Pm, and147Nd produced via proton induced reactions onnatNd are important for the estimation of their production rates, which are used to define the maximum allowed time for neodymium exposure on Earth's surface and the necessary cooling times before deploying the isotope in the SNO+β-decay experiment.
As the energy values of the incident proton in this study extended up to 65 MeV, it is important to note that the contribution of the preequilibrium mechanism to the total reaction cross section attained significance at energies above 10 MeV.
-
The author would like to thank ICFAI University Tripura for all their help and support in carrying out the research. The author would also like to acknowledge the helpful discussions with Dr. Bibhabasu De and Mr. Songshaptak De.
Systematic study of cross section for proton-induced reactions on neodymium up to 65 MeV using TALYS-1.96 code
- Received Date:2024-06-18
- Available Online:2025-01-15
Abstract:A systematic study was conducted on the theoretical estimation of the nuclear cross sections of charged particle induced reactions on rare earth nuclei. The production cross sections of the150,149,148,146,144,143,141Pm and149,147Nd nuclei were calculated theoretically via proton induced reactions on neodymium using TALYS (version 1.96) code in the default mode, with different combinations of nuclear models as well as adjusted nuclear model parameters from the reaction threshold up to a proton energy of 65 MeV. The theoretically computed results were compared with the experimental results taken from the EXFOR database and literature reported by various research groups. Moreover, the effects of various level density models, preequilibrium models, optical model potentials, and gamma strength functions on the cross section calculation were considered. This theoretical analysis will help elucidate the theory of nuclear reaction models and improve the evaluated nuclear data libraries.


 DownLoad: