


 Abstract
 HTML
HTML Reference
 Related
 PDF
PDF


-
Theoretical modeling of nucleus-nucleus collisions is useful because it reduces experimental labor and expenses. Moreover, this modeling enables us to understand the mechanism of nucleus-nucleus interactions. To model the fusion process of two nuclei, the time-dependent Hartree–Fock approach [1−4] is often considered one of the most advanced methods. However, there are two shortcomings of this approach: (i) it is highly computer-time consuming, and (ii) it is difficult to account for fluctuations of the nucleus shape. Therefore, in literature, simplified dynamical approaches are widely used, such as the quantum diffusion approach [5−8], coupled-channels method [9−12], and trajectory model with surface friction [13−16].
In all these simplified approaches, a crucial role is played by the nucleus-nucleus effective interaction potential, consisting of the Coulomb
$ {U}_{\rm C} $ , nuclear$ {U}_{n} $ , and centrifugal${U}_{\rm rot}$ terms. The nuclear term of this potential is the least defined quantity. In many studies, this term is calculated using the semi-microscopical double folding model with frozen densities [5,8,17−22]. The simplest formula for this model reads as$ {U}_{n}\left(R\right)=\int {\rm d}{\overrightarrow{r}}_{1}\int {\rm d}{\overrightarrow{r}}_{2}{\rho }_{A1}\left({r}_{1}\right){\mathrm{v}}_{NN}\left(\left|{\overrightarrow{R}-\overrightarrow{r}}_{2}+{\overrightarrow{r}}_{1}\right|\right){\rho }_{A2}\left({r}_{2}\right) . $

(1) Here,
$ {\rho }_{A1} $ ($ {\rho }_{A2}) $ is the point nucleon projectile (target) density,$ {v}_{NN} $ is the effective nucleon-nucleon interaction,$ \overrightarrow{R} $ corresponds to the projectile-target center-to-center distance, and$ {\overrightarrow{r}}_{1} $ and$ {\overrightarrow{r}}_{2} $ are the radius-vectors of the interacting points of the projectile and target nuclei, respectively. Note that in the present study, we consider the collisions of two spherical nuclei; the nucleon density (ND) is the sum of the proton and neutron densities,$ {\rho }_{Ai}={\rho }_{Zi}+{\rho }_{Ni} $ ($ i=\mathrm{1,2} $ ). To evaluate the Coulomb nucleus-nucleus interaction energy${U}_{\rm C}\left(R\right)$ , one can use Eq. (1) by appropriately changing the densities and nucleon-nucleon interaction.The NDs
$ {\rho }_{A1\left(2\right)} $ arrive at Eq. (1) from different sources that are external with respect to the double folding approach. The problem, however, is that the NDs are not the observable quantities. Although experimental information on the neutron density was recently obtained [23,24], the usual way to experimentally explore the interior of the nucleus is to irradiate it with electrons; thus, the measured quantity is the nuclear charge density (NCD) [25−27]. For the collision of spherical nuclei, the NCD is not considered to be of crucial importance when calculating the Coulomb term of the nucleus-nucleus potential [18]. However, for consistency, the theoretical NDs used in Eq. (1) must provide NCDs in agreement with the experimental NCDs, as it is in nature.The idea behind the present study is to make use of experimental NCDs to obtain correct NDs, which are then implemented in the double folding potential. Three spherical even-even nuclei with
$ N=Z $ are employed:12C,16O, and40Ca. Although there is some experimental information on the deformed shape of12C (see, for example, [28,29] and references therein), this nucleus is considered a spherical one in many studies [14,20,21,30,31]. Moreover, it is well established that at above barrier collision energies, structure effects, such as nuclear deformation, do not significantly manifest themselves [32]. Therefore, we believe it is a reasonable approximation to consider12C a spherical nucleus in our calculations.In the collision of light heavy ions, the capture of reagents into the orbital motion results in their fusion into a compound nucleus. This is why we use the term “fusion” even though we only calculate capture cross sections. Following [21], we assume that
$ {\rho }_{Z}={\rho }_{N} $ for these nuclei and propose a novel approach for ND parameterization. These densities are used to evaluate the above-barrier capture cross-sections of the12C+12C,16O,16O+16O,40Ca, and40Ca+40Ca reactions.The paper is organized as follows. In Sec. II, we discuss the relationship between the NCD and ND as well as the different versions of NDs available in literature. In Sec. III, a novel parameterization for NDs is described, and the calculated NCDs are compared with the experimental values. The models used to calculate the fusion cross sections are considered in Sec. IV. Theoretical fusion cross-sections are compared with the experimental values in Sec. V. Finally, Sec. VI presents the conclusions.
-
The experimental NCDs are approximated using the sum of Gaussians (SOG) analysis [26]:
$\begin{aligned}[b] {\rho }_{q{\rm exp}}\left(r\right)=&\sum _{i}^{}{A}_{i}\Bigg\{\mathrm{e}\mathrm{x}\mathrm{p}\left[-{\left(\frac{r-{R}_{i}}{\gamma }\right)}^{2}\right]\\&+\mathrm{e}\mathrm{x}\mathrm{p}\left[-{\left(\frac{r+{R}_{i}}{\gamma }\right)}^{2}\right]\Bigg\}\end{aligned}$

(2) with
$ {A}_{i}=\frac{Z{Q}_{i}}{2{\pi }^{3/2}{\gamma }^{3}\left(1+2{R}_{i}^{2}/{\gamma }^{2}\right)}, $

(3) where
$ \sum _{i}^{}{Q}_{i}=1. $

(4) The coefficients
$ {Q}_{i} $ , and the positions$ {R}_{i} $ and width$ \gamma $ of the Gaussians are tabulated in [26].Provided the proton density
$ {\rho }_{Z} $ is known, the NCD in a spherical nucleus,$ {\rho }_{q}\left(r\right) $ , as a function of the distance from its center,$ r $ , can be calculated using the convolution method [33],$ {\rho }_{q}\left(r\right)=\int {\rm d}\,{\overrightarrow{r}}_{p}{\rho }_{Z}\left({r}_{p}\right){f}_{p}\left(\left|\overrightarrow{r}-{\overrightarrow{r}}_{p}\right|\right) . $

(5) Here,
$ {\overrightarrow{r}}_{p} $ denotes the radius-vector of the proton center of mass, and$ {f}_{p} $ is the charge distribution inside proton.For this distribution as a function of
$ l=\left|\overrightarrow{r}-{\overrightarrow{r}}_{p}\right| $ , we use the exponential distribution [34]$ {f}_{pe}\left(l\right)=\frac{3 \sqrt{(3)}}{{\pi R}_{pe}^{3}}\mathrm{e}\mathrm{x}\mathrm{p}\left(-\frac{2\sqrt{3}l}{{R}_{qp}}\right) $

(6) where
$ {R}_{qp} $ is the experimental value of the root mean square proton charge radius${R}_{qp}=0.8783~\mathrm{f}\mathrm{m}$ [27]. Although this value has been found to be 4% smaller in recent experiments [35,36], in this study, we use the value from [27].In literature, we can find several options for the NDs. In [37], theoretical densities calculated within the Hartree-Fock-Bogolubov approach are approximated using 2pFprofiles with different radius and diffuseness parameters for protons (Z) and neutrons (N)
$ {\rho }_{i2pF}\left(r\right)=\frac{{\rho }_{i2pFC}}{1+\mathrm{e}\mathrm{x}\mathrm{p}\left[\dfrac{r-{R}_{0i2pF}}{{a}_{i2pF}}\right]}. $

(7) Here,
$ i=Z,N $ ,$ {R}_{0i2pF} $ and$ {a}_{i2pF} $ are the half-central density radius and diffuseness parameters, respectively, and$ {\rho }_{i2pFC} $ originates from the normalization condition. However, for12C, this type of density profile is absent in [37].For12C and16O, the following Gaussian-like densities can be found in [21]:
$\begin{aligned}[b] {\rho }_{AG}\left(r\right)=&2{\rho }_{NG}\left(r\right)=2{\rho }_{ZG}\left(r\right)\\=&\frac{4}{{{\pi }^{\frac{3}{2}}s}_{AG}^{3}}\left(1+\frac{{F}_{AG}{r}^{2}}{{s}_{AG}^{2}}\right)\mathrm{e}\mathrm{x}\mathrm{p}\left(-\frac{{r}^{2}}{{s}_{AG}^{2}}\right)\end{aligned}$

(8) with
$ {s}_{AG}=1.5840\;\mathrm{f}\mathrm{m} $ ,$ {F}_{AG}=4/3 $ for12C, and$ {s}_{AG}= $ 1.7410 fm,$ {F}_{AG}= $ 2 for16O. However, this type of density profile is not known to us for40Ca.In [8], an effective analytical method for evaluating double-folding integrals was developed. For the NDs, a symmetrized Woods-Saxon function was used and applied systematically in a study by Sargsyanet al. [5]. In our case, this function reads as
$\begin{aligned}[b] {\rho }_{AS}\left(r\right)=&2{\rho }_{NS}\left(r\right)=2{\rho }_{ZS}\left(r\right)\\=&\frac{{\rho }_{SC}\mathrm{s}\mathrm{i}\mathrm{n}\mathrm{h}\left({R}_{0S}/{a}_{S}\right)}{\mathrm{c}\mathrm{o}\mathrm{s}\mathrm{h}\left({R}_{0S}/{a}_{S}\right)+\mathrm{c}\mathrm{o}\mathrm{s}\mathrm{h}\left(r/{a}_{S}\right)}.\end{aligned} $

(9) Here,
$ {R}_{0S}={r}_{0S}{A}^{1/3} $ ,$ {r}_{0S} $ =1.15 fm,$ {a}_{A} $ =0.53 fm for12C,16O and 0.55 fm for40Ca. We find$ {\rho }_{SC} $ from the normalization condition. -
We propose a novel algorithm for finding NDs based on experimental NCDs. We call it Fermi+exponential and denote it as FE:
$\begin{aligned} & {\rho}_{AFE}(r)={2\rho}_{ZFE}(r)={2{\rho}}_{NFE}(r)\\= &\left\{\begin{array}{cc}{\rho}_{FEC}{\left[1+ {\exp} \left\{(r-{R}_{0FE})/{a}_{AF}\right\}\right]}^{-1} & {\rm{at}}\;\; {r < {R}_{0FE}},\;\;(10)\\ {0.5{\rho}}_{FEC}{\exp}\left\{({R}_{0FE}-r)/{a}_{AE}\right\} & {{\rm{at}}}\;\; {r \ge {R}_{0FE}}.\;\;(11)\end{array}\right. \end{aligned}$

First, we approximate the ND using the Fermi profile (Eq. (10)). The values of
$ {R}_{0FE} $ and$ {a}_{AF} $ are varied to reach good agreement with the inner part of the experimental NCD. Then, for$ r\ge {R}_{0FE} $ , the ND is approximated by an exponential function (Eq. (11)). At$ r={R}_{0FE} $ , Eqs. (10) and (11) result in$ 0.5{\rho }_{FEC} $ . The diffuseness of the exponential tail,$ {a}_{AE} $ , is varied to fit the tail of the NCD, and then the constant$ {\rho }_{FEC} $ is found from the normalization condition$ A=\int {\rm d}\overrightarrow{r}{\rho }_{AFE}\left(r\right) . $

(12) The parameters
$ {R}_{0FE} $ ,$ {a}_{AF} $ , and$ {a}_{AE} $ providing the best agreement with the experimental NCDs are presented inTable 1.Nucleus ${r}_{q{\rm exp}}$ 

/fmexp err
/fm$ {\xi }_{rG} $ 

(%)$ {\xi }_{r2pF} $ 

(%)$ {\xi }_{rS} $ 

(%)$ {\xi }_{rFE} $ 

(%)$ {\xi }_{\rho G} $ 

(%)$ {\xi }_{\rho 2pF} $ 

(%)$ {\xi }_{\rho S} $ 

(%)$ {\xi }_{\rho FE} $ 

(%)$ {R}_{0FE} $ 

/fm$ {a}_{AF} $ 

/fm$ {a}_{AE} $ 

/fm$ {E}_{2} $ 

/MeV12C 2.4702 0.0022 0.9 n/a 19.9 -0.3 21.3 n/a 371 11.0 2.50 0.27 0.42 7.7 16O 2.6991 0.0052 2.0 n/a 14.9 1.6 18.4 n/a 129 7.9 2.80 0.25 0.47 6.1 40Ca 3.4778 0.0012 n/a 0.8 8.4 -0.5 n/a 18.3 55.2 12.7 3.75 0.62 0.54 3.7 Table 1.Experimental rms charge radii
${r}_{q{\rm exp}}$ with their errors [27], the fractional differences for the radii$ {\xi }_{rG} $ ,$ {\xi }_{r2pF} $ ,$ {\xi }_{rS} $ , and${\xi }_{rFE}$ , the average differences in the densities$ {\xi }_{\rho G} $ ,$ {\xi }_{\rho 2pF} $ ,$ {\xi }_{\rho S} $ , and${\xi }_{\rho FE}$ , the parameters resulting from the FE algorithm,$ {R}_{0FE} $ ,$ {a}_{AF} $ , and$ {a}_{AE} $ , and the energy of the second excited state,$ {E}_{2} $ .The NCDs resulting from
$ {\rho }_{AS}\left(r\right) $ ,$ {\rho }_{AG}\left(r\right) $ , and$ {\rho }_{Z2pF}\left(r\right) $ (that is, $ {\rho }_{qS}\left(r\right) $ ,$ {\rho }_{qG}\left(r\right) $ , and$ {\rho }_{q2pF}\left(r\right) $ ) as well as from the novel algorithm (FE algorithm henceforth$ {\rho }_{qFE}\left(r\right) $ ) are compared with the experimental NCDs inFigs. 1,2, and3for12C,16O, and40Ca, respectively. For the12C and16O nuclei, the Gaussian ND-profile results in good agreement with${\rho }_{q{\rm exp}}\left(r\right)$ in the nuclear interior, whereas for the tail,$ {\rho }_{qG}\left(r\right) $ underestimates the data. The FE-algorithm provides somewhat poorer agreement with${\rho }_{q{\rm exp}}\left(r\right)$ in the interior but a considerably better reproduction of the data in the tail. The NDs$ {\rho }_{qS}\left(r\right) $ disagree with${\rho }_{q{\rm exp}}\left(r\right)$ for all values of$ r $ .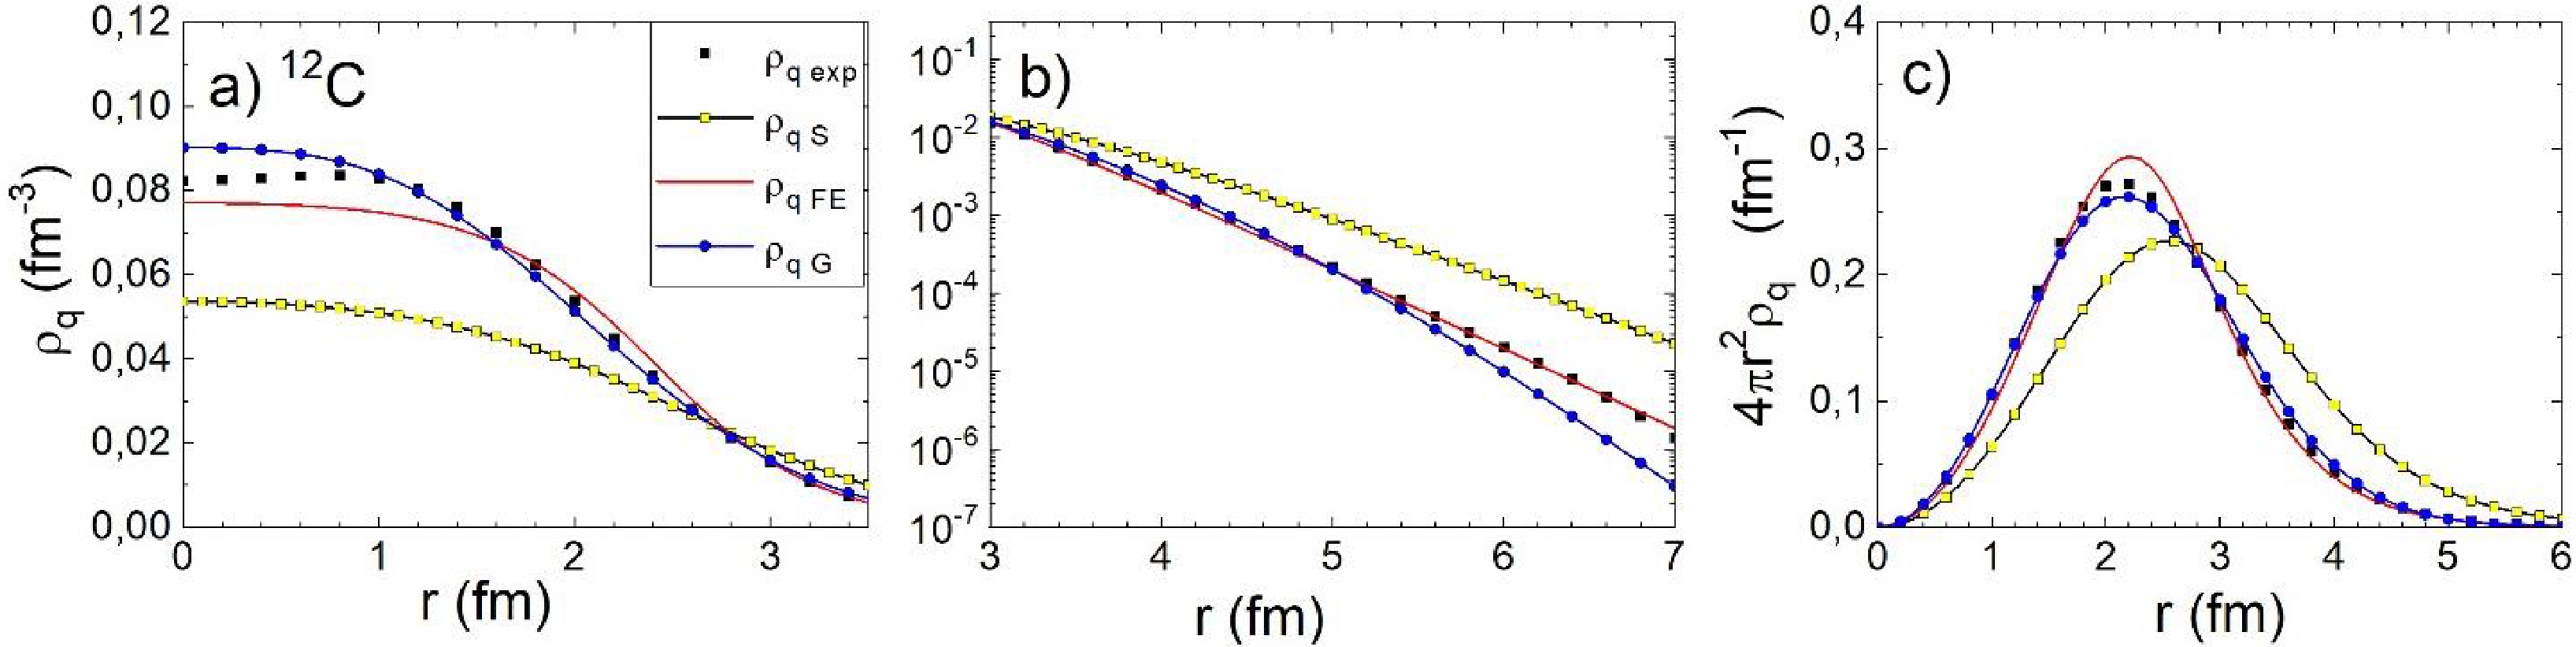
Figure 1.(color online) Nucleus charge densities in linear (a) and logarithmic (b) scales and the “radial” charge density
$ 4{\pi {r}^{2}\rho }_{q}\left(r\right) $ (c) for12C. The black squares (see Eq. (2)) indicate the experimental density, the light squares represent Sargsyan density, the lines without symbols denote FE densities, and the lines with solid circles represent Gaussian density.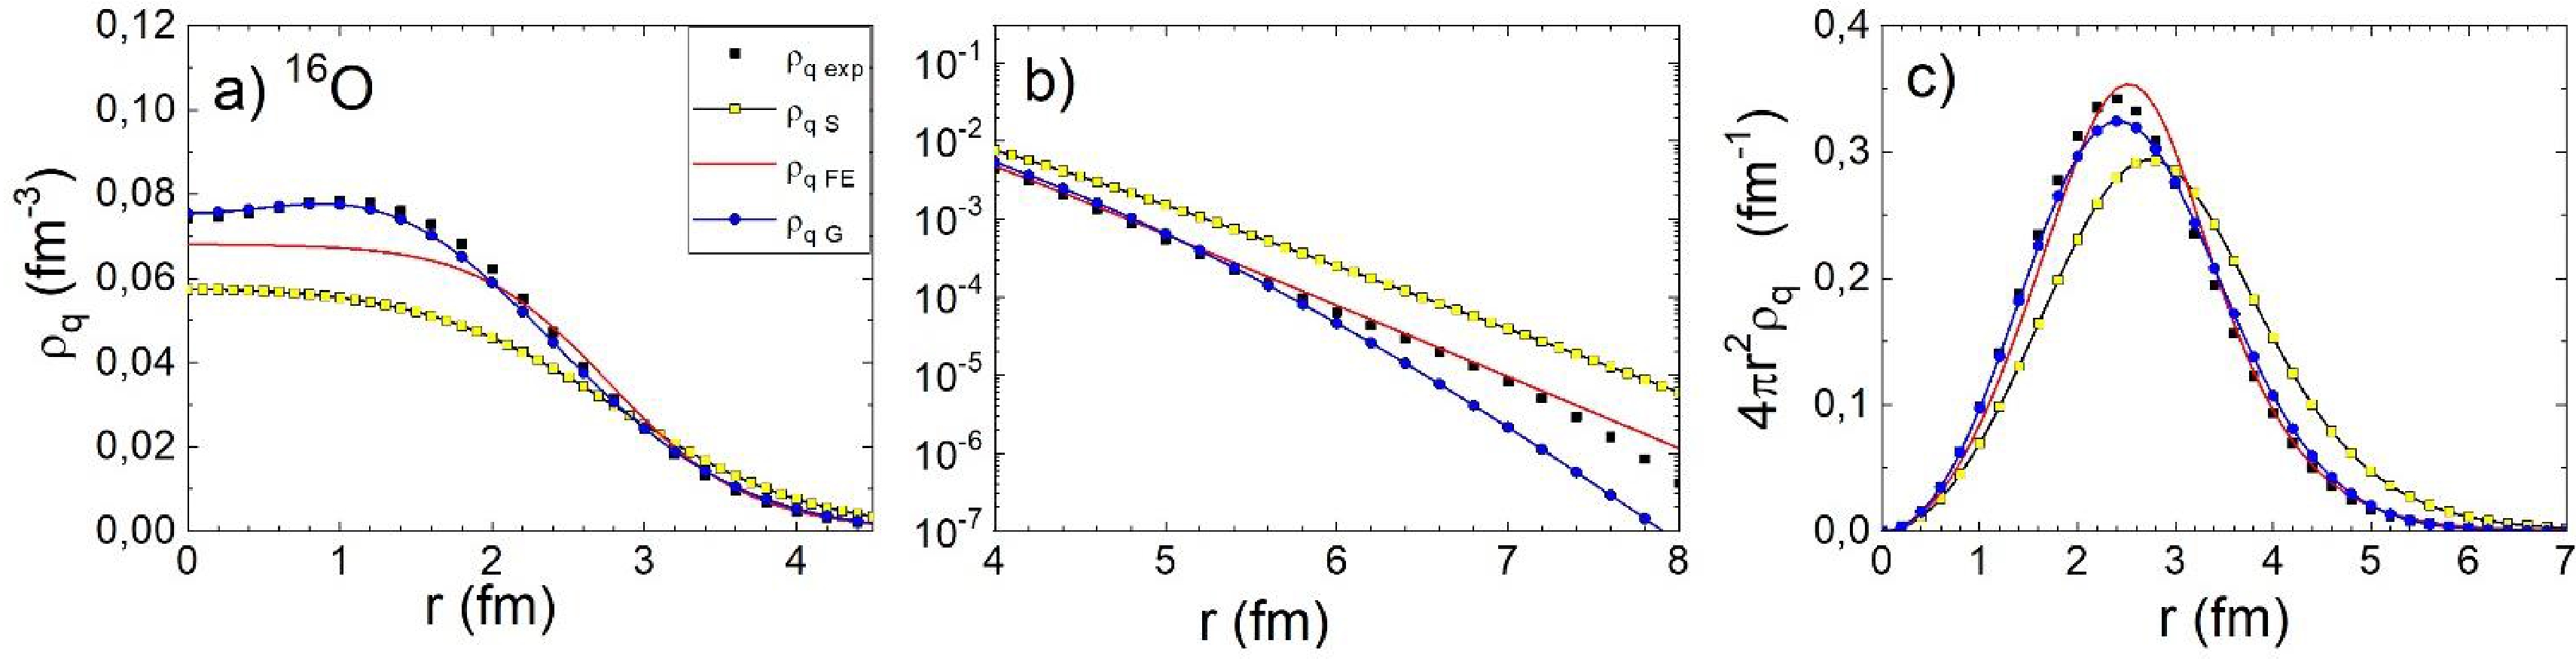
Figure 2.(color online) Same as in Fig. 1 but for16O.
For40Ca (seeFig. 3), the Gaussian ND profile is absent, and we compare
${\rho }_{q{\rm exp}}\left(r\right)$ with the charge density resulting from the 2pF ND instead. The charge densities$ {\rho }_{q2pF}\left(r\right) $ and$ {\rho }_{qFE}\left(r\right) $ are in good agreement with each other. For the interior, they reproduce${\rho }_{q{\rm exp}}\left(r\right)$ well, whereas for the tail, the agreement worsens.$ {\rho }_{qS}\left(r\right) $ again significantly deviates from the data.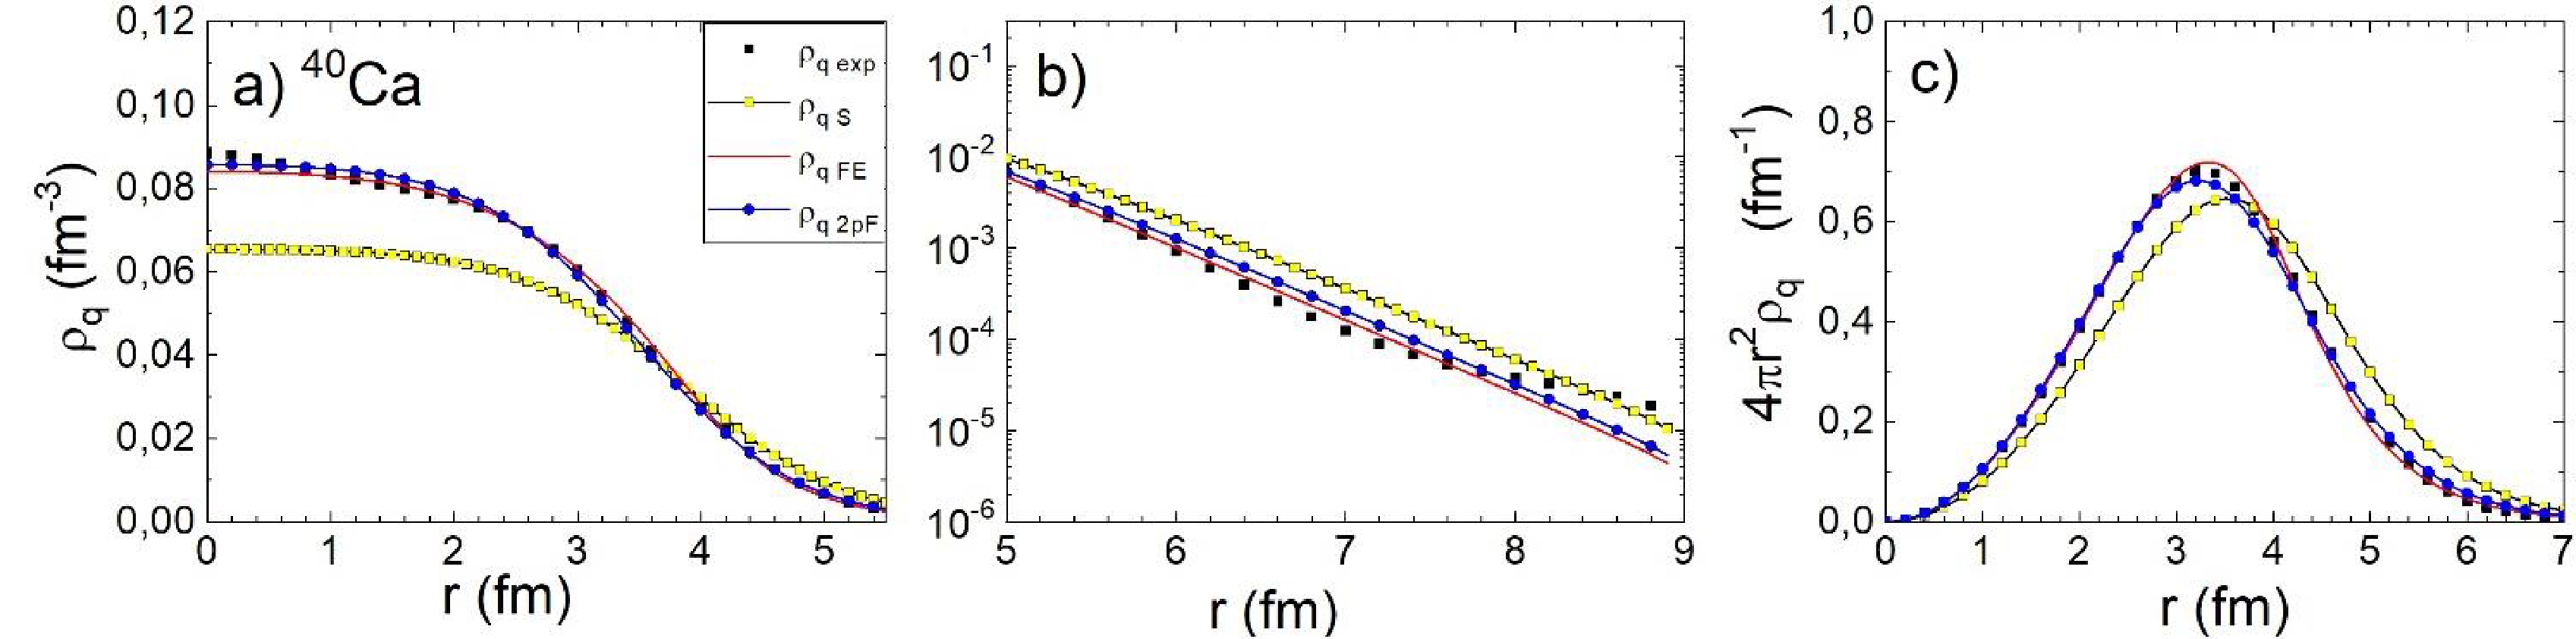
Figure 3.(color online) Same as in Figs. 1, 2 but for40Ca. The lines with solid circles represent 2pF density.
For a quantitative measure of the agreement between the theoretical and experimental NCDs, we use two quantities. The first, the fractional difference between the root mean square radii,
$ {\xi }_{ru} $ , reads as$ {\xi }_{ru}=r_{qu}/r_{q\;{\rm exp}}-1.$

(13) The second quantity is the average fractional difference between the NCDs,
$ {\xi }_{\rho u} $ :$ {\xi }_{\rho u}=\frac{1}{Q}\sum _{i=1}^{Q}\left|1-\frac{{\rho }_{qu}\left({r}_{i}\right)}{{\rho }_{q{\rm exp}}\left({r}_{i}\right)}\right|.$

(14) Here, the summation is limited by the range of the experimental NCDs [26]. In Eqs. (13) and (14),
$ u=G $ ,FE, 2pF, orS.The results of the quantitative comparison are presented inTable 1. We can see that for the NCD, the FE algorithm provides significantly better agreement with the experimental values than the others NDs. Yet, the deviation
$ {\rho }_{qS} $ from the experimental NCDs is the most striking. -
Of the four considered versions of the densities, only
$ {\rho }_{AS}\left(r\right) $ and$ {\rho }_{AFE}\left(r\right) $ are available for the nuclei12C,16O, and40Ca. However, the NDs$ {\rho }_{AS}\left(r\right) $ of Refs. [5,8,19] fail to produce charge densities in agreement with experimental values. Moreover, in those studies, Migdal Skyrme-typeNNforces were used. Therefore, for the remainder of the paper, all calculations are performed with only FE-densities. Here, we provide only a brief description of the options employed; all the details on the version of the double-folding model utilized in the this study can be found in [13,15].The potential energies for the reactions under consideration are calculated within the framework of the double folding model (see Eq. (1)) with the frozen densities
$ {\rho }_{AFE}\left(r\right) $ . For the effective nucleon-nucleon forces,$ {v}_{NN} $ , the M3Y-Paris parameterization is applied. The nuclear term of the nucleus-nucleus potential consists of direct and exchange parts. For the latter, the option with finite rangeNN-forces is employed. Both direct and exchange parts are density dependent. There are approximately ten parameterizations of this dependence [21,31]; we use the DD2-option according toTable 2of Ref. [38]. It is known in literature that the version with the finite-range exchange term and this density dependence of$ {\mathrm{v}}_{NN} $ successfully reproduces the nuclear matter equilibrium density, binding energy, and incompressibility as well as the high precision above-barrier fusion heavy-ion cross-sections.Reaction $ {R}_{b0} $ 

/fm$ \hslash {\mathrm{\Omega }}_{b0} $ 

/MeV$ {B}_{Z} $ 

/MeV$ {B}_{0} $ 

/MeV$ {B}_{0exp} $ (err)

/MeVSource
of${B}_{\rm 0exp}$ 

Source
of${\sigma }_{\rm exp}$ 

$ {E}_{cut} $ 

/MeV$ \upsilon $ 

$ {K}_{Rm} $ (err)

/($\mathrm{z}\mathrm{s}\cdot {\mathrm{G}\mathrm{e}\mathrm{V} }^{-1})$ 

$ {\chi }_{m}^{2} $ 

R112C+12C 7.73 2.17 7.87 6.22 5.8(0.3) [40] [41] 13.9 27 77(7) 2.8 R112C+12C − − − − 6.17(0.10) [42] [40] − 45 88(10) 2.9 R212C+16O 8.12 2.15 9.99 7.90 7.7(0.4) [41] [41] 14.0 25 85(10) 1.6 R212C+16O − − − − 7.69(0.10) [43] − − − − − R316O+16O 7.99 2.33 12.71 10.72 11.2(0.6) [41] [44] 16.8 48 44(8) 7.1 R416O +40Ca 9.29 2.46 26.97 23.04 23.7(1.0) [45] [45,46] 26.7 3+6 18(7) 0.4 R540Ca +40Ca 10.04 2.55 58.55 53.30 50.6(2.8) [41] [47] 57.0 4 13(11) 0.9 R540Ca +40Ca − − − − 51.5(0.5) [48] [48] − 11 7(6) 2.5 Table 2.For the five reactions under consideration, the following quantities are presented: thes-wave barrier radius
$ {R}_{b0} $ and width$ \hslash {\mathrm{\Omega }}_{b0} $ ,$ {B}_{Z} $ (see Eq. (23)), thes-wave barrier heights$ {B}_{0} $ calculated in this study, thes-wave experimental barrier height${B}_{\rm 0exp}$ (with its error) and the corresponding references, the references to the experimental cross sections, the value${E}_{\rm cut}$ discussed in Sec. V, the number of data points used for the detailed quantitative analysis$ \upsilon $ , the friction strength$ {K}_{Rm} $ (with its error) providing the least value of$ {\chi }^{2} $ ,$ {\chi }_{m}^{2} $ (see Eq. (21)), and${E}_{\rm cut}={B}_{0}+{E}_{2}$ .Information on the reactions under consideration is presented inTable 2. For the reactions12C +12C,16O and16O +16O,40Ca, the calculateds-wave barrier energies
$ {B}_{0} $ are in good agreement with the experimental values. For the reaction40Ca+40Ca, the agreement is somewhat worse. However, one should remember that the “experimental barrier energy” is based on not only the measured fusion cross sections but also the model used for the analysis of these cross sections.In the present study, the capture cross-sections are calculated using standard quantum mechanical formulas (see, for example, [39], Eqs. (1.38) and (1.143)):
$ {\sigma }_{\rm th}=\frac{\pi {\hslash }^{2}}{2{m}_{R}{E}_{\rm c.m.}}\sum _{L=\mathrm{0,1},2,\dots }^{{L}_{\rm max}}\left(2L+1\right){T}_{L} $

(15) for the12C+16O and16O+40Ca reactions, and
$ {\sigma }_{\rm th}=\frac{\pi {\hslash }^{2}}{{m}_{R}{E}_{\rm c.m.}}\sum _{L=\mathrm{0,2},4\dots }^{{L}_{\rm max}}\left(2L+1\right){T}_{L}. $

(16) for the other reactions. Here,
${E}_{\rm c.m.}$ is the collision energy in the center-of-mass frame,$ {m}_{R}={m}_{n}{A}_{1}{A}_{2}/({A}_{1}+{A}_{2}) $ ,$ L $ denotes the angular momentum in units of$ \hslash $ ,${L}_{\rm max}$ is the maximal angular momentum above which the transmission coefficient equals zero, and$ {m}_{n} $ represents the nucleon mass.In this study, the transmission coefficients are evaluated using two options. In the first, the barrier penetration model (BPM) within the framework of the parabolic approximation is applied:
$ {T}_{L{\rm BPM}}={\left\{1+\mathrm{e}\mathrm{x}\mathrm{p}\left[2\pi \left({U}_{bL}-{E}_{\rm c.m.}\right)/\left(\hslash {\mathrm{\Omega }}_{bL}\right)\right]\right\}}^{-1}. $

(17) Here,
$ {U}_{bL} $ and$ {\mathrm{\Omega }}_{bL}=\sqrt{{C}_{2bL}/{m}_{q}} $ denote the barrier height and curvature calculated for the$ L $ -th partial wave (see definition of$ {m}_{q} $ below). The cross-sections evaluated using this option are denoted as${\sigma }_{\rm BPM}$ . They approximately correspond to the upper limit of the theoretical cross-sections${\sigma }_{\rm th}$ obtained dynamically because accounting for dissipation inhibits the fusion process.The second option for obtaining the transmission coefficient is the trajectory model with surface friction (TM) [13,49]. The physical picture of the TM is similar to that in Ref. [50]. An imaginary Brownian particle with reduced mass, whose motion corresponds to the relative motion of the colliding nuclei, wanders, influenced by conservative, dissipative, and random (fluctuating) forces. In this study, only the collisions at energies well exceeding the Coulomb barrier are considered. Therefore, tunneling and channel coupling can be safely neglected.
The motion of the Brownian particle is described by a dimensionless coordinateq, which is proportional to the distance between the centers of the colliding nucleiR. In [49], it was demonstrated that the orbital degree of freedom can be ignored because it influences the cross-sections within the framework of the statistical errors (typically 1%). In [51], it was proved that in the collision process, memory effects at distances larger than the contact configuration can be discarded. Because this configuration is never reached in our modeling, we use stochastic Langevin-type equations with white noise and instant dissipation:
$ \begin{aligned}[b]{\rm d}p=&\left\{-\frac{{\rm d}{U}_{\rm tot}}{{\rm d}q}+\frac{{\hslash }^{2}{L}^{2}}{{m}_{q}{q}^{3}}-\frac{p}{{m}_{q}}{K}_{R}{\left[\frac{{\rm d}{U}_{n}}{{\rm d}q}\right]}^{2}\right\}{\rm d}t\\&+\left|\frac{{\rm d}{U}_{n}}{{\rm d}q}\right|{\rm d}W\sqrt{2\theta {K}_{R}},\end{aligned} $

(18) $ {\rm d}q=\frac{p{\rm d}t}{{m}_{q}}. $

(19) Here,
${U}_{\rm tot}={U}_{n}+{U}_{\rm C}$ denotes the total nucleus-nucleus interaction energy,$ p $ denotes the linear momentum corresponding to the relative motion of the colliding nuclei,$ \hslash L $ is the projection of the orbital angular momentum onto the axis perpendicular to the reaction plane,$ {K}_{R} $ denotes the dissipation strength coefficient, andθrepresents the thermal energy (temperature). The quantity$ {m}_{q} $ is the inertia parameter$ {{m}_{q}=m}_{R}{R}_{PT}^{2} $

(20) where
$ {R}_{PT}=1.2\left({A}_{1}^{1/3}+{A}_{2}^{1/3}\right)\;\mathrm{f}\mathrm{m} $ . In fact, the model is designed in such a way that its physical results are independent of the real value of$ {R}_{PT} $ . The time-dependent temperature$ \theta $ in Eq. (18) is related to the dissipated energy via the Fermi-gas relation. All details on how$ \theta $ is evaluated can be found in Refs. [13,49].The dissipative force (the final term in the figure brackets in Eq. (18)) is related to the nuclear term of the interaction energy via the surface friction expression [50,52]. The random force (the final term in Eq. (18)) is proportional to the increment of the Wiener process
${\rm d}W$ , which possesses zero average and a variance equal to${\rm d}t$ . Eqs. (18) and (19) are solved numerically using the Runge-Kutta method (find details in [49,53]).Within the framework of the TM, the transmission coefficient
${T}_{L{\rm TM}}$ is defined as the number of captured trajectories divided by the total number of trajectories for each$ L $ -value. The capture conditions are described in Sec. II F of Ref. [49]. More details on the TM are presented in Refs. [13,54]. -
InFig. 4, we show nearly all the above-barrier experimental fusion cross sections
${\sigma }_{\rm exp}$ found in literature. For reaction R1 (panel a), five sets of data are available [40,41,43,55,56]. Keeping in mind that sub- and near-barrier data cannot be used in our study, we exclude the data of Refs. [57−59]. We also omit the data from Refs. [42,60] because there are only several convenient points in each of these articles, and the experimental errors are rather large. The data inFig. 4(a) form two blocks: those from Refs. [40,55] and those from Refs. [41,43,56]. Inside each block, the data agree with each other, whereas there seems to be some disagreement between the data of different blocks. Therefore, we select the data from [40] and [41] for detailed quantitative separate comparison with the calculations.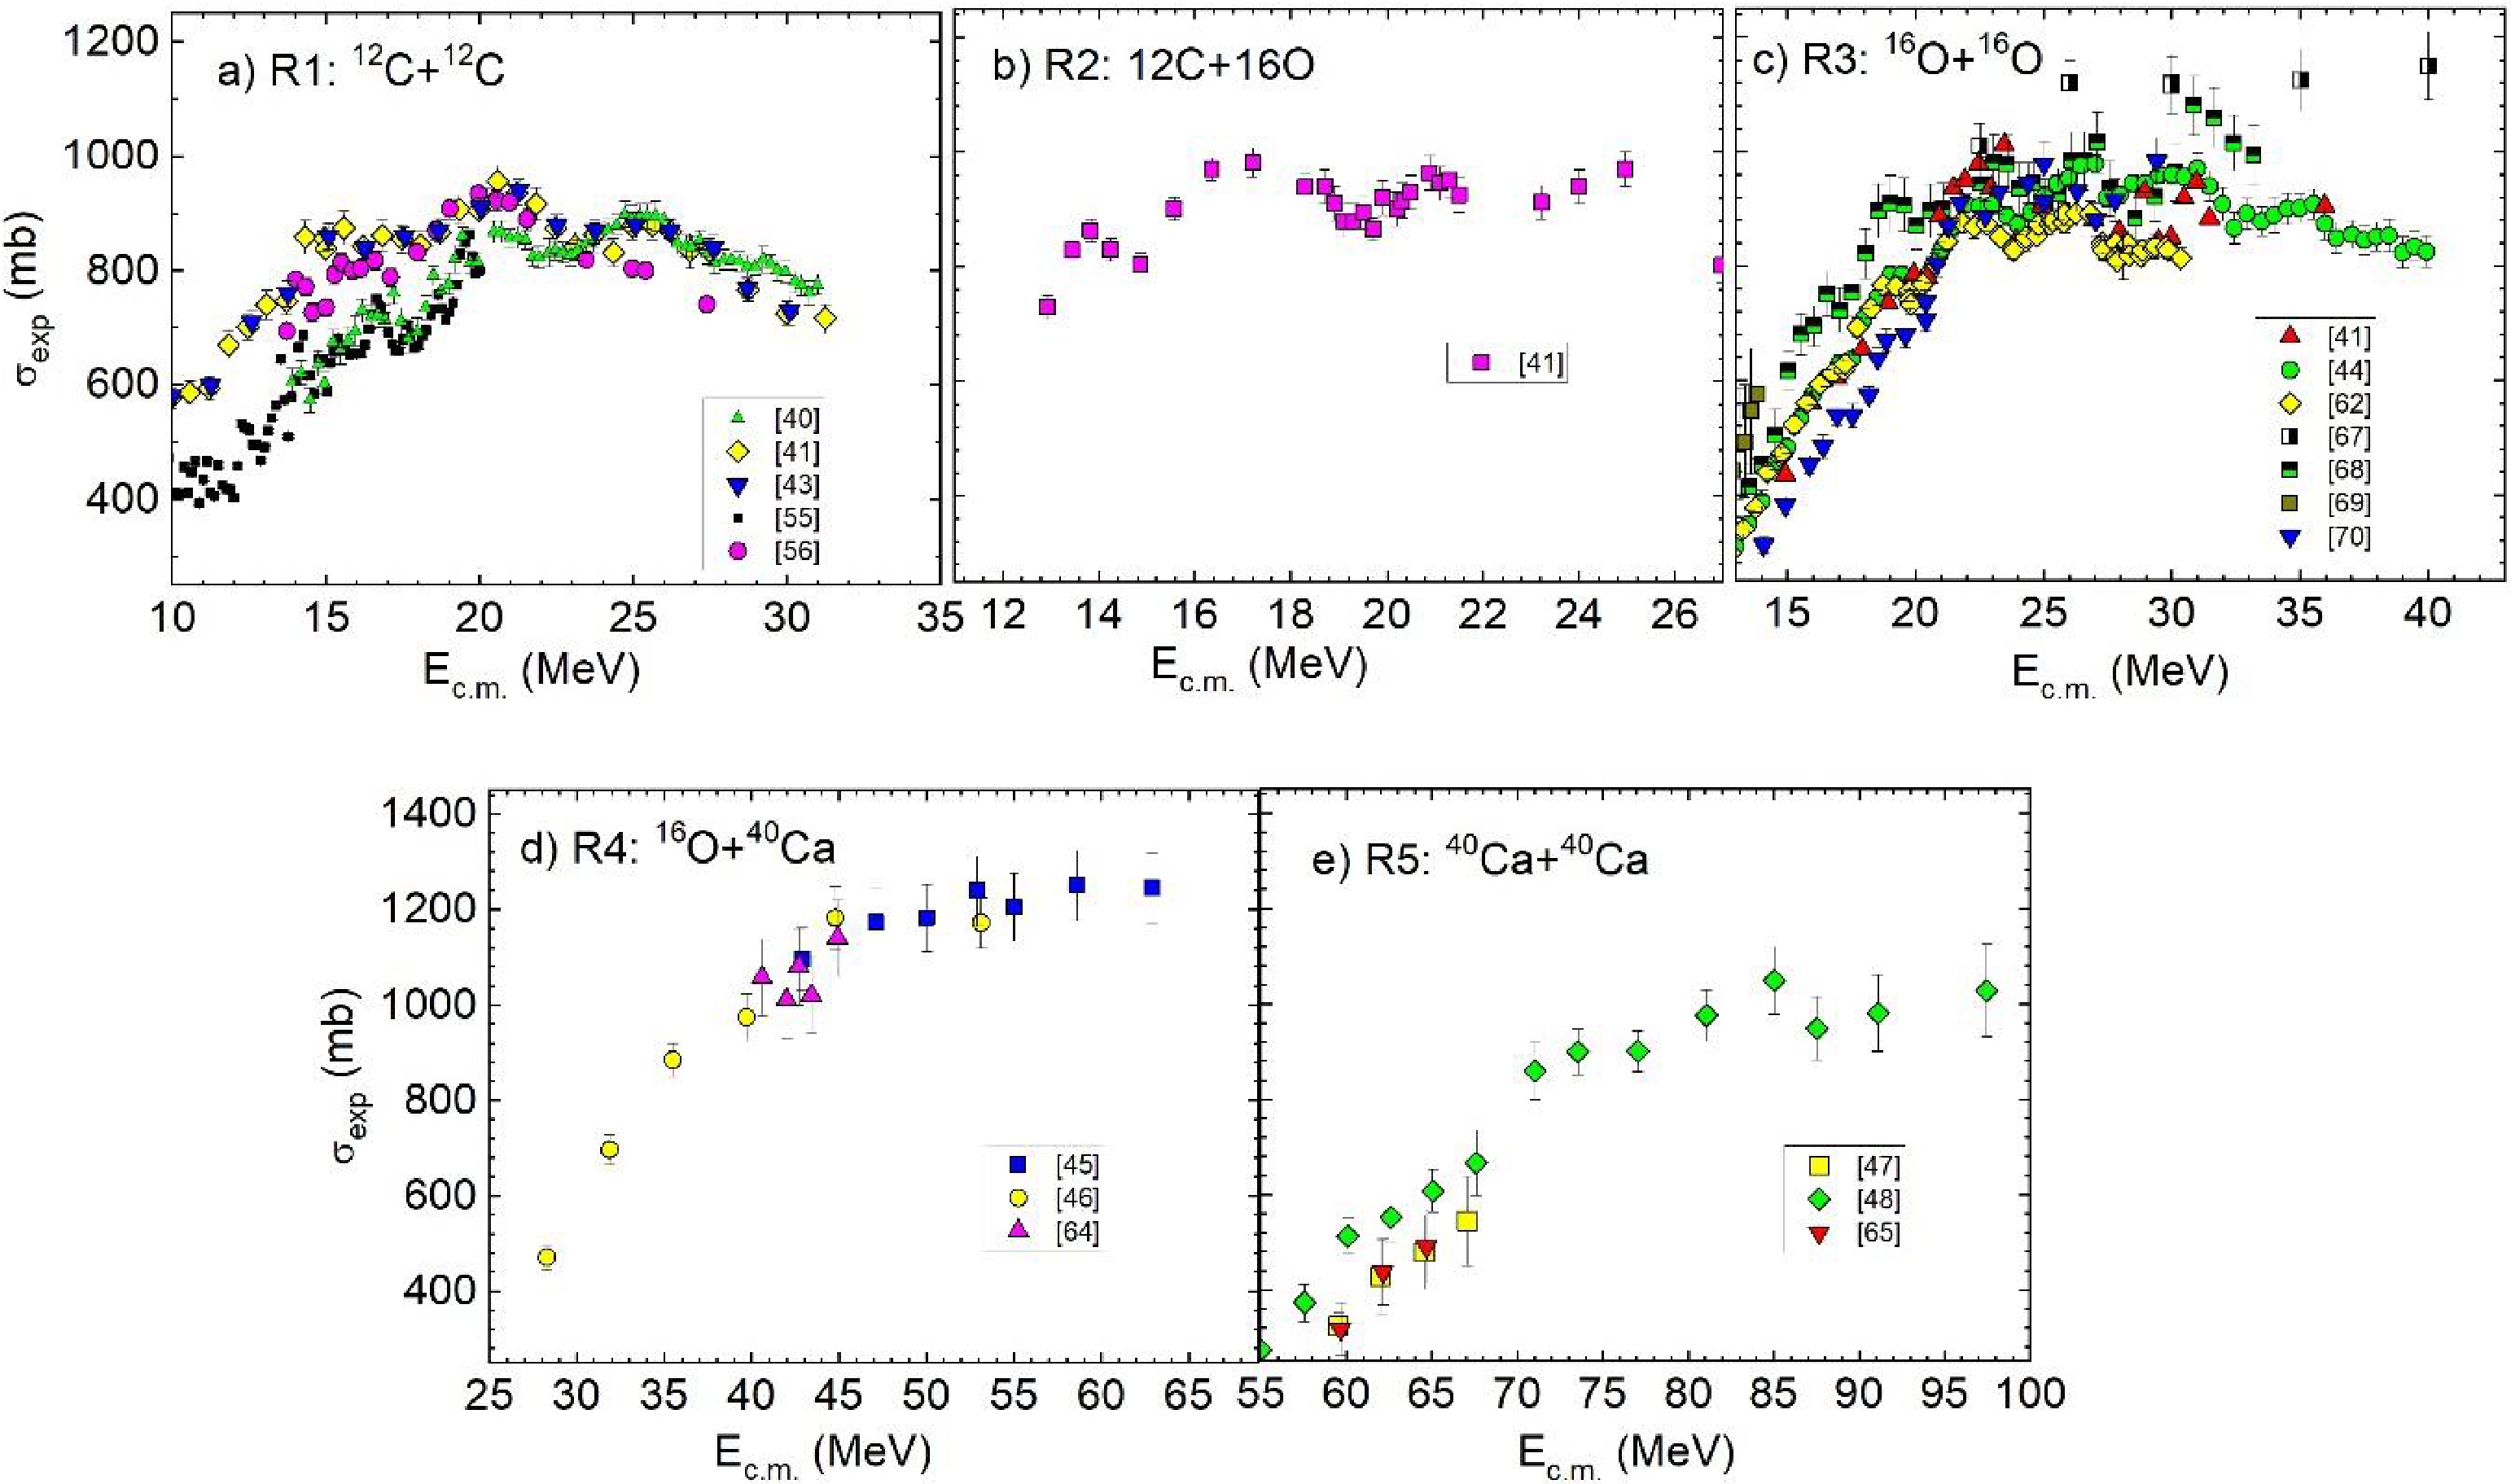
Figure 4.(color online) Experimental fusion cross section versus the center-of-mass energy. References to the original papers are indicated in the panels. In many cases, data are taken from [61].
A similar problem seems to arise for reaction R3 (seeFig. 4(c)). However, three datasets [41,44,62] are in reasonable agreement with each other. Therefore, we choose the single dataset [41] for detailed comparison. The non-monotonic oscillating behavior of the cross-sections in reactions R1, R2, and R3 was discussed in the original experimental papers and in Ref. [63]. Therefore, we do not discuss this behavior here.
Figure 4(d) shows that the datasets [45,46,64] for reaction R4 do not contradict to each other. Below, we compare with the calculations the combined dataset [46] at lower energies and [45] at higher energies. Finally, for reaction R5, we see inFig. 4(e) that data from [48] do not agree with data from [47,65]. However, there are only three overlapping points at above barrier energies from [47,65]. Thus, we select data from [48] and [47] for separate detailed comparison with calculations. We omit data from [66] because there are only three suitable points with large errors.
For the selected experimental datasets, we perform a quantitative comparison between the theory and experiment using the conventional
$ {\chi }^{2} $ criterion:$ {\chi }^{2}=\frac{1}{\upsilon }\sum _{i=1}^{\upsilon }{\left(\frac{{\sigma }_{i\text{TM}}-{\sigma }_{i\text{exp}}}{\mathrm{\Delta }{\sigma }_{i\text{exp}}}\right)}^{2}. $

(21) It is difficult to decide which collision energies to use from the experimental dataset for detailed quantitative comparison with calculations. In [13,14] the criterion
$ {\sigma }_{\text{exp}} > 200 $ mb was chosen following Ref. [32]; this approximately corresponds to${E}_{\rm c.m.} > 1.1{B}_{0}$ . This criterion was formulated in [32] based on the coupled-channel calculations for the16O +154Sm reaction. Accordingly, in [13,14], reactions were considered in which one of the colliding nuclei was92Zr or heavier. For such relatively heavy nuclei, the energies of the lowest excited states are at most 1 MeV, and the barrier energies are approximately 40 MeV or larger. Considering collisions at energies larger than$ 1.1{B}_{0} $ , we can safely deal with the case in which several excited states are occupied at the barrier configuration, providing dissipation, which is an essential element of the TM.In this study, collisions of light nuclei are considered, with the energy of first excited state being as large as 5 MeV and the barrier energy as low as 10 MeV. Therefore, even at
$ {E}_{\rm c.m.}\approx 2{B}_{0} $ , we are not in the situation where several excited states are occupied, providing dissipation, at the barrier configuration. Therefore, in this study, we apply the phenomenological criterion${E}_{\rm c.m.} > {E}_{\rm cut}= {B}_{0}+{E}_{2}$ , where$ {E}_{2} $ is the lowest energy of the second excited state of two colliding nuclei.The results of the TM-calculations depend on the friction strength
$ {K}_{R} $ , for which the following empirical formula was obtained in [14]:$ {K}_{Re}={K}_{1}\mathrm{e}\mathrm{x}\mathrm{p}\left(\frac{{B}_{0}-{B}_{Z}}{\Delta B}\right)+{K}_{0}.$

(22) Here,
$ {B}_{Z}=\frac{{Z}_{1}{Z}_{2}}{{A}_{1}^{1/3}+{A}_{2}^{1/3}}\mathrm{M}\mathrm{e}\mathrm{V} $

(23) is the approximate Coulomb barrier energy.
For the reactions12C+12C,12C+16O, and16O+16O, Eq. (22) with the coefficients of [14]
$ {K}_{1}=260 $ $\mathrm{z}\mathrm{s}\cdot {\mathrm{G}\mathrm{e}\mathrm{V}}^{-1}$ ,$ {K}_{0}=10 $ $\;\mathrm{z}\mathrm{s}\cdot {\mathrm{G}\mathrm{e}\mathrm{V}}^{-1}$ ,$ {B}_{0}=7 $ MeV, and$ \Delta B=15 $ MeV results in${K}_{Re}\approx 190 \div 26$ 0$\mathrm{z}\mathrm{s}\cdot {\mathrm{G}\mathrm{e}\mathrm{V}}^{-1}$ . In the present calculations, these values lead to unrealistically small cross sections${\sigma }_{\rm TM}$ . Yet, Eq. (22) and its coefficients are based on the cross sections calculated for reactions with$ {B}_{Z} > 40 $ MeV, whereas for some reactions considered in this study,$ {B}_{Z} < 13 $ MeV. Therefore, we use the asymptotic value$ {K}_{R}={K}_{0}=10 $ $\mathrm{z}\mathrm{s}\cdot {\mathrm{G}\mathrm{e}\mathrm{V}}^{-1}$ as the first approximation and then vary$ {K}_{R} $ (if possible) to attempt to reach an agreement with the data.InFig. 5, we compare the calculated cross sections with the experimental values from Ref. [41] for reaction R1 and from Ref. [44] for reaction R3. The cross sections calculated using the BPM,
${\sigma }_{\rm BPM}$ , significantly overshoot the experimental data at above barrier collision energies. We consider this an indication that friction is important in the process at these energies. It should be noted that the relation${{\sigma }_{\rm BPM} > \sigma }_{\rm exp}$ holds for all considered reactions. The corss sections calculated accounting for dissipation,${\sigma }_{\rm TM}$ , agree with the measured values considerably better provided the value of$ {K}_{R} $ is chosen properly.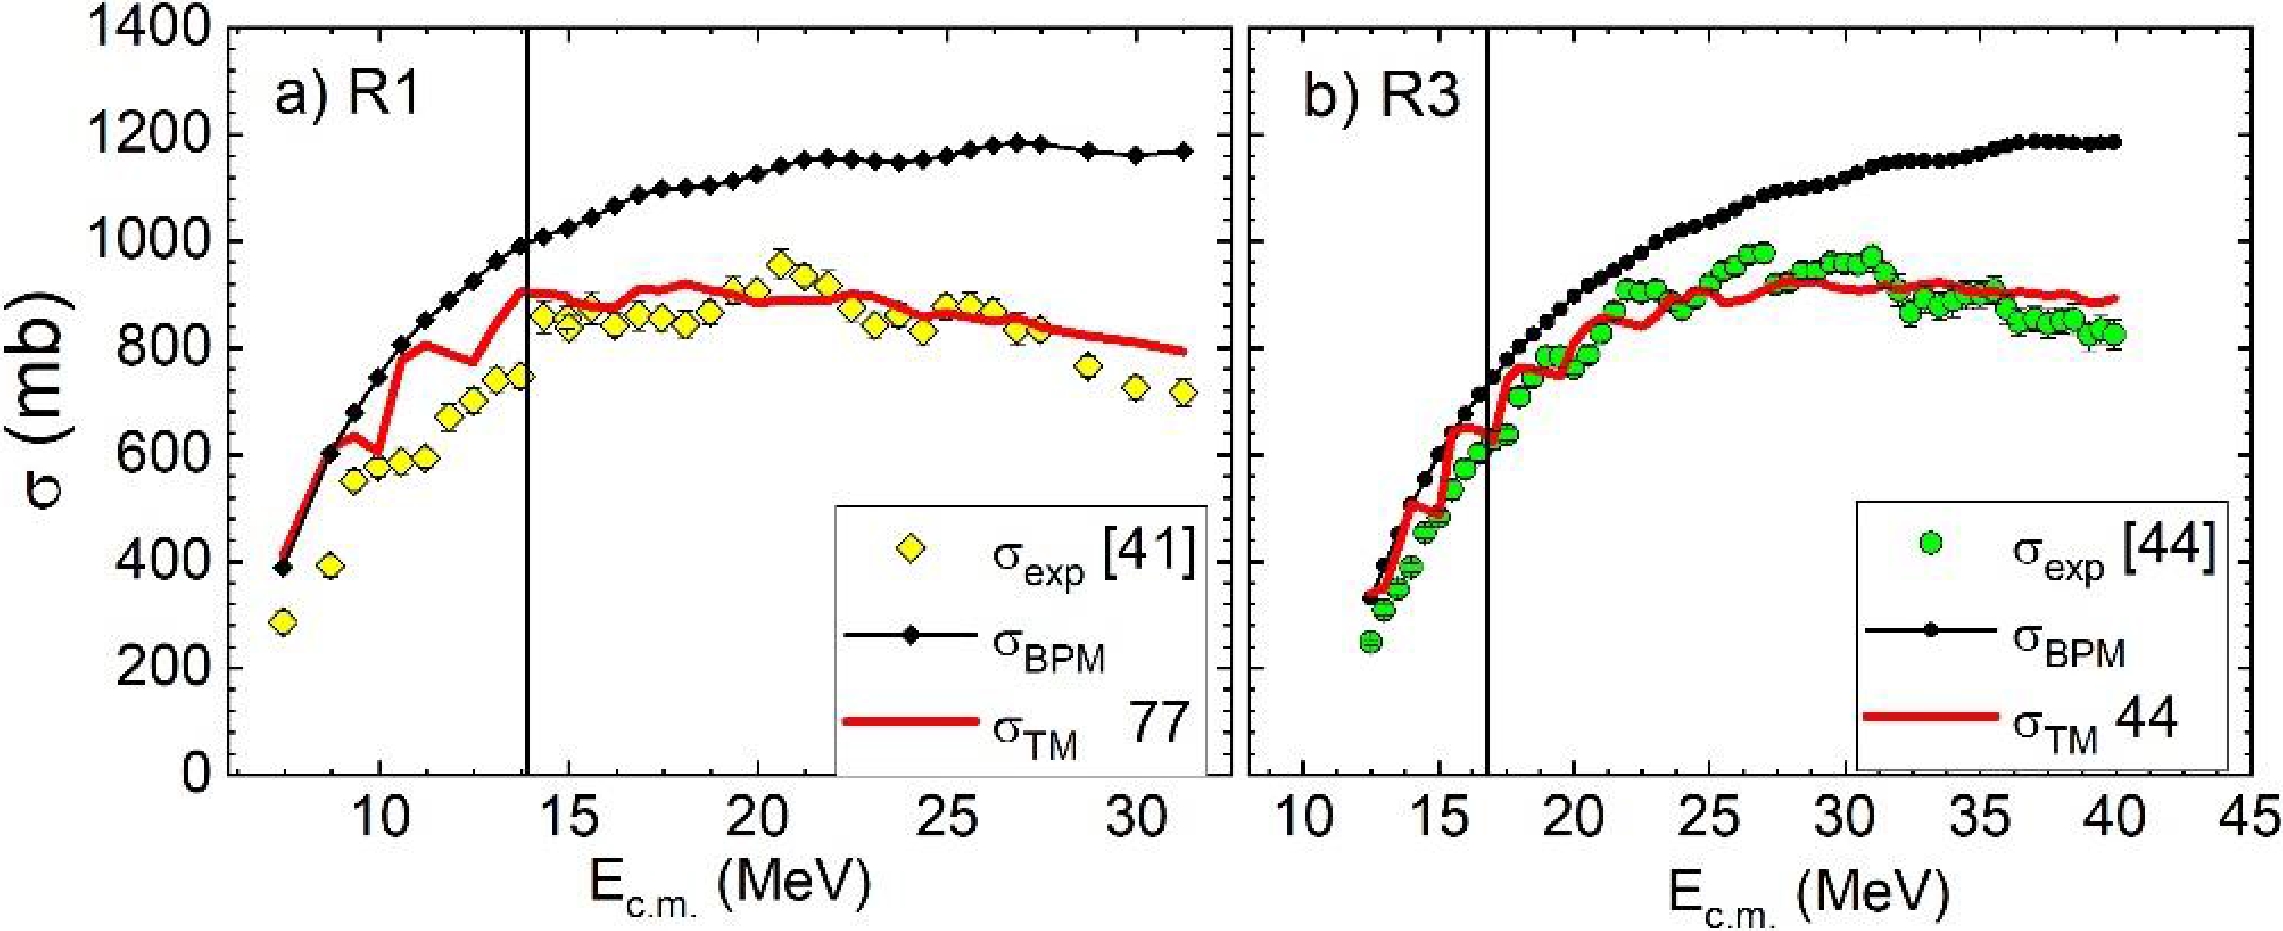
Figure 5.(color online) For two reactions, theoretical fusion cross sections (
${\sigma }_{\rm BPM}$ , lines with symbols;${\sigma }_{\rm TM}$ , lines without symbols) are compared with the experimental values (scatter symbols). The digits next to${\sigma }_{\rm TM}$ are the values of$ {K}_{R} $ / ($\mathrm{z}\mathrm{s}\cdot {\mathrm{G}\mathrm{e}\mathrm{V}}^{-1}$ ) (seeTable 2). The vertical lines correspond to${E}_{\rm cut}$ .Such pictures are typical for other reactions and datasets; therefore, we prefer to present the ratios
${\sigma }_{\rm BPM}/{\sigma }_{\rm exp}$ and${\sigma }_{\rm TM}/{\sigma }_{\rm exp}$ inFig. 6. The values of$ {\sigma }_{\rm TM} $ in these figures correspond to the values of$ {K}_{R} $ ($ {K}_{Rm} $ ) providing the minimum value of$ {\chi }^{2} $ ($ {\chi }_{m}^{2} $ ). The values of$ {K}_{Rm} $ and$ {\chi }_{m}^{2} $ and the number of data points involved in the$ {\chi }^{2} $ -analysis,$ \upsilon $ , are displayed inTable 2.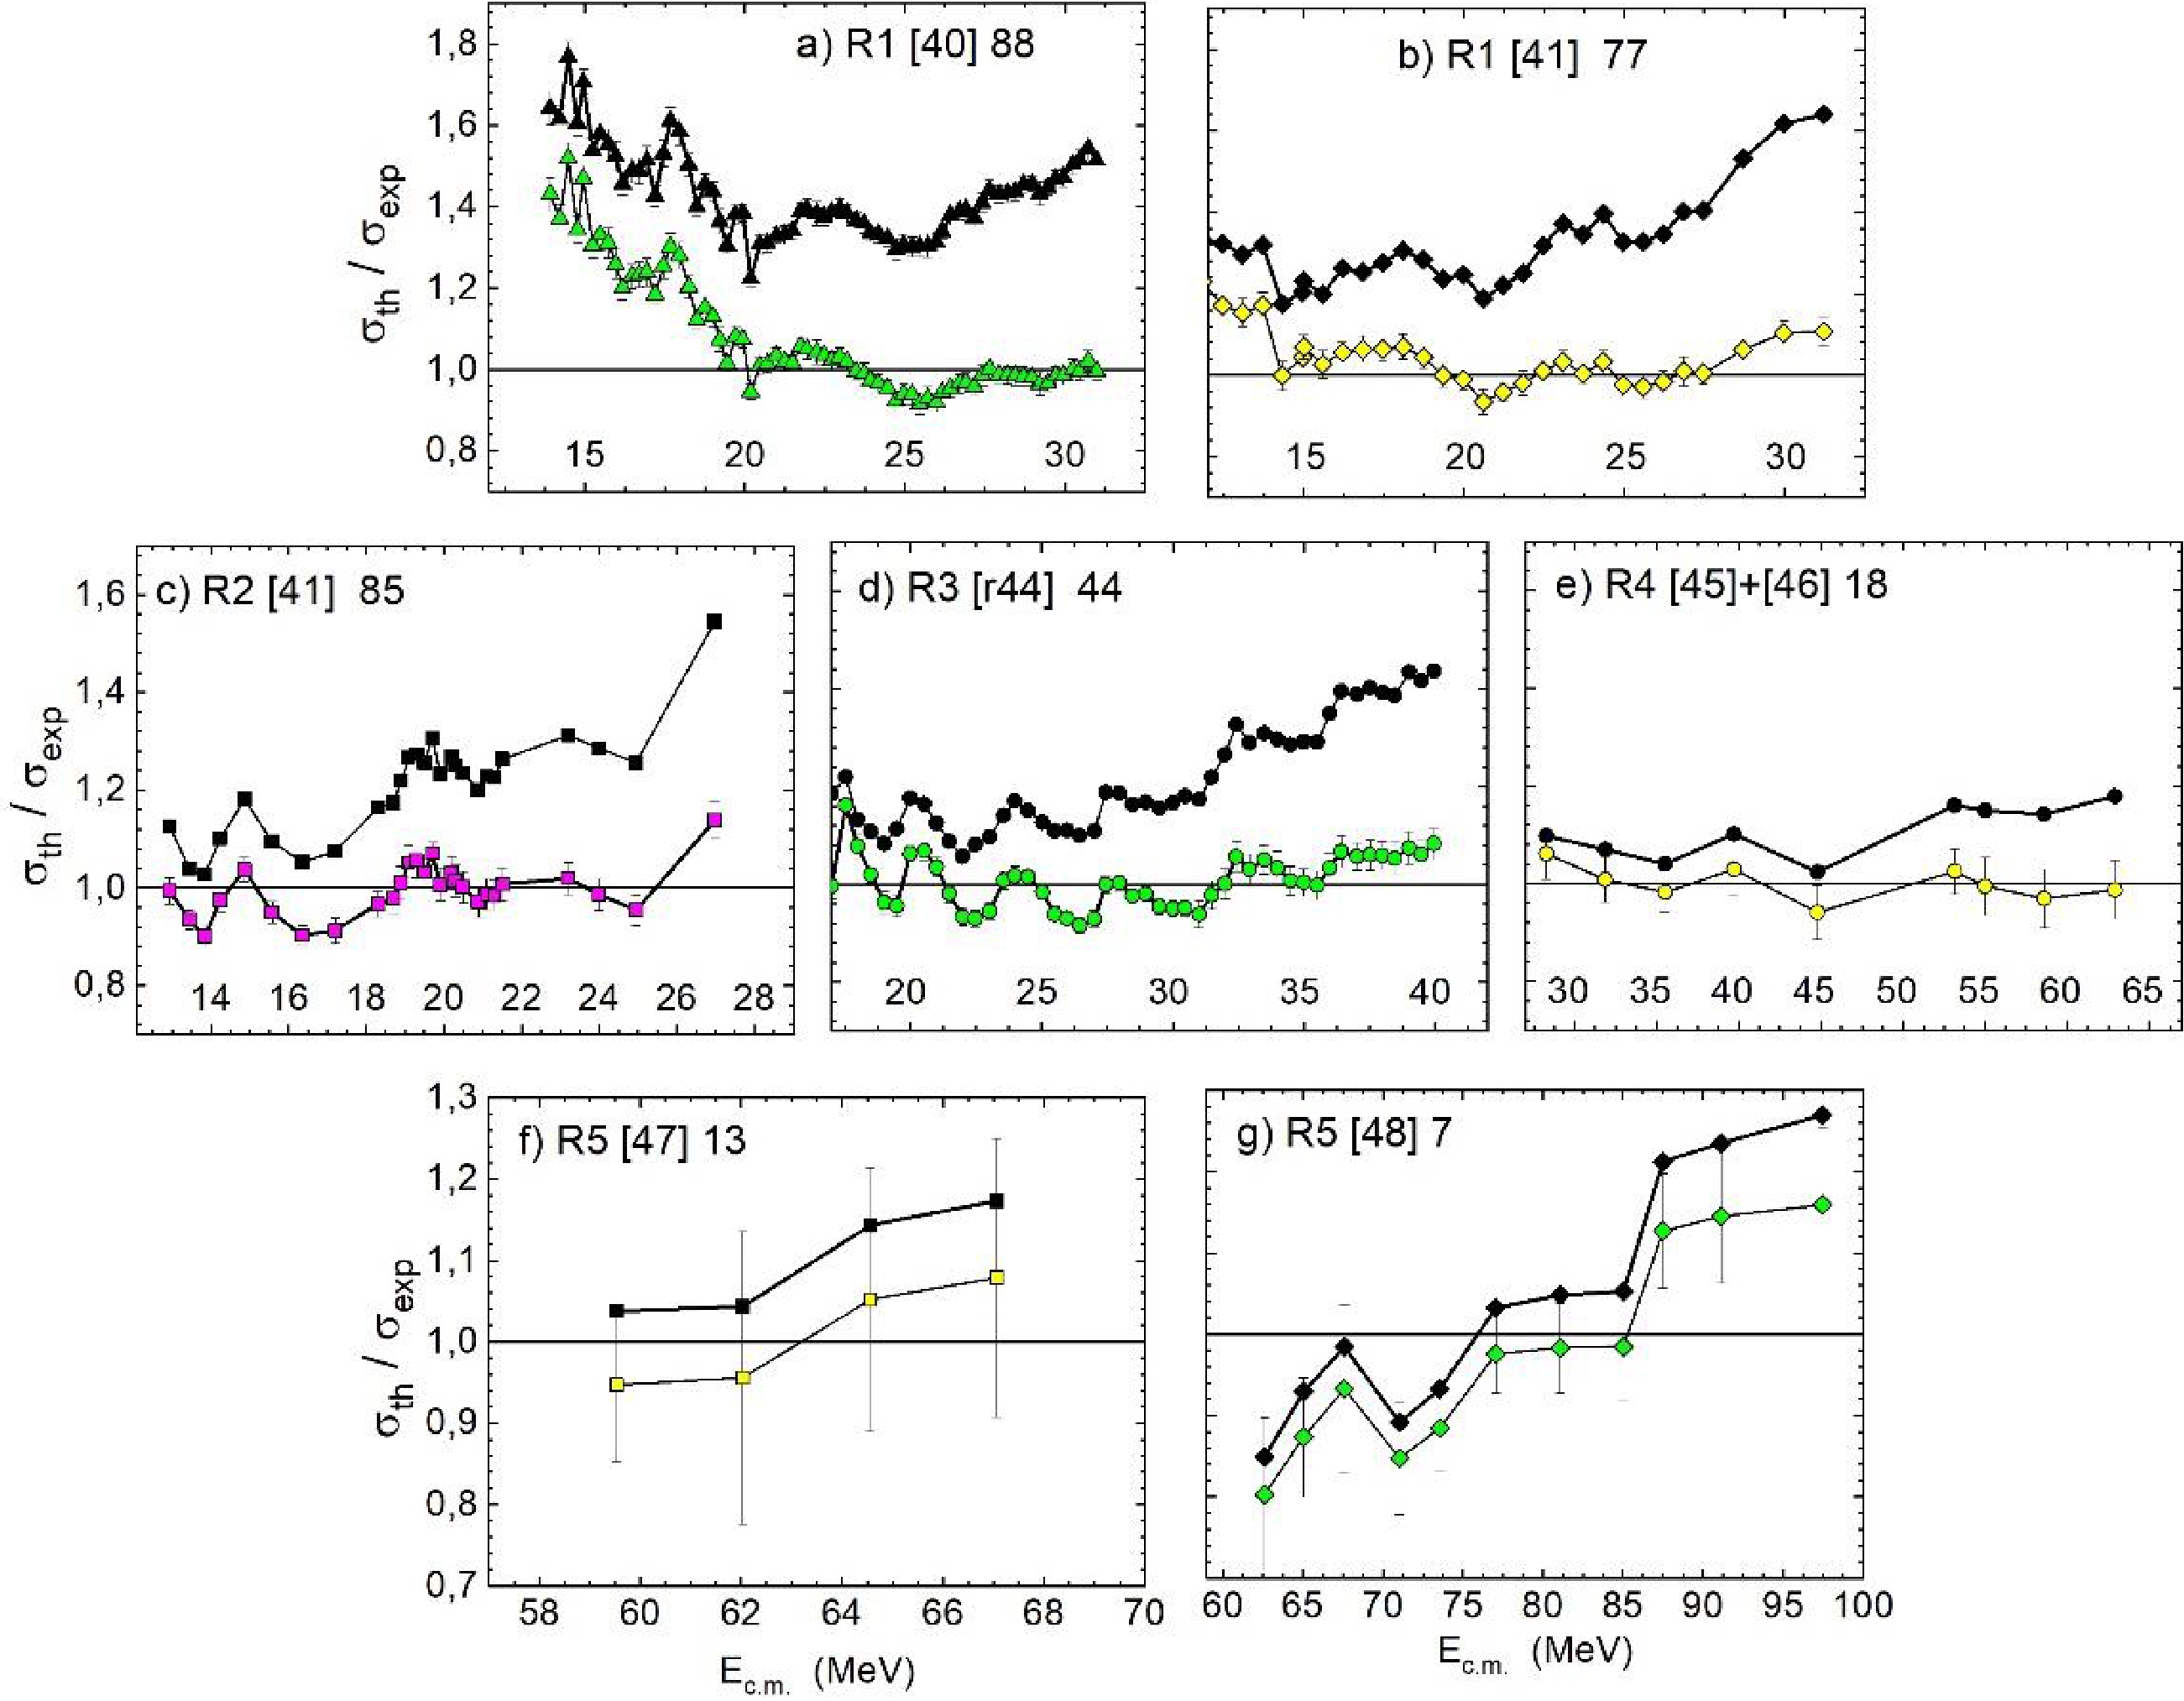
Figure 6.(color online) Ratios
${\sigma }_{\rm BPM}/{\sigma }_{\rm exp}$ (upper curves) and${\sigma }_{\rm TM}/{\sigma }_{\rm exp}$ (lower curves) versus collision energy for seven sets of data selected for detailed quantitative comparison. In each panel, the reaction number, the source of experimental data, and the values of${K}_{Rm}/(\mathrm{z}\mathrm{s}\cdot {\mathrm{G}\mathrm{e}\mathrm{V}}^{-1})$ are indicated.The quantitative results of the comparison between the TM and experiment are shown inTable 2. The TM provides a good description of the data. Note that at
${K}_{R} < 5~\mathrm{z}\mathrm{s}\cdot {\mathrm{G}\mathrm{e}\mathrm{V}}^{-1}$ , the resulting TM cross section becomes insensitive to the value of$ {K}_{R} $ , and${\sigma }_{\rm TM}$ becomes close to${\sigma }_{\rm BPM}$ .InFig. 7, we show the values of
$ {K}_{Rm} $ providing the best fit of the experimental fusion cross sections. The triangles represent the values of$ {K}_{Rm} $ obtained in Ref. [14]. In that study, the reactions with$ {B}_{Z} > 40 $ MeV were studied, and Eq. (22) was found to fit the values of$ {K}_{Rm} $ with a relative difference equal to 9.0% (this fit is shown inFig. 7by a thin black line).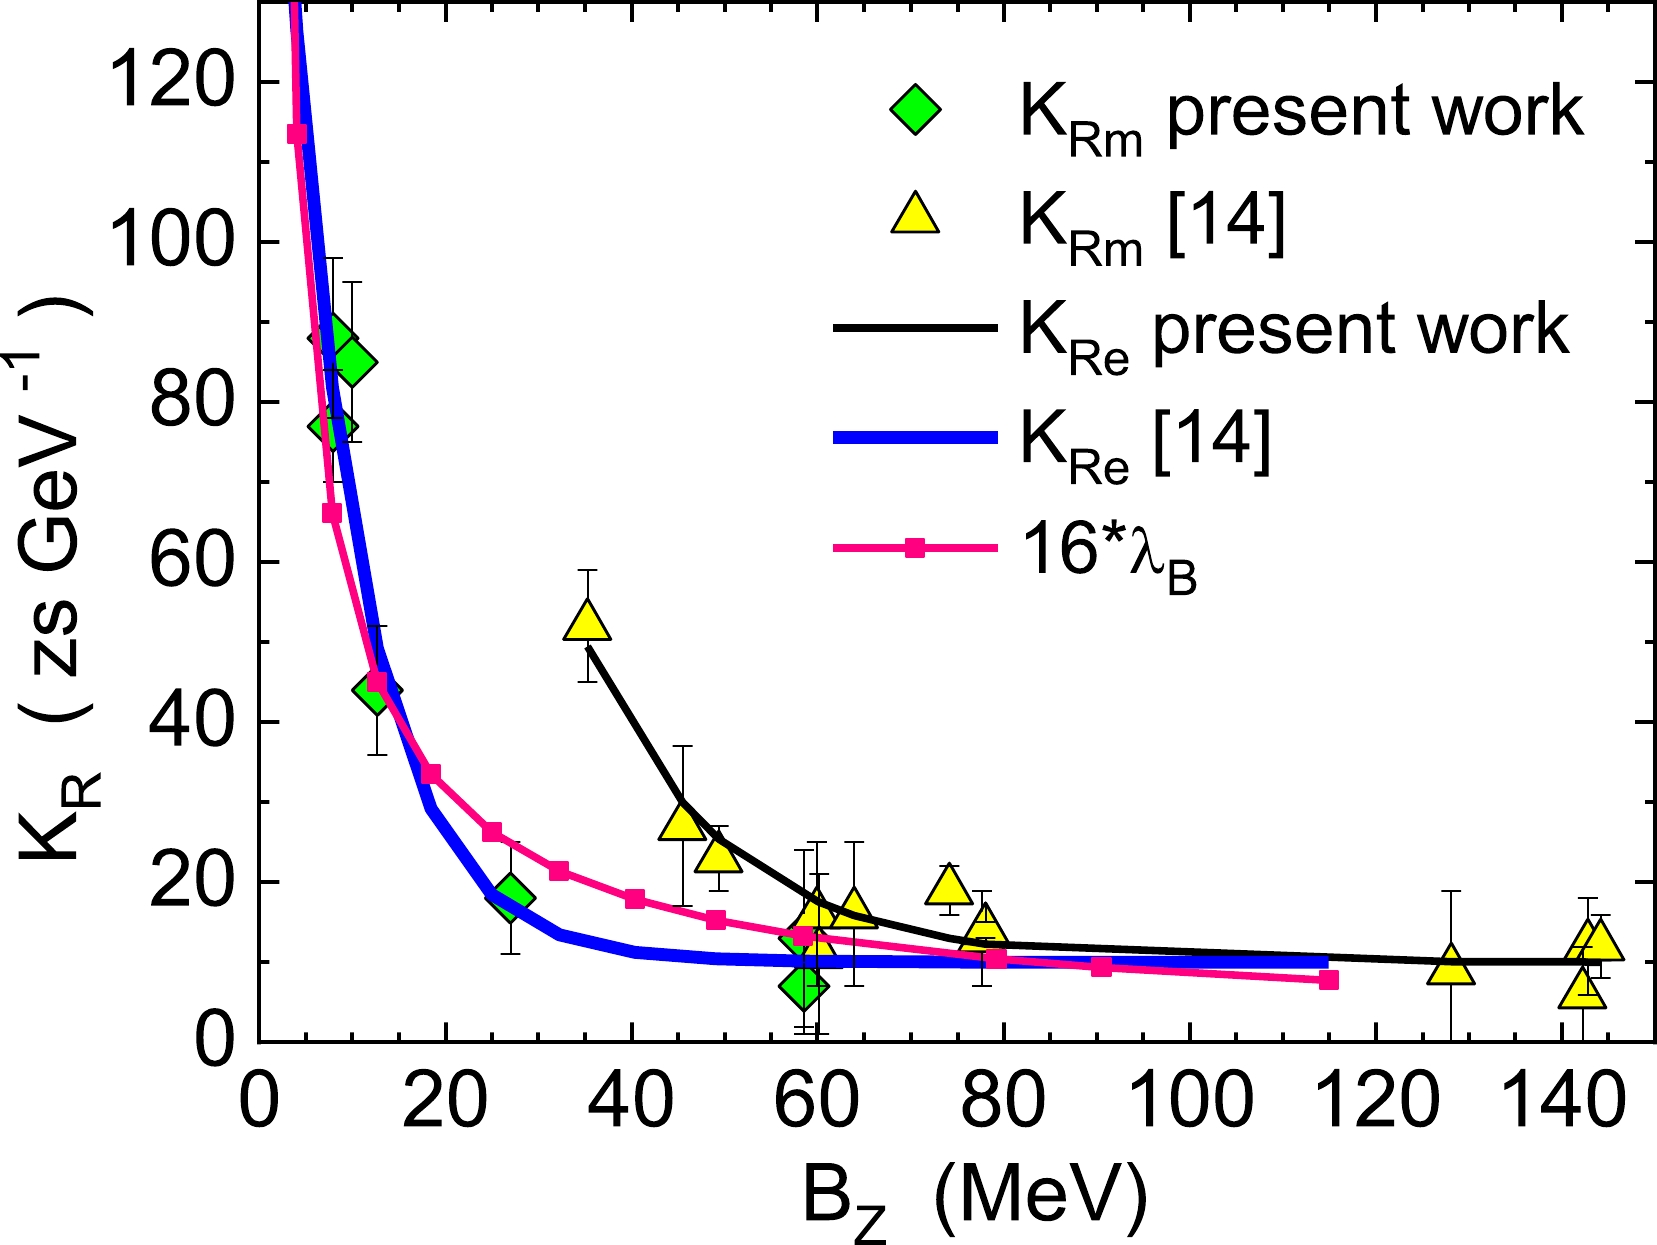
Figure 7.(color online) Values of
$ {K}_{Rm} $ obtained in [14] (triangles) and in the present study (diamonds). The lines indicate the approximations using Eq. (22) and the de Broglie wavelength multiplied by 16.Now, we have seven more values of
$ {K}_{Rm} $ between 7 and 88$\mathrm{z}\mathrm{s}\cdot {\mathrm{G}\mathrm{e}\mathrm{V}}^{-1}$ for$ {B}_{Z} < 60 $ MeV (diamonds inFig. 7). The new set of$ {K}_{Rm} $ does not overlap with those from Ref. [14] except the heaviest reaction R5,40Ca+40Ca. The values of$ {K}_{Rm} $ obtained in the present study are well approximated by Eq. (22) with the following set of coefficients:$ {K}_{1}=80 $ $\mathrm{z}\mathrm{s}\cdot {\mathrm{G}\mathrm{e}\mathrm{V}}^{-1}$ ,$ {K}_{0}=10 $ $\mathrm{z}\mathrm{s}\cdot {\mathrm{G}\mathrm{e}\mathrm{V}}^{-1}$ ,$ {B}_{0}=7 $ MeV, and$ \Delta B=8 $ MeV (thick blue line inFig. 7). Although the two curves for$ {K}_{Re} $ noticeably differ, the trend found in [14] holds: the smaller the$ {B}_{Z} $ , the larger the$ {K}_{Rm} $ . The physical meaning of this trend is still unclear.We may consider a similarity between the behavior of
$ {K}_{Rm}\left({B}_{Z}\right) $ and the de Broglie wavelength${\lambda }_{B}\left({E}_{\rm c.m.}\right)$ for the imaginary particle with reduced mass, for which Eqs. (18) and (19) are written. We calculate${\lambda }_{B}\left({E}_{\rm c.m.}\right)$ assuming$ {Z}_{1}={Z}_{2} $ ,$ {A}_{1}=2{Z}_{1}={A}_{2}=2{Z}_{2} $ , and (somewhat arbitrarily)${E}_{\rm c.m.}={B}_{Z}$ . The resulting dependence of$ 16{\lambda }_{B}\left({B}_{Z}\right) $ is shown inFig. 7by a pink curve with small boxes. It reproduces the values of$ {K}_{Rm}\left({B}_{Z}\right) $ found in this study amazingly well and suggests a way for understanding the physical reason of the$ {K}_{Rm}\left({B}_{Z}\right) $ -dependence.Approximation (22) allows us to predict the value
$ {K}_{Rm} $ =24$\mathrm{z}\mathrm{s}\cdot {\mathrm{G}\mathrm{e}\mathrm{V}}^{-1}$ for the reaction12C+40Ca, which is missing inTable 2because we did not manage to find the corresponding experimental data. Accepting the uncertainty of the predicted$ {K}_{Rm} $ to be 7$\mathrm{z}\mathrm{s}\cdot {\mathrm{G}\mathrm{e}\mathrm{V}}^{-1}$ , we obtain the cross sections shown inFig. 8.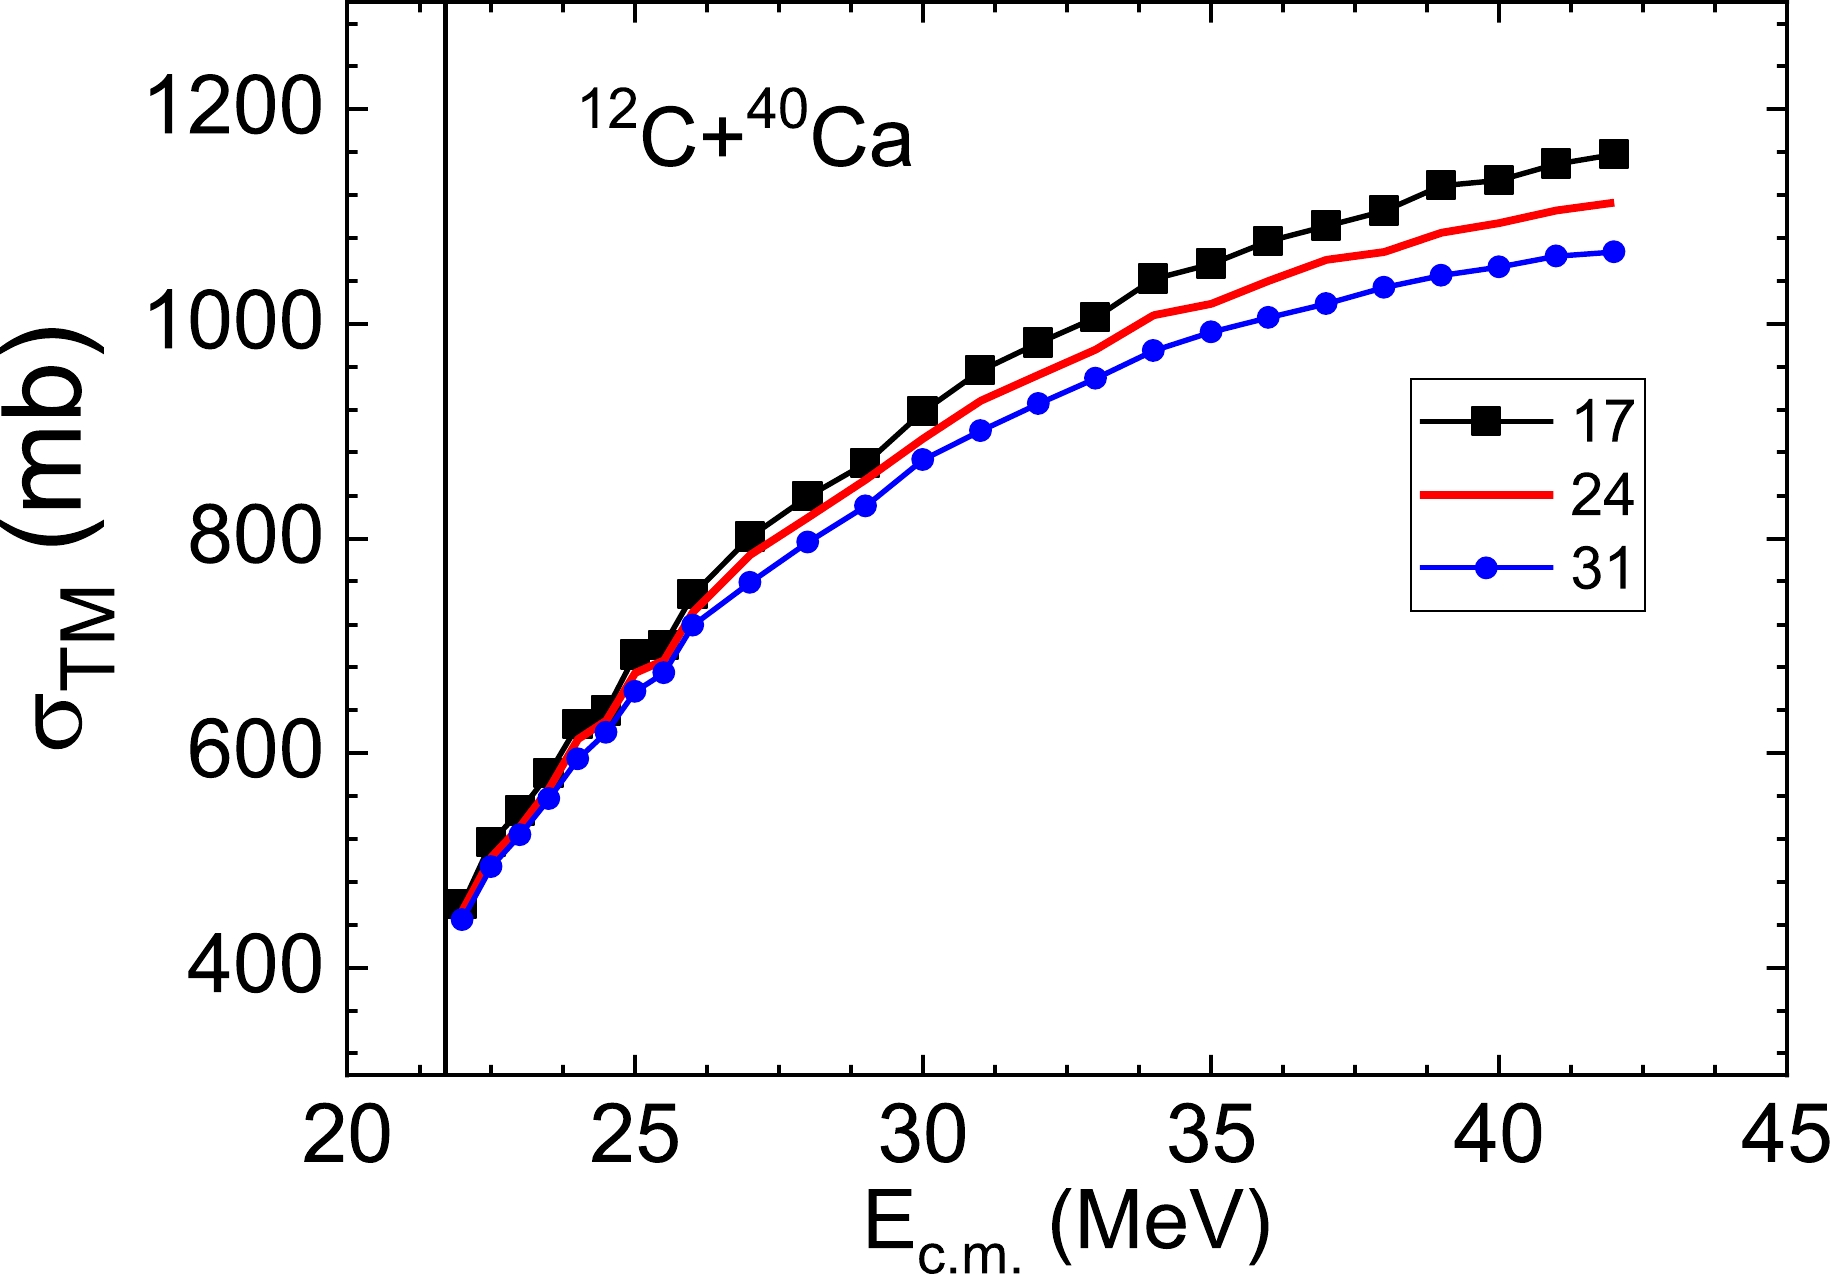
Figure 8.(color online) Predicted fusion cross sections for the reaction12C+40Ca calculated using the three values of
$ {K}_{R} $ indicated in the figure. The vertical line corresponds to${E}_{\rm cut}$ . -
One of the methods widely used to obtain the nucleus-nucleus potential is the semi-microscopical double-folding model. Proton and neutron densities are important components of such a model. The adequate ND should not only provide good a nucleus-nucleus potential but also reproduce the experimental NCD.
In this study, we aim to achieve a good description of both the NCD and above-barrier fusion cross sections of even-even spherical light nuclei with
$ Z=N $ :12C,16O, and40Ca. For this goal, we propose an approximation for the ND of these nuclei. This approximation, abbreviated as FE-density, provides a good description of the experimental NCDs.Then, we use the FE NDs to evaluate the nucleus-nucleus potential via the double-folding model with density dependent M3Y-ParisNN-forces. Next, these potentials are applied to calculate the above-barrier fusion cross sections of the reactions12C+12C,12C+16O,16O+16O,16O+40Ca, and40Ca+40Ca, where the experimental data are available. The cross sections are computed within two approaches: a) the BPM
$ {\sigma }_{\rm BPM} $ and b) the dynamical TM$ {\sigma }_{\rm TM} $ . In the latter case, the transmission coefficients are found using Langevin-type equations.For all considered reactions,
${\sigma }_{\rm BPM}$ always exceeds${\sigma }_{\rm exp}$ . We believe this is a hint that at above-barrier energies, dissipation plays a significant role in collision process, thus requiring a dynamical model [32]. Our trajectory model reproduces the above-barrier experimental cross sections within 10%−15%. The only adjustable parameter of this model, the optimal friction strength$ {K}_{Rm} $ , is found to be approximately 90$\mathrm{z}\mathrm{s}\cdot {\mathrm{G}\mathrm{e}\mathrm{V}}^{-1}$ for the light reactions12C+12C,12C+16O, and16O+16O and approximately 15$\mathrm{z}\mathrm{s}\cdot {\mathrm{G}\mathrm{e}\mathrm{V}}^{-1}$ for the heavier reactions16O+40Ca and40Ca+40Ca. This result does not strongly contradict the systematics found previously in Ref. [14]. Next, we readjust the coefficients of Eq. (22) to build the approximation for the values of friction strength obtained in the present study. Finally, we predict the value of$ {K}_{Rm} $ and calculate the cross sections${\sigma }_{\rm TM}$ of the12C+40Ca reaction, for which the experimental data seems to be missing.Our FE-algorithm can be applied for above-barrier collisions of non-spherical nuclei with
$ Z=N $ , such as14N,22Na,32S, because it is well known that nuclear deformations do not influence the above-barrier cross sections [32]. We plan to explore this possibility in the near future.
Experimental nuclear charge density and theoretical description of the above-barrier light heavy-ion fusion process
- Received Date:2023-02-19
- Available Online:2023-08-15
Abstract:Theoretical modeling of nucleus-nucleus collisions is often based on the nucleus-nucleus potential. One of the advanced methods for constructing this potential is the semi-microscopical double-folding model with M3Y-Paris NN-forces. Proton and neutron densities are significant components of this model. The correct nucleon density (ND) must reproduce the experimental nuclear charge density (NCD). However, those who deal with modeling the fusion process typically disregard this circumstance. We aim to achieve a good description of both the nuclear charge density and above-barrier fusion cross sections of even-even light nuclei with


 DownLoad: