


 Abstract
 HTML
HTML Reference
 Related
 PDF
PDF


-
Tungsten is a very important potential structural component of fusion reactors. Therefore, accurate and reliable cross sections for performing 14 MeV neutron induced nuclear reactions on this element are important for the design of such reactors. These cross sections for 14 MeV neutron induced nuclear reactions on tungsten isotopes have been studied by many researchers and can be found in the experimental nuclear reaction data (EXFOR) library [1]. However, for the183W(n,α)180mHf reaction, the experimental cross-section data induced by neutrons from the D-T reaction were obtained by only two experimental groups [2-4], and the experimental results were reported in 2016 and 2003, respectively [2,3]. There are remarkable differences in those data at the corresponding energies, with a maximum difference given by a factor greater than 4. For the186W(n,d*)185Ta[(n,d*) = (n,d)+(n,n+p)] reaction, the experimental cross-section data induced by neutrons were obtained only by three experimental groups [4-6], and all of them have only one cross-section value at a single neutron energy. These data were also very different, with the maximum difference given by a factor of 8. For the182W(n,p)182Ta reaction (which is the sum of the182W(n,p)182gTa,182W(n,p)182m1Ta, and182W(n,p)182m2reactions), experimental cross-section data around the neutron energy of 14 MeV were obtained by eight experimental groups [2-4,7-12], and one of them reported their experimental results in 2016 and 2003 [2,3]. These experimental data are also significantly different, with the maximum difference being greater than 45%. For the184W(n,p)184Ta reaction, experimental cross-section data around the neutron energy of 14 MeV were obtained by eleven experimental groups [2-4,6,8-11,13-17], and one of them reported their experimental results in 2016, 2003. and 1999 [2,3,13]. These experimental data are also hugely different, with the maximum difference given by a factor greater than 4. For the182W(n,2n)181W,184W(n,α)181Hf, and186W(n,α)183Hf reactions, experimental cross-section data around the neutron energy of 14 MeV were obtained by seven [4,10,12,18-21], six [2-3,9,11,12,22], and nine [2-4,6,9-11,15,16,22] experimental groups, respectively. These experimental data are also different, with the maximum difference given by a factor greater than 2, greater than 28%, and a factor greater than 4, respectively. Furthermore, there are also differences in the cross-section evaluation data of the above-mentioned nuclear reactions in the neutron energy range from the threshold to 20 MeV given by several major libraries of the International Atomic Energy Agency (IAEA) [23]. Consequently, it is necessary to perform further measurements for the cross-sections of the above mentioned reactions on tungsten isotopes around the neutron energy of 14 MeV and provide their excitation curves by using the nuclear theoretical model program TALYS-1.9 [24]. In this study, the cross sections of the183W(n,α)180mHf,186W(n,d*)185Ta,182W(n,p)182Ta,184W(n,p)184Ta,182W(n,2n)181W,184W(n,α)181Hf, and186W(n,α)183Hf reactions were measured in the neutron energy range of 13.5–14.8 MeV via the activation technique. Excitation curves of the seven above-mentioned nuclear reactions were calculated in the neutron energy range from the threshold to 20 MeV by adopting the nuclear theoretical model program TALYS-1.9 with the relevant parameters properly adjusted. The experimental data obtained were analyzed and compared with that of previous experiments conducted by other researchers and with the evaluated data available in the five major evaluated nuclear data libraries of IAEA, namely ENDF/B-VIII.0 (USA, 2018) or ENDF/B-VII.0 (USA, 2006) [25], JEFF-3.3 (Europe, 2017) [26], JENDL-4.0u+ (Japan, 2016) [27], CENDL-3.2 (China, 2020) [28], and BROND-3.1 (Russia, 2016) or ROSFOND-2010 (Russia, 2010) [29], as well as with the theoretical values acquired through TALYS-1.9.
-
The nuclear reaction cross sections studied were measured by identifying the radioactive products. The details were described in several publications [30-33]. Here, we mention only a few salient features relevant to the present measurements.
Natural tungsten foils of 3.01–3.14 mm thickness and 99.95% purity were made into round foils of 20 mm diameter. Monitor foils (natural niobium foils, each 1 mm in thickness, 99.95% purity) of the same diameter as the tungsten sample were attached in front of and behind each tungsten sample, which was wrapped in a pure cadmium foil (1 mm in thickness, 99.95% purity) to reduce the effect of the180W(n,γ)181W reaction induced by thermal neutrons on the182W(n,2n)181W reaction.
Irradiations with 13.5–14.8 MeV neutrons were performed at the neutron generator of the K-400 Neutron Generator at China Academy of Engineering Physics (CAEP). Monoenergetic neutrons around 14 MeV were produced via the T(d,n)4He reaction on a solid Ti-T target. The characteristics of this neutron source have been described earlier [32-34]. The samples were placed at different angles (0°, 45°, 90°, 135°) relative to the deuteron beam direction (which result in different averaged neutron energies within different samples), at a distance of 40–50 mm from the center of the T-Ti target. The duration of irradiation varied between 6.4 h and 8.2 h. The neutron energies in the measurements were determined beforehand from the cross section ratios of90Zr(n,2n)89m+gZr to93Nb(n,2n)92mNb reactions [35].
The activation products were identified by gamma-ray counting and checking their half-lives. The activities of92mNb from the irradiated monitor foils and the activities of180mHf,181Hf,185Ta,181W,182Ta,183Ta,184Ta, and183Hf from the irradiated samples were measured by a well-calibrated GEM-60P coaxial HPGe ORTEC detector made in USA (crystal diameter 70.1 mm, crystal length 72.3 mm) with a relative efficiency of 68% and an energy resolution of 1.69 keV at 1332 keV for60Co. The efficiency of the detector was pre-calibrated using a selected set of gamma-ray standard sources, which were241Am,57Co,60Co,109Cd,133Ba,137Cs,152Eu, and226Ra. The samples were placed directly at a distance of 9 cm away from the end cap of the detector.
-
The decay data (used in quantitative assay of the activity) of the products and the natural abundance of the target isotopes under investigation are summarized inTable 1[36]. The natural abundance of93Nb was taken from Ref. [37].
Reaction Abundance of target isotope (%) Reaction product Half-life Eγ/keV Iγ(%) 183W(n,α) 14.31±0.04 180mHf 5.53±0.02 h 443.16 81.7±2.5 186W(n,d*) 28.43±0.19 185Ta 49.4±1.5 min 177.59 25.7±1.0 182W(n,p) 26.50±0.16 182Ta 114.74±0.12 d 1121.29 35.24 184W(n,p) 30.64±0.02 184Ta 8.7±0.1 h 414.01 72 182W(n,2n) 26.50±0.16 181W 121.2 ±0.2 d 152.32 0.083±0.003 184W(n,α) 30.64±0.02 181Hf 42.39 ±0.06 d 345.93 15.12±0.12 186W(n,α) 28.43±0.19 183Hf 1.018±0.002 h 783.73 65.5±1.9 93Nb(n,2n) 100 92mNb 10.15±0.02 d 934.44 99.15 Table 1.Reactions and associated decay data of activation products.
Calculations of the measured cross-sections were performed using the formula described in Refs. [34,38,39]. The cross-section data of the monitor reaction93Nb(n,2n)92mNb are 457.9± 6.8, 459.8 ± 6.8, 459.8 ± 6.8 and 459.7 ± 5.0 mb at the neutron energies of 13.5, 14.1, 14.4, and 14.8 MeV, respectively [40].
Activation cross sections measured through identification of the activation products via gamma-ray spectrometry are given inTables 2–8and charted inFigs. 1–7. Previously obtained experimental cross sections of these nuclear reactions around the neutron energy of 14 MeV are also summed up inTables 2–8and charted inFigs. 1–7for comparison. The evaluation cross-section curves of these reactions mentioned above from BROND-3.1, ENDF/B-VIII.0, and JEFF-3.3 are also charted inFigs. 1–7for comparison.
Reaction This work Literature Values En/MeV σ/mb En/MeV σ/mb Reference 183W(n,α)180mHf 13.5±0.3 0.025±0.002 13.64 0.025±0.005 [2] 14.1±0.2 0.031±0.002 13.88 0.033±0.007 [2] 14.4±0.3 0.038±0.003 14.28 0.039±0.010 [2] 14.8±0.2 0.067±0.004 14.47 0.06±0.013 [2] 14.68 0.047±0.014 [2] 14.82 0.071±0.013 [2] 14.5 0.053±0.006 [3] 14.7 0.22±0.03 [4] Table 2.Summary of cross-section measurements of the183W(n,α)180mHf reaction.
Table 3.Summary of cross-section measurements of the186W(n,d*)185Ta reaction.
Reaction This work Literature Values En/MeV σ/mb En/MeV σ/mb Reference 182W(n,p)182Ta 13.5±0.3 3.26±0.17 8.96 0.043±0.003 [7] 14.1±0.2 4.14±0.21 12.47 0.793±0.06 [7] 14.4±0.3 4.76±0.23 16.63 4.092±0.28 [7] 14.8±0.2 5.53±0.27 13.64 3.344±0.299 [2] 13.88 4.056±0.702 [2] 14.28 4.767±0.254 [2] 14.47 4.355±0.897 [2] 14.68 5.348±0.496 [2] 14.82 5.785±0.335 [2] 13.5 2.07±0.14 [8] Continued on next page Table 4.Summary of cross-section measurements of the182W(n,p)182Ta reaction.
Reaction This work Literature Values En/MeV σ/mb En/MeV σ/mb Reference 184W(n,p)184Ta 13.5±0.3 1.53±0.07 13.48 1.4±0.09 [2] 14.1±0.2 1.88±0.09 13.64 1.6±0.10 [2] 14.4±0.3 2.32±0.10 13.88 1.86±0.12 [2] 14.8±0.2 3.06±0.14 14.05 2.15±0.16 [2] 14.28 2.39±0.14 [2] 14.47 2.73±0.14 [2] 14.68 3.03±0.15 [2] 14.84 3.23±0.16 [2] 13.5 1.72±0.09 [8] 14.4 3.07±0.15 [8] 14.7 3.15±0.17 [8] 14.8 3.58±0.2 [9] 16.1 5.85±0.43 [9] 17 7.25±0.56 [9] 18 8.12±0.63 [9] 19 9.36±0.77 [9] 19.3 9.93±0.77 [9] 20.5 10.58±0.91 [9] 14.5 2.86±0.16 [3] 14.1 2.14±0.1 [13] 13.5 1.65±0.08 [10] Continued on next page Table 5.Summary of cross-section measurements of the184W(n,p)184Ta reaction.
Reaction This work Literature Values En/MeV σ/mb En/MeV σ/mb Reference 182W(n,2n)181W 13.5±0.3 1965±128 13.5 2050±70 [10] 14.4±0.3 2150±137 13.7 2065±73 [10] 14.8±0.2 2167±142 14.2 2115±75 [10] 14.5 2110±75 [10] 14.7 2097±73 [10] 8.18 16±12 [18] 8.44 64±12 [18] 8.69 219±28 [18] 8.94 358±22 [18] 9.44 721±41 [18] 9.93 1144±60 [18] 10.42 1366±70 [18] 10.91 1582±80 [18] 11.88 1790±127 [18] Continued on next page Table 6.Summary of cross-section measurements of the182W(n,2n)181W reaction.
Reaction This work Literature Values En/MeV σ/mb En/MeV σ/mb Reference 184W(n,α)181Hf 13.5±0.3 0.46±0.04 13.64 0.495±0.043 [2] 14.1±0.2 0.58±0.04 13.88 0.484±0.042 [2] 14.4±0.3 0.79±0.05 14.28 0.701±0.032 [2] 14.8±0.2 0.93±0.06 14.47 0.639±0.100 [2] 14.68 0.819±0.045 [2] 14.82 0.85±0.044 [2] 14.8 0.96±0.09 [9] 16.3 1.48±0.11 [9] 17 1.73±0.15 [9] 18.1 2±0.2 [9] 20.5 2.24±0.2 [9] 14.5 0.75±0.03 [3] 13.4 0.56±0.09 [22] 13.65 0.56±0.09 [22] 13.88 0.67±0.09 [22] 14.28 0.79±0.11 [22] 14.58 0.87±0.12 [22] 14.87 0.91±0.12 [22] 14.6 0.85±0.09 [11] 14.7 1.15±0.15 [4] 14.1 0.65 [12] Table 7.Summary of cross-section measurements of the184W(n,α)181Hf reaction.
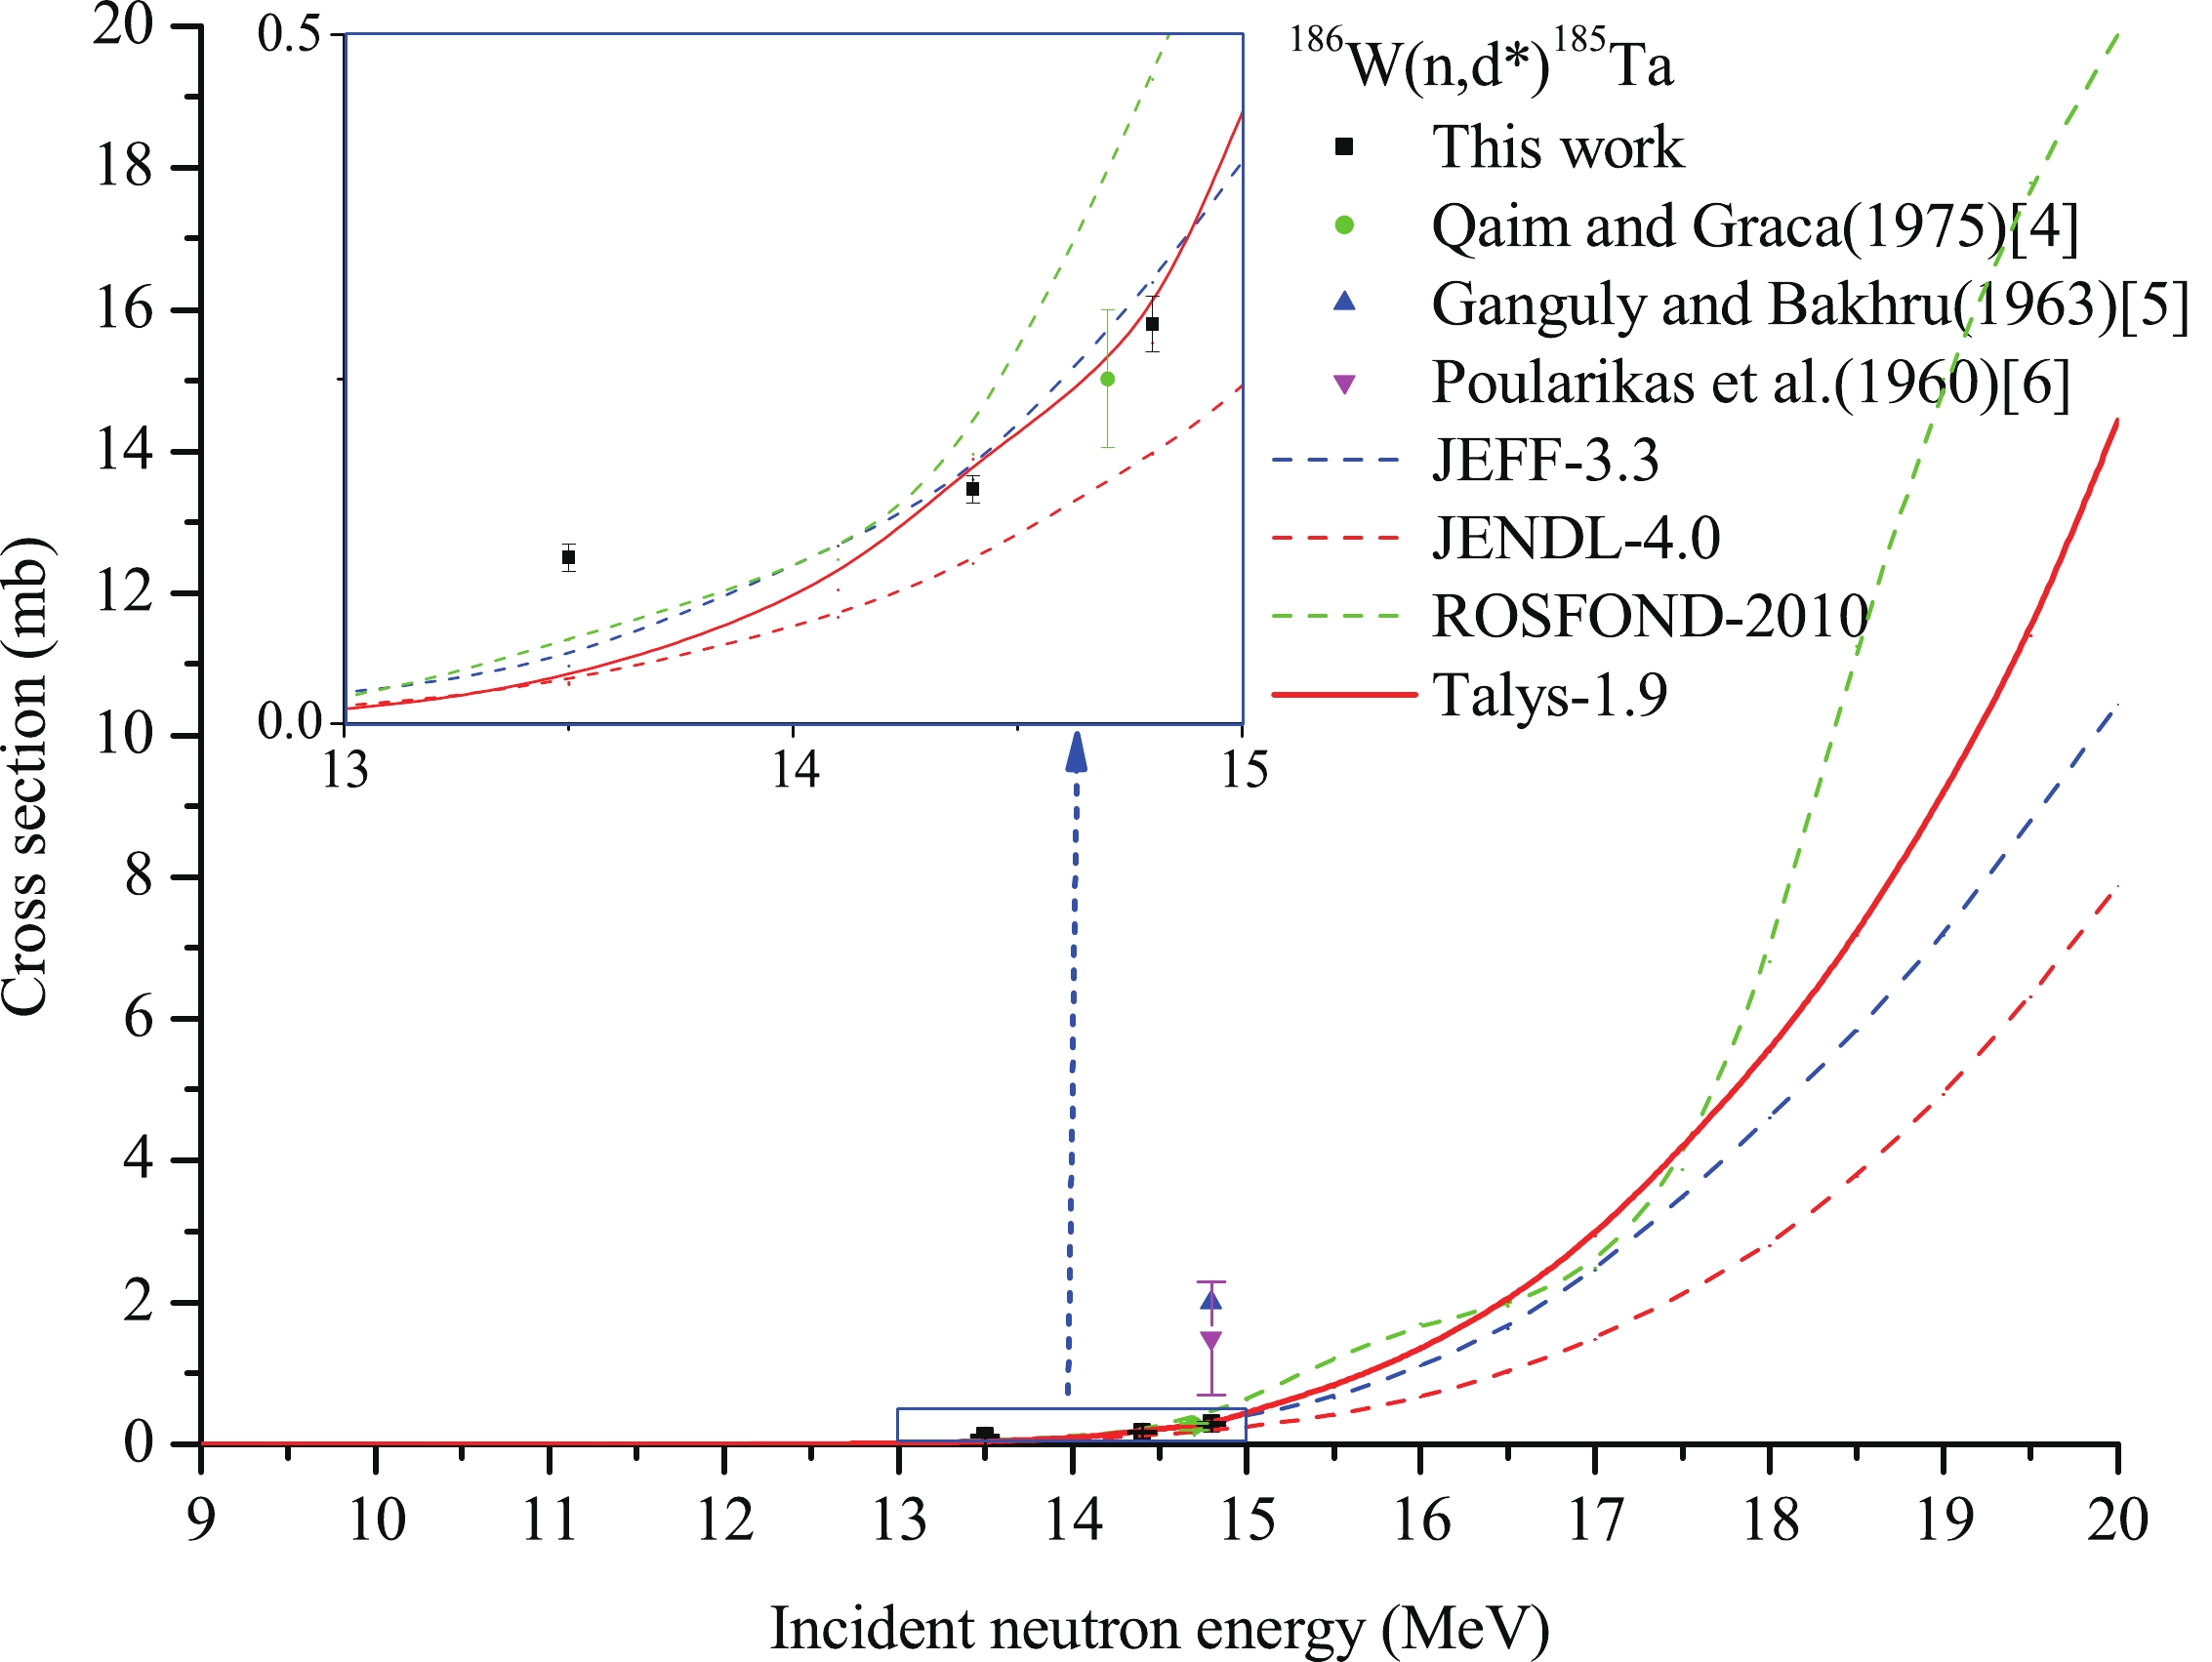
Figure 2.(color online) Cross section of186W(n,d*)185Ta reaction.
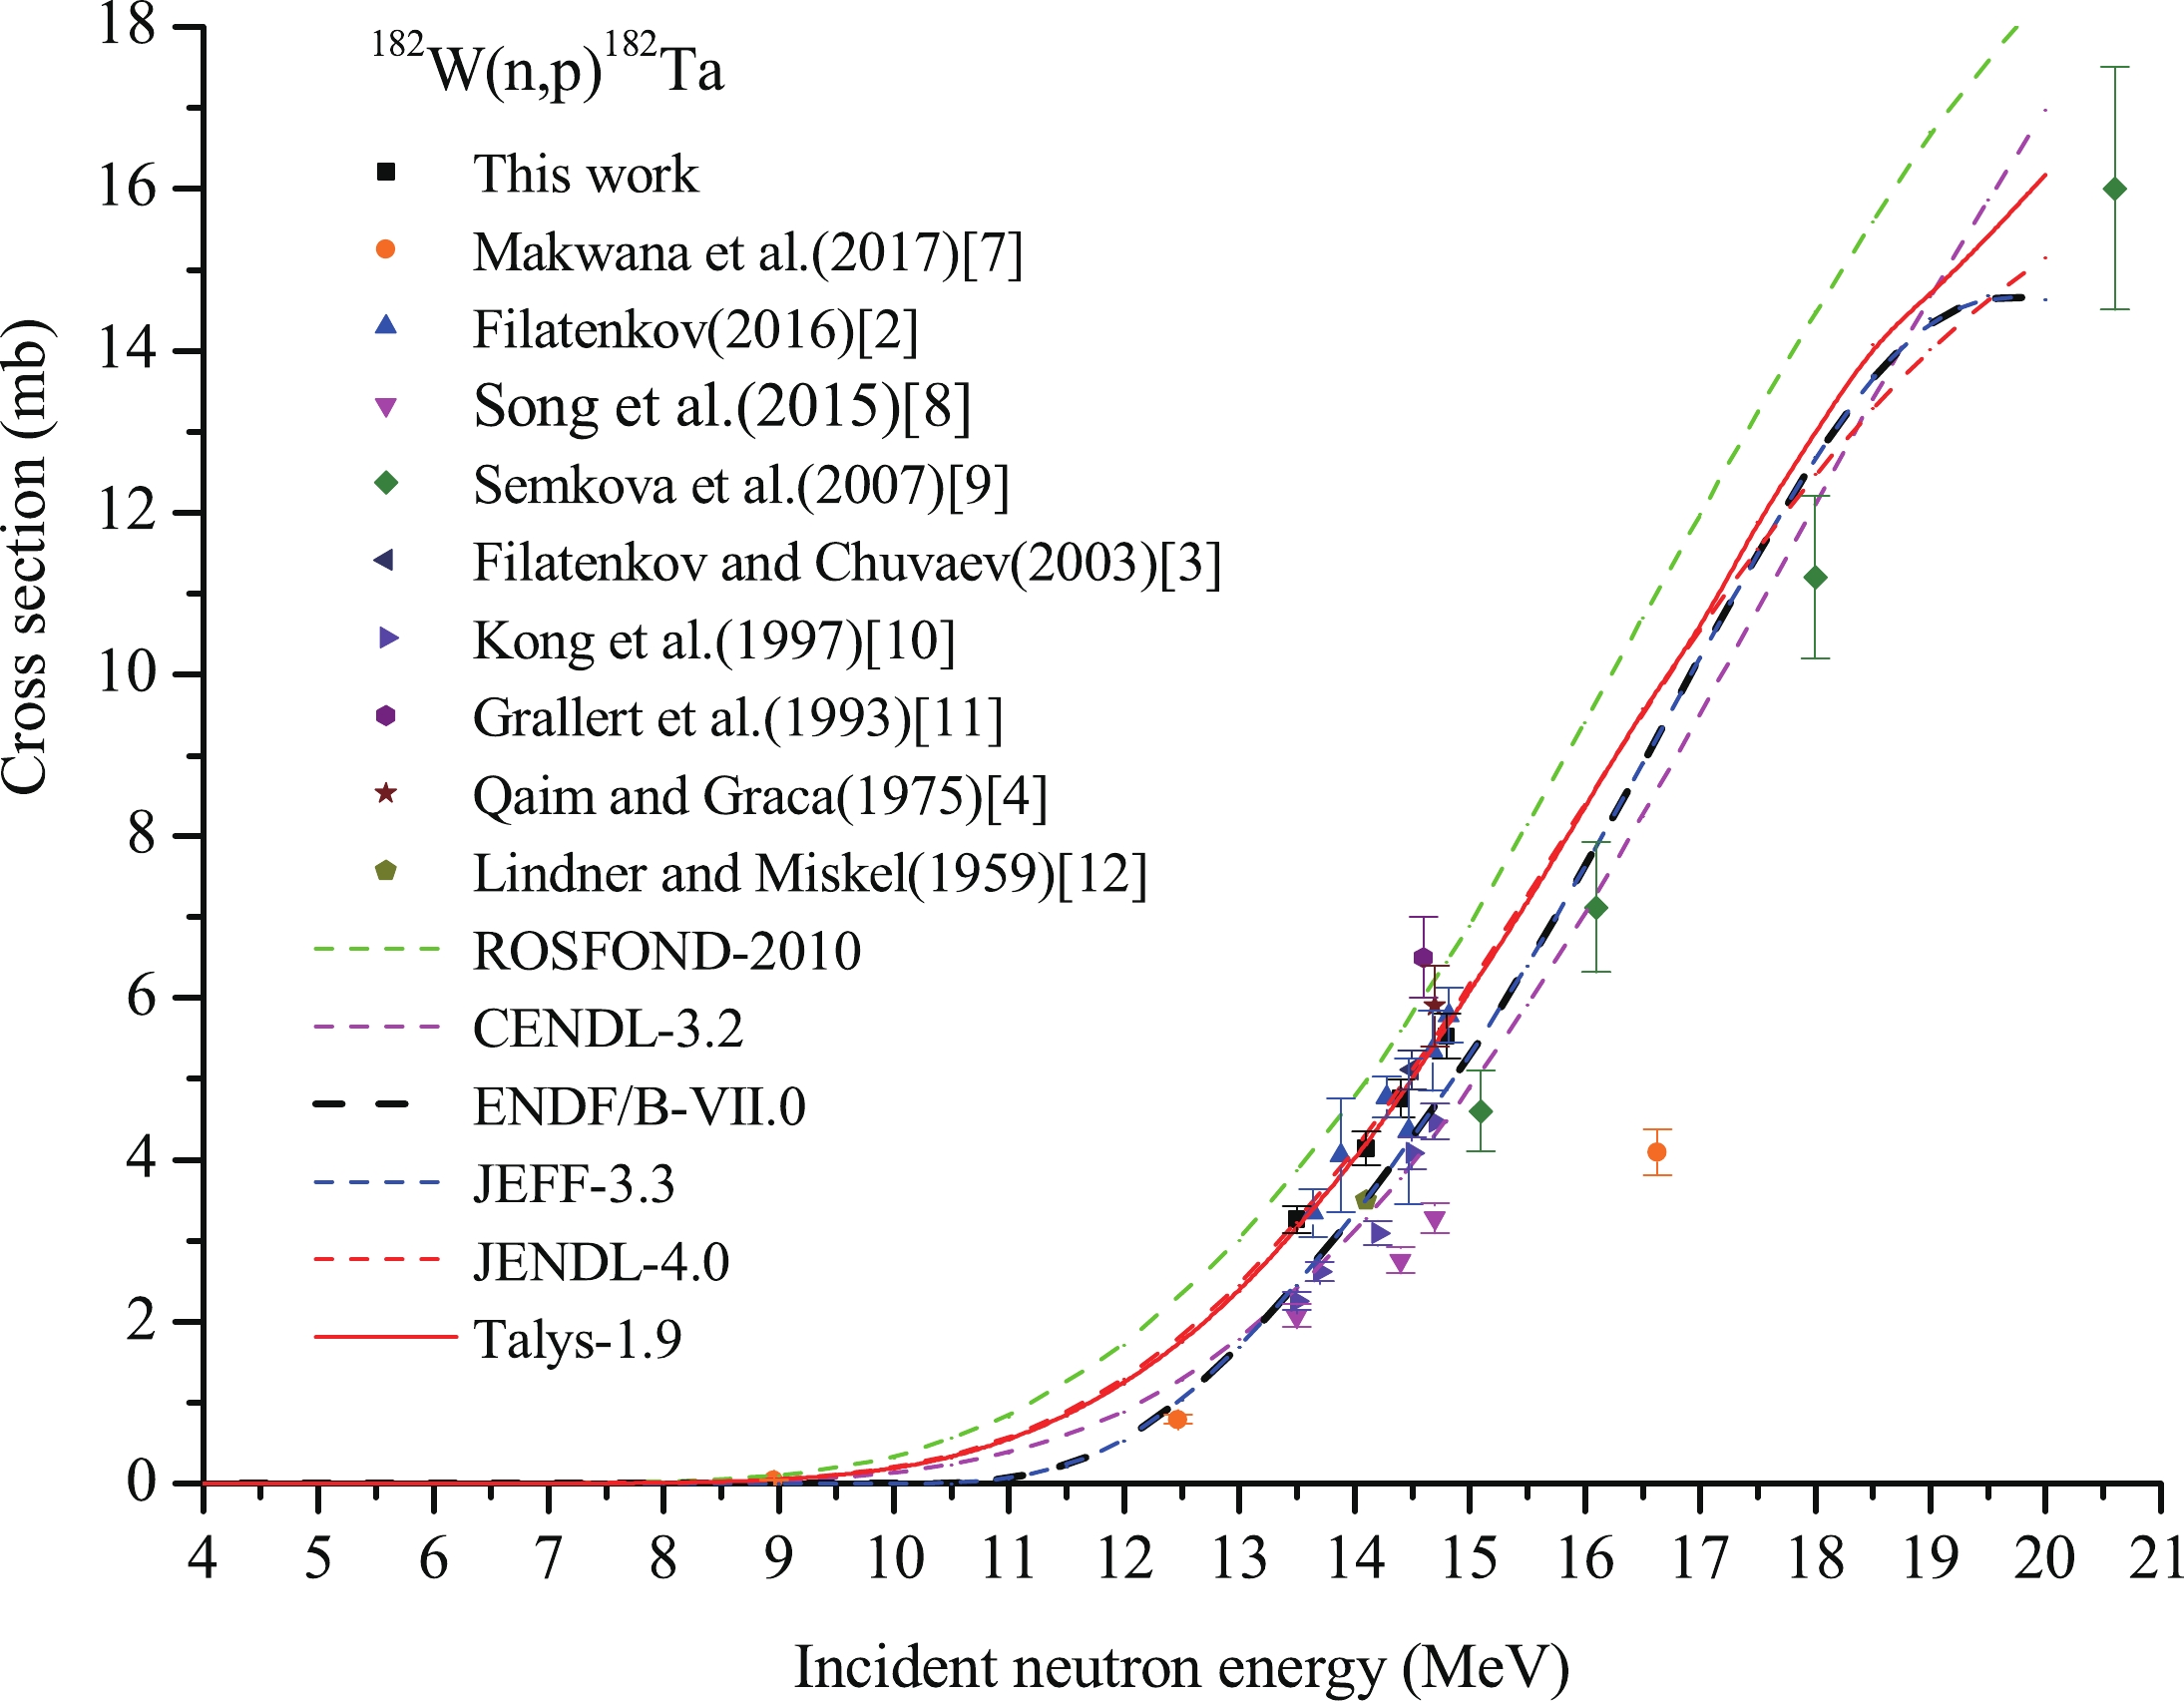
Figure 3.(color online) Cross section of182W(n,p)182Ta reaction.
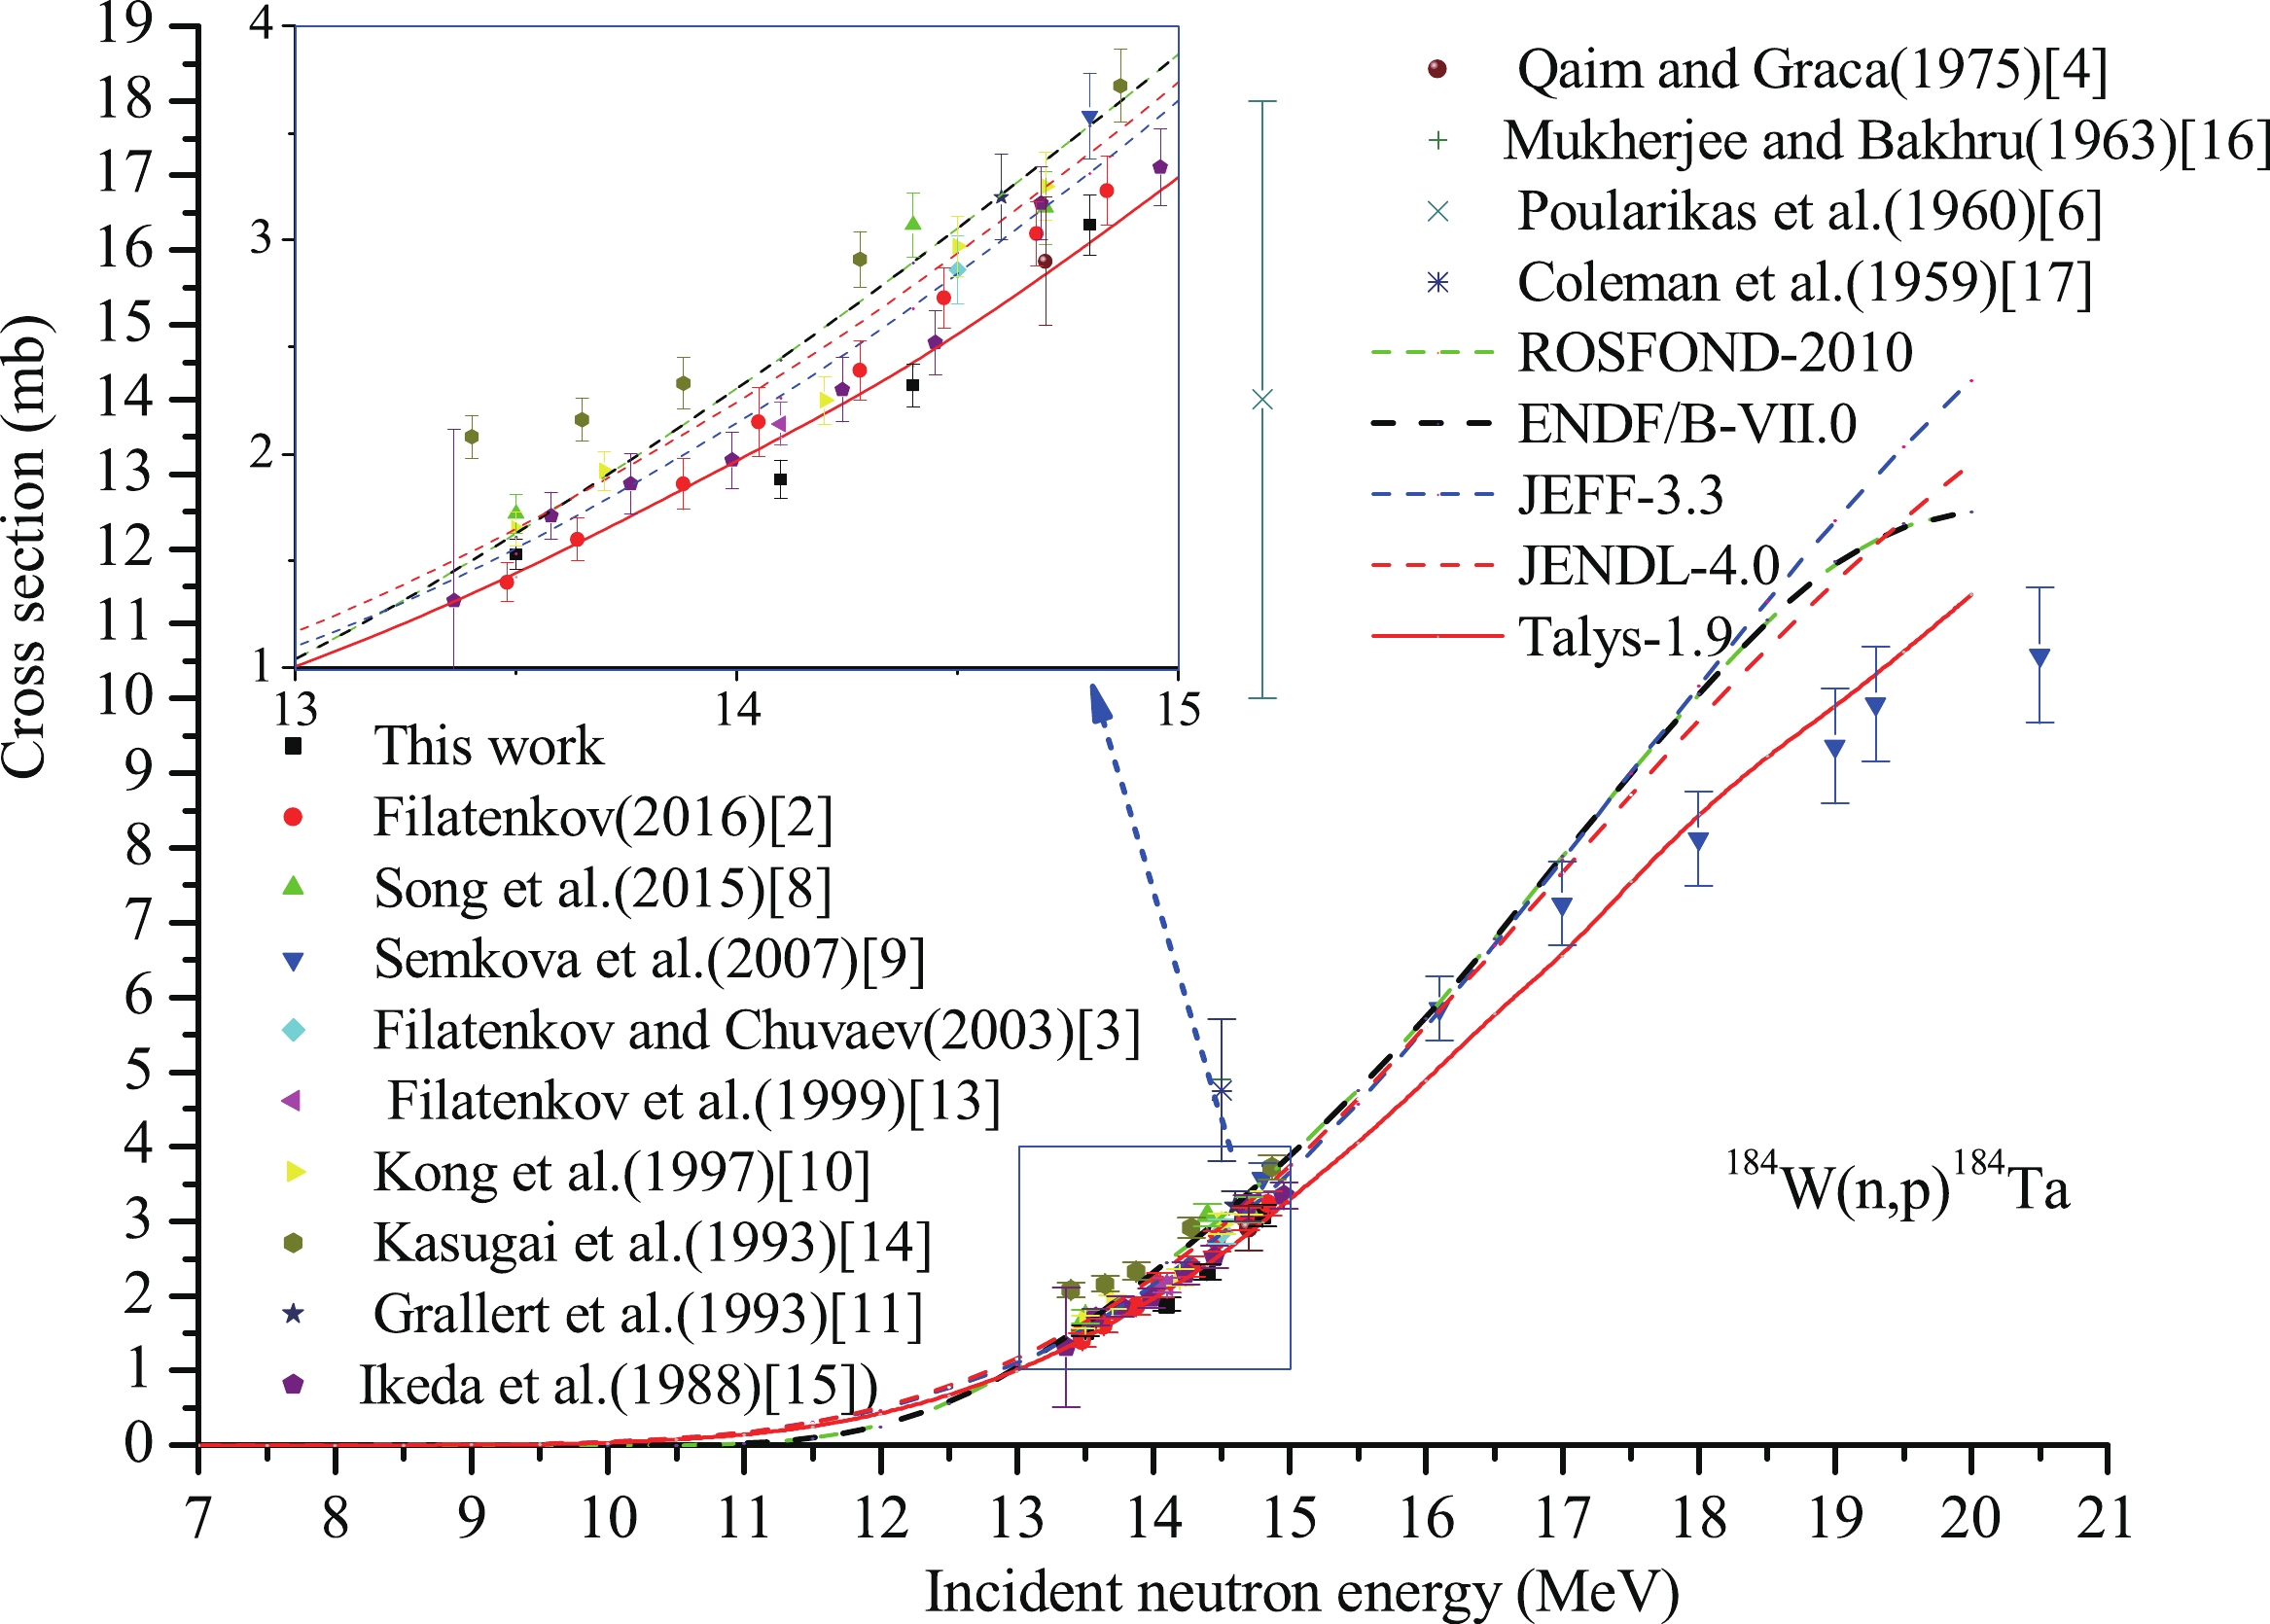
Figure 4.(color online) Cross section of184W(n,p)184Ta reaction.
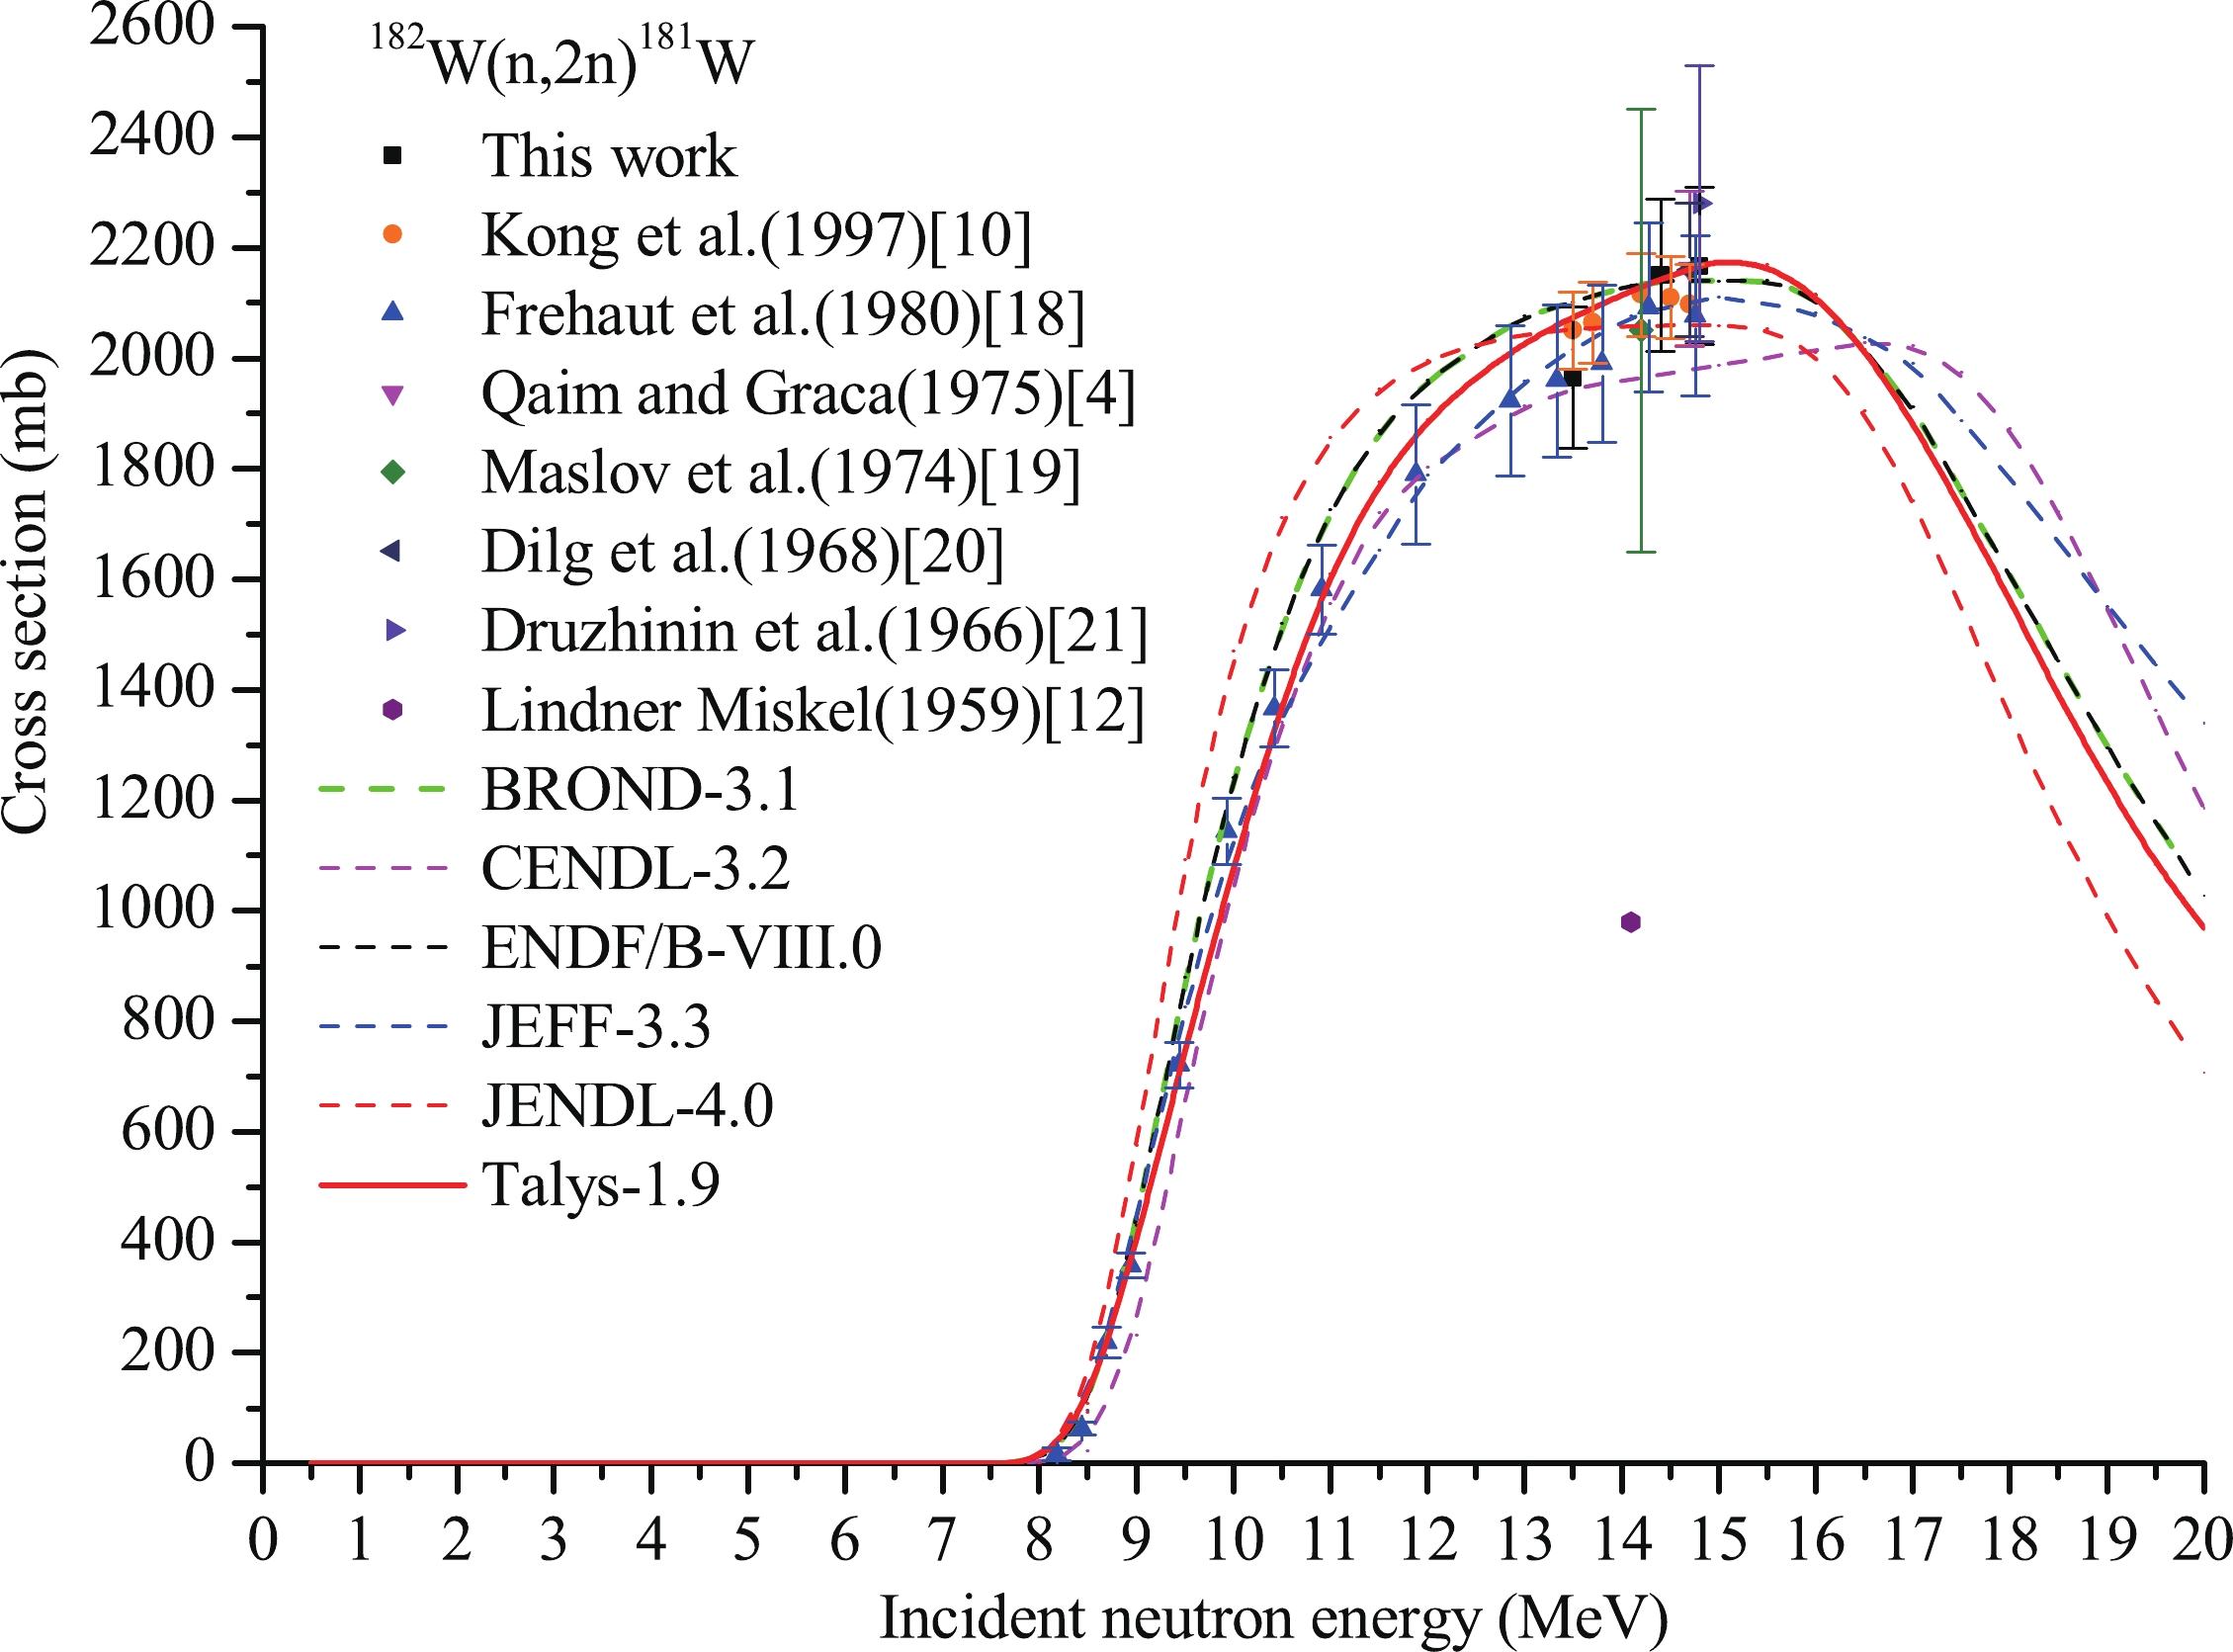
Figure 5.(color online) Cross section of182W(n,2n)181W reaction.
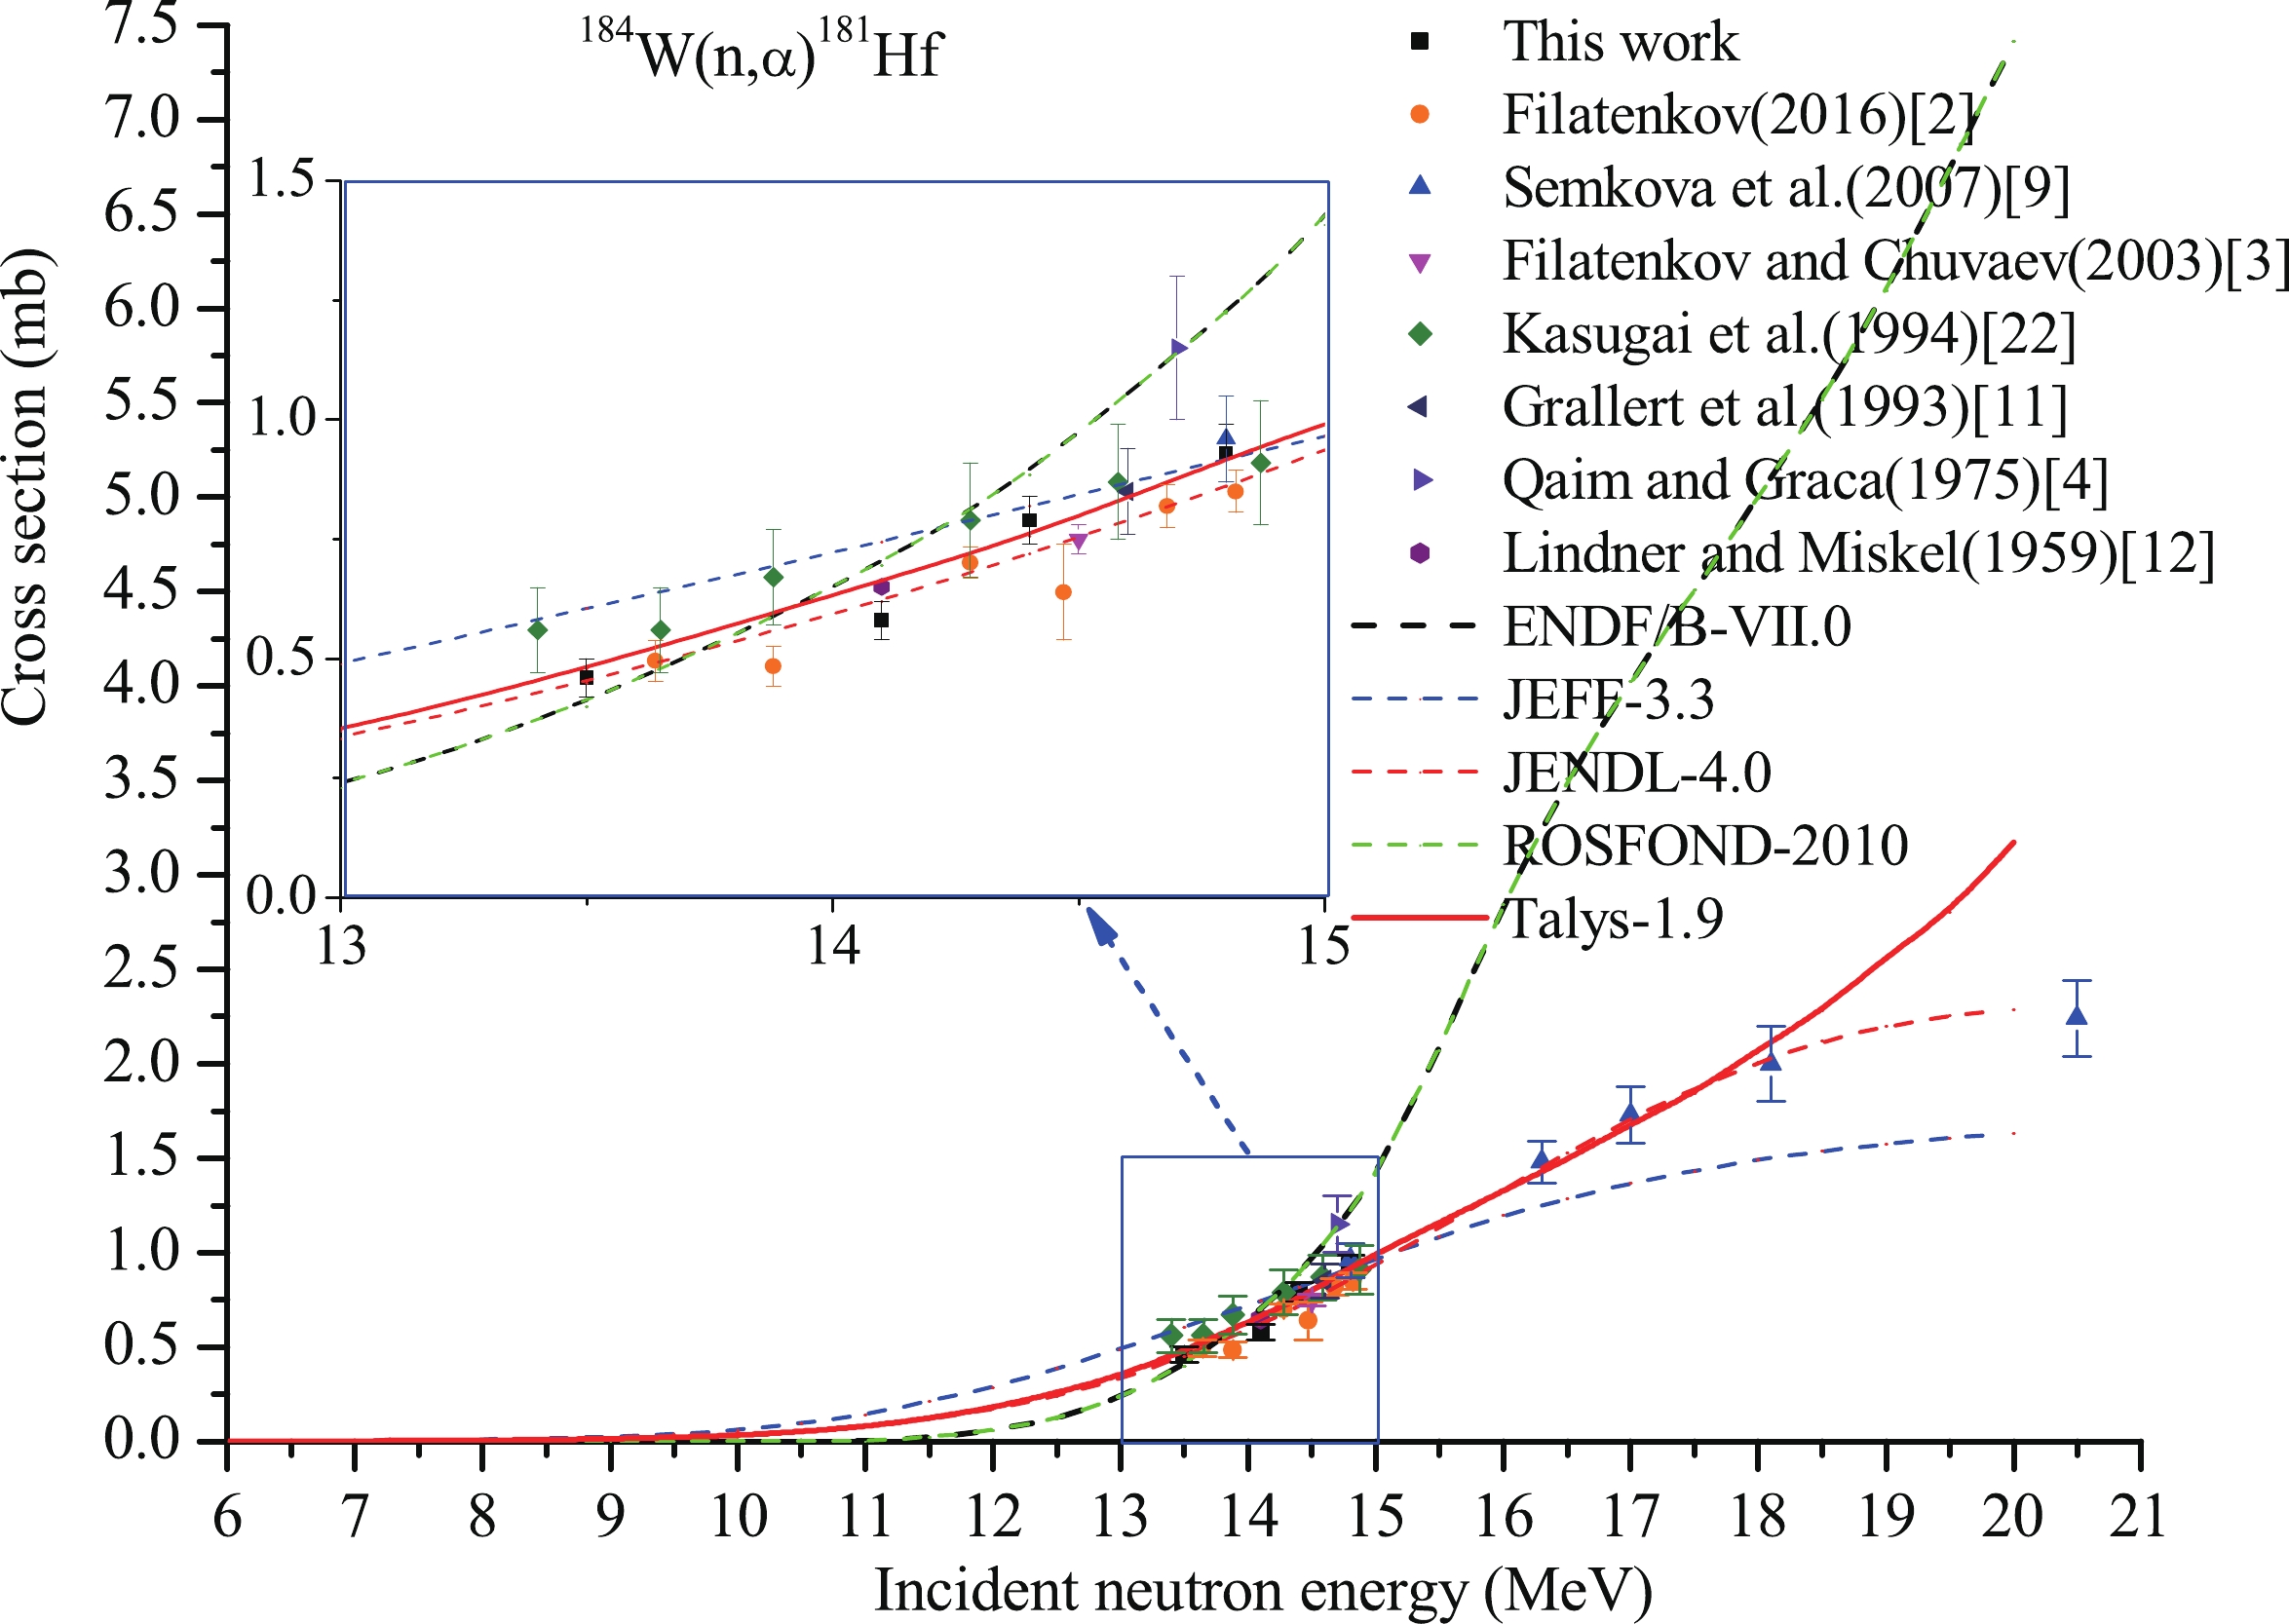
Figure 6.(color online) Cross section of184W(n,α)181Hf reaction.
Reaction This work Literature Values En/MeV σ/mb En/MeV σ/mb Reference 186W(n,α)183Hf 13.5±0.3 0.26±0.01 13.48 0.274±0.063 [2] 14.1±0.2 0.35±0.02 13.64 0.277±0.051 [2] 14.4±0.3 0.42±0.02 13.88 0.387±0.060 [2] 14.8±0.2 0.56±0.03 14.28 0.461±0.080 [2] 14.47 0.52±0.075 [2] 14.68 0.582±0.111 [2] 14.82 0.601±0.085 [2] 14.8 0.62±0.09 [9] 16.1 1.01±0.19 [9] 17 1.37±0.2 [9] 17.9 1.62±0.2 [9] 19.4 1.86±0.2 [9] 20.6 2.1±0.2 [9] 14.5 0.52±0.08 [3] 13.5 0.3±0.06 [10] 13.7 0.34±0.08 [10] 14.2 0.45±0.09 [10] 14.5 0.57±0.1 [10] 14.7 0.62±0.11 [10] 13.4 0.25±0.04 [22] 13.65 0.4±0.06 [22] 13.88 0.48±0.07 [22] 14.28 0.57±0.08 [22] 14.58 0.65±0.09 [22] 14.87 0.83±0.11 [22] 14.6 0.54±0.05 [11] 13.33 0.237±0.6 [15] 13.56 0.311±0.57 [15] 14.66 0.6±0.11 [15] 14.93 0.64±0.13 [15] 14.7 0.55±0.07 [4] 14.5 0.85 [16] 14.8 2.5±1 [6] Table 8.Summary of cross-section measurements of the186W(n,α)183Hf reaction.
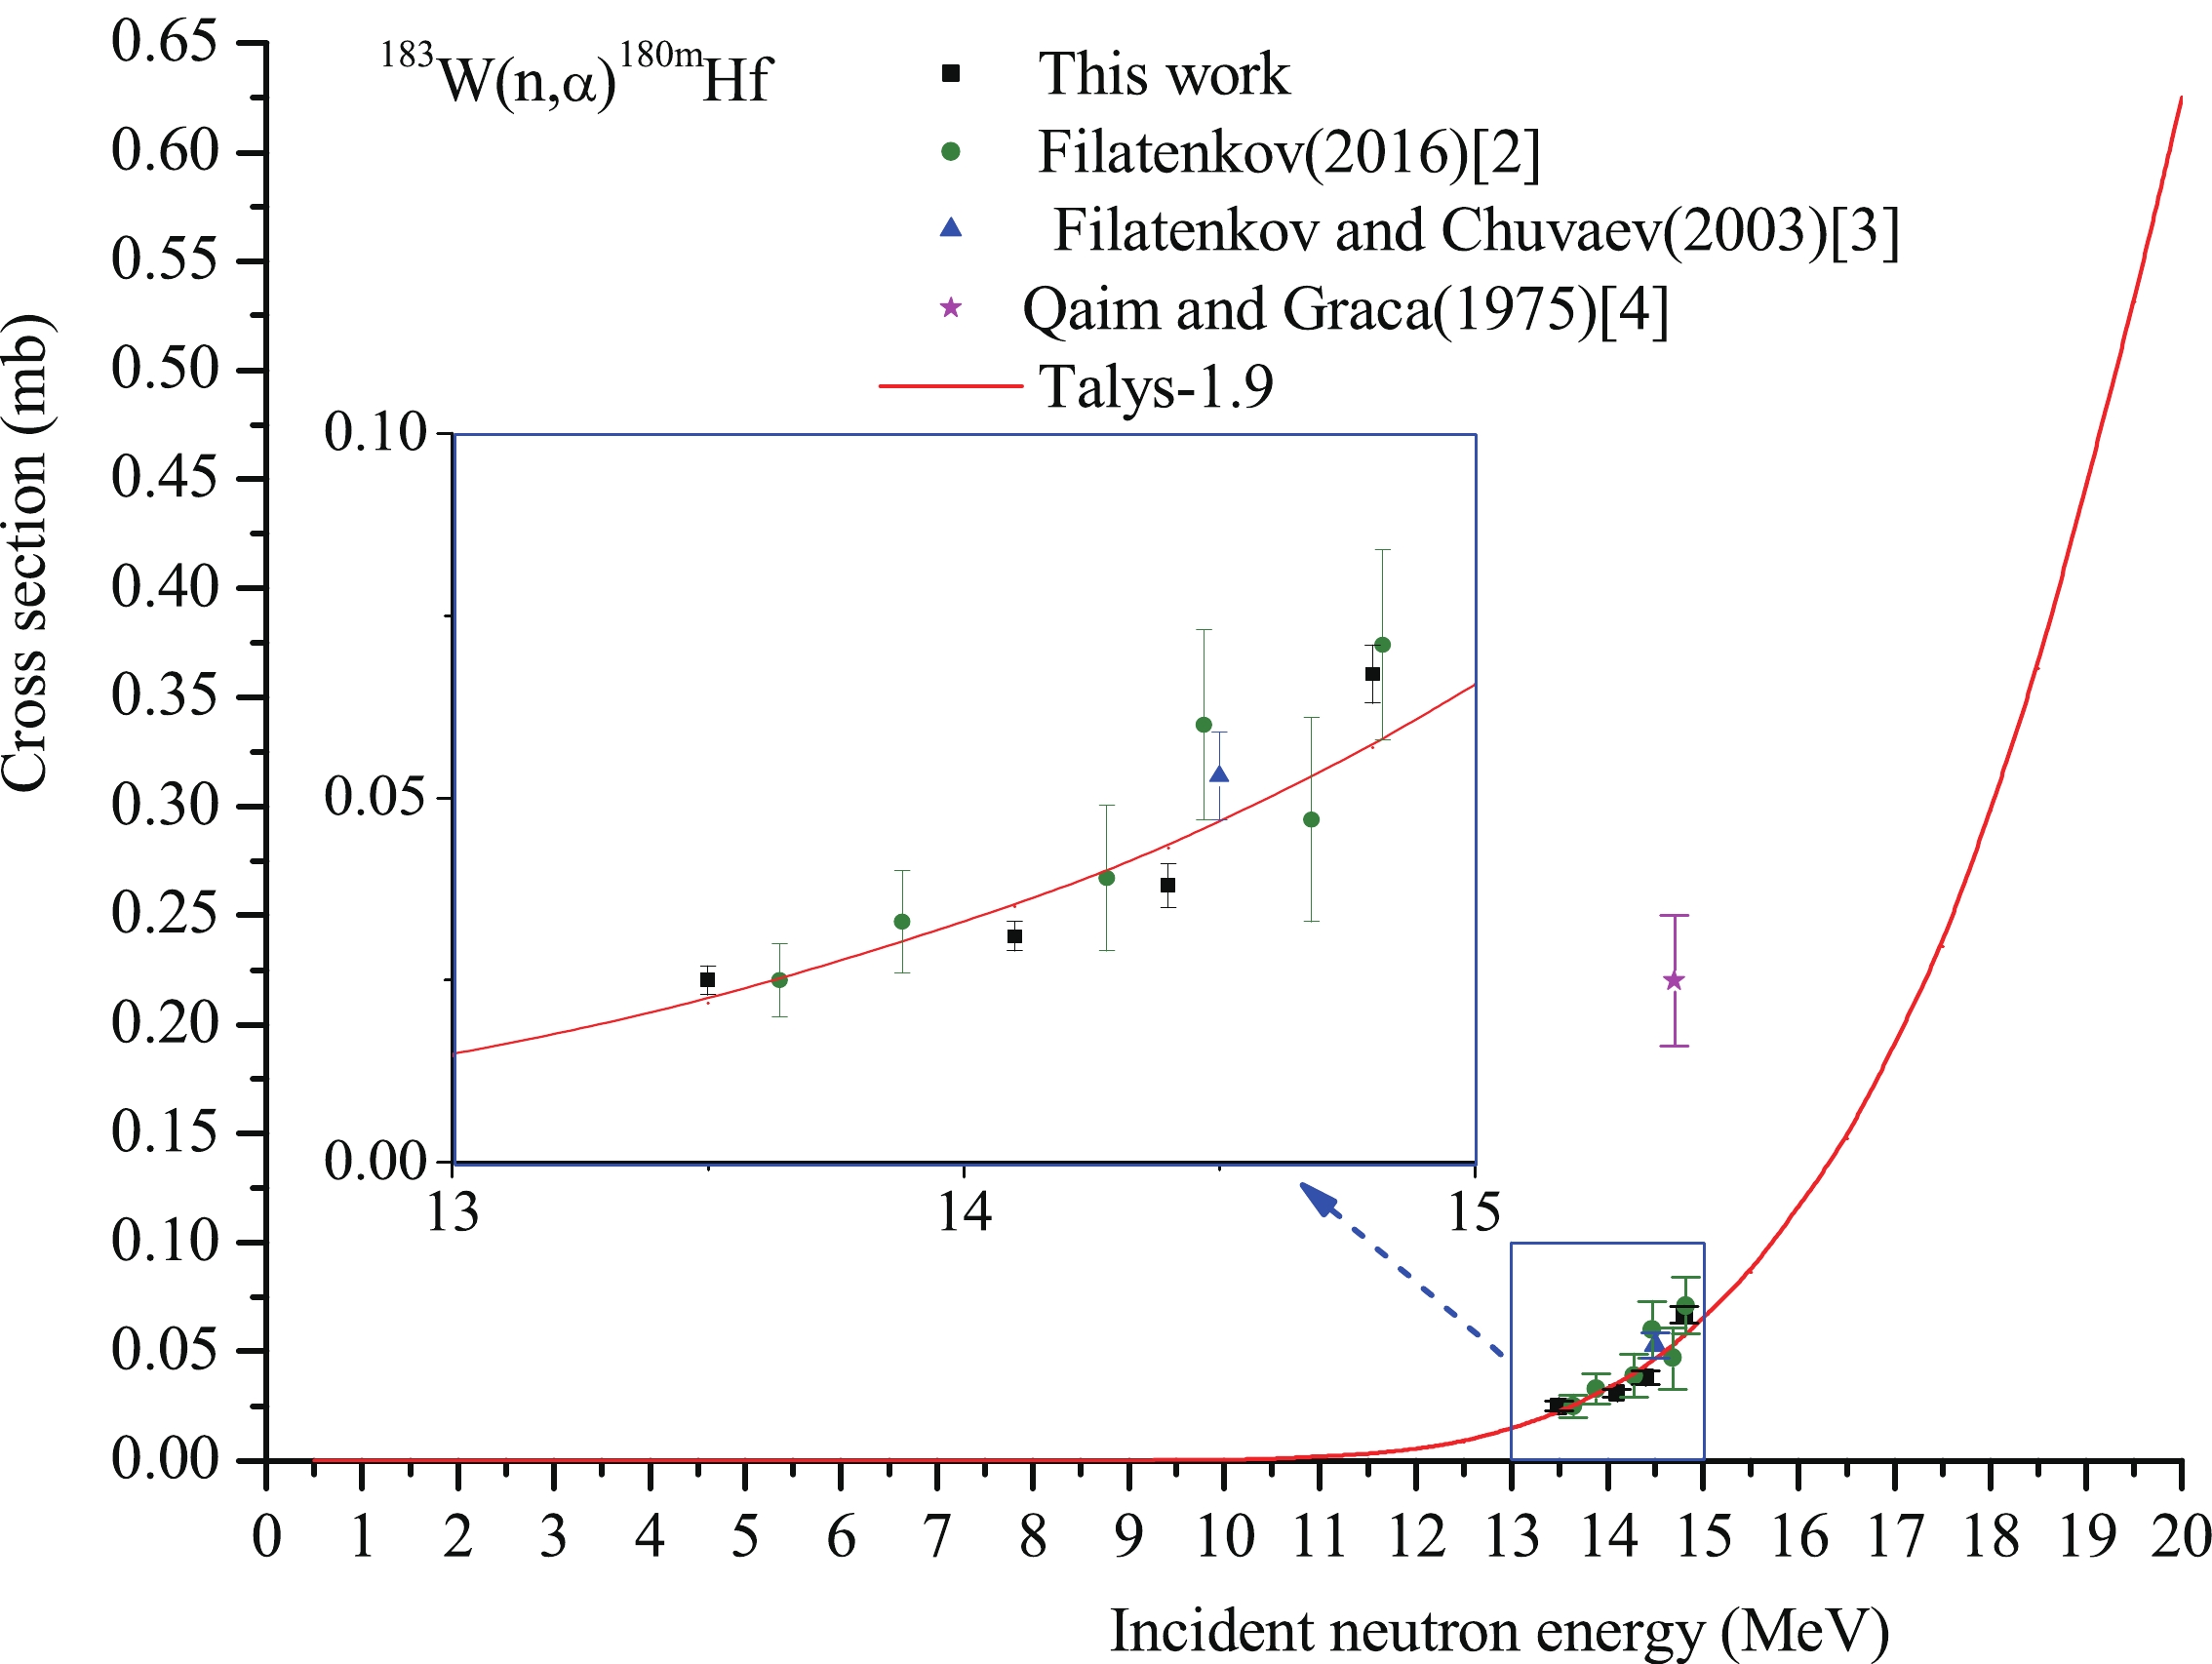
Figure 1.(color online) Cross section of183W(n,α)180mHf reaction.
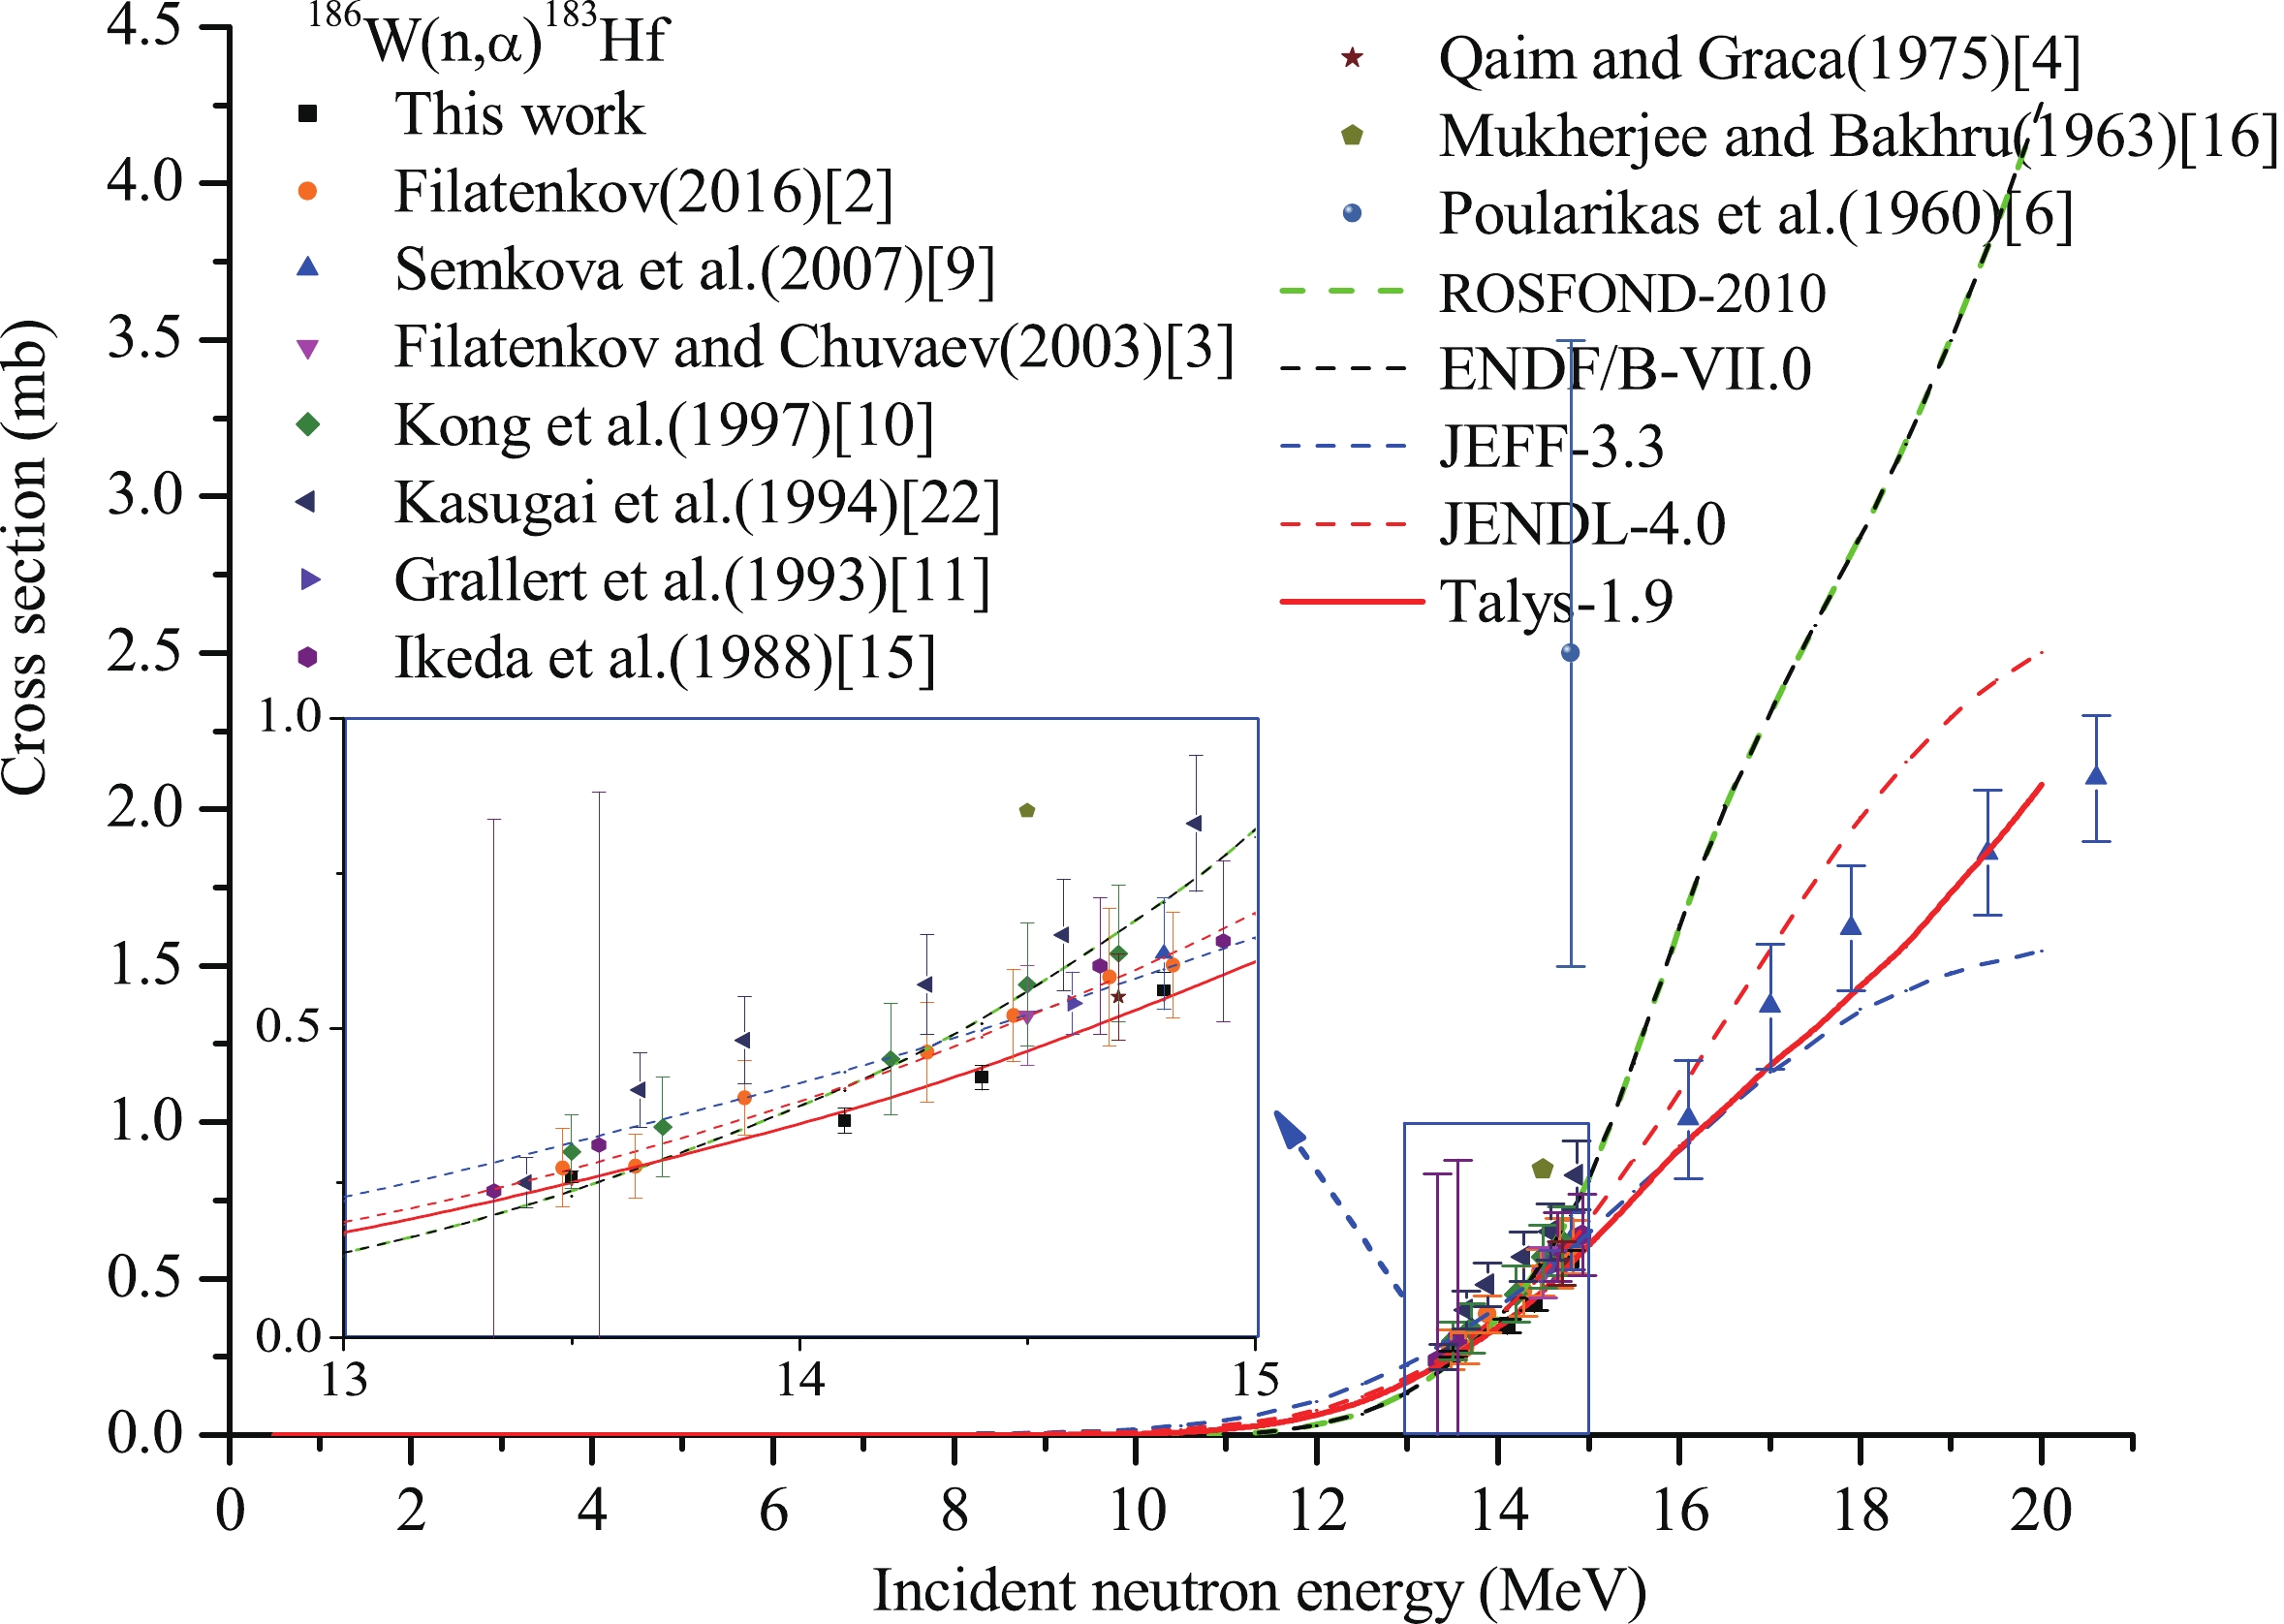
Figure 7.(color online) Cross section of186W(n,α)183Hf reaction.
Because a natural tungsten sample was used in the experiment, more than one reaction may result in the same product. The cross section of the182W(n,p)182Ta reaction contained the contributions of the183W(n,d*)182Ta and184W(n,t*)182Ta [(n,t*)=(n,t)+(n,n+d)+(n,2n+p)] reactions. In the process of calculating the cross section of the182W(n,p)182Ta reaction, the contribution of the183W(n,d*)182Ta reaction with its evaluated values (which are 0.32, 0.56, 0.75, 1.09 mb at 13.5, 14.1, 14.4, and 14.8 MeV, respectively) from ENDF JEFF-3.3 was subtracted while the contribution of the184W(n,t*)182Ta reaction was neglected because of its tiny cross section (μb) around the neutron energy of 14 MeV. For the184W(n,p)184Ta reaction, its cross section contained the contribution of the186W(n,t*)184Ta reaction. In the process of calculating the cross section of the184W(n,p)184Ta reaction, the contribution of the186W(n,t*)184Ta reaction was neglected because of its tiny cross section (a few to tens of μb) around the neutron energy of 14 MeV.
The measurements via gamma-ray spectrometry were generally performed using target elements of natural isotopic composition. Owing to the use of high-resolution detectors, there was no difficulty. However, for the measurement of the cross section of the182W(n,2n)181W reaction, the energy of the characteristic gamma-ray selected is 152.32 keV, which is still affected by a gamma-ray with energy close to 152.43 keV and 7.02% intensity of182Ta from the182W(n,p)182Ta+183W(n,d*)182Ta+184W(n,t*)182Ta reaction after using a different cooling time depending on the half-life of the product. During the cross-section calculation of the182W(n,2n)181W reaction, a formula was used to subtract the effect of the gamma-ray with 152.43 keV energy and 7.02% intensity of182Ta from the others that affect the measured reaction [41]. Besides, the cross section of the182W(n
,2n)181W reaction on account of natural tungsten sample used in the experiment contained the contribution of the180W(n,γ)181W reaction as well as that of the183W(n,3n)181W reaction at the neutron energies of 14.4 and 14.8 MeV, which are above this reaction threshold of 14.356 MeV. However, the contribution of the180W(n,γ)181W reaction can be neglected because its cross-section value is quite small (mb) around the neutron energy of 14 MeV, and the samples were wrapped in pure cadmium foil during the irradiation, and the influence of the180W(n,γ)181W reaction induced by thermal neutron was reduced to a low level (negligible). Moreover, the contribution of the183W(n,3n)181W reaction at the neutron energies of 14.4 and 14.8 MeV can also be neglected because its cross-section is also small (mb) compared to that of the182W(n,2n)181W reaction (103mb). In the present work, the uncertainties stem mainly from the gamma-ray detection efficiency (2.0%), standard cross-section (1.1%–1.5%), counting statistics (0.3%– 5.31%), weight of samples (0.1%), sample geometry (1.0%), self-absorption of gamma ray (1.0%), neutron fluctuation (1.0%), relative gamma-ray intensity (<3.9%), half-life of products (0.1%−3.04%), and abundance of target isotopes (0.07%−0.67%). The individual uncertainties mentioned above were combined in quadratic sum to obtain an overall uncertainty of 4.4%–8.1%.
-
TALYS is a computer code system used for the analysis and prediction of nuclear reactions based on physics models and parametrizations [24], and it can be used for the analysis of basic scientific experiments or to generate nuclear data for applications. It can simulate nuclear reactions involving neutrons, photons, protons, deuterons, tritons,3He, and alpha particles in the 0.001–200 MeV energy range and for target nuclides of mass number range (12 < A < 339). TALYS is always under development; the newer versions are TALYS-1.9 and TALYS-1.95, and the version used in this study is TALYS-1.9. The details of the theory and application of TALYS code are described in Ref. [24]. The theoretical calculations of excitation functions of the seven above-mentioned nuclear reactions were performed by using TALYS-1.9, of which excitation curves in the neutron energy range from the threshold to 20 MeV are charted inFigs.1–7for comparison. Different parameters in Talys-1.9 were adjusted according to our measured data and that of previous experiments conducted by other researchers for the nuclear reactions mentioned above. For the183W(n,α)180mHf,186W(n,d*)185Ta, and182W(n,p)182Ta reactions, the optical model potential (OMP) parameterrVwas adjusted. For the186W(n,α)183Hf reaction, the optical model potential (OMP) parameterrV,avwere adjusted. For the182W(n,2n)181W reaction, the OMP parameterrV,av, and model for level densities were adjusted. For the184W(n,α)181Hf reaction, the OMP parameterrV, model for level densities, and overall constant for the matrix element or the optical model strength in the exciton model were adjusted. For the184W(n,p)184Ta reaction, the OMP parameterrV,av, model for level densities, overall constant for the matrix element or the optical model strength in the exciton model, and the level density parameter a at the neutron separation energy were adjusted.
-
For the183W(n,α)180mHf reaction, it can be seen fromTable 2andFig. 1that the theoretical excitation curve based on the TALYS-1.9 code increases with increasing neutron energy in the incident neutron energy range from the threshold to 20 MeV, which matches the experimental cross-section data well except the result of Qaim and Graca [4], which is much higher than other experimental values and that of the theoretical excitation curve based on TALYS-1.9 code at the corresponding energy. Our experimental cross-section values are consistent, within experimental error, with those of the fitting line of the results of Filatenkov [2].
For the186W(n,d*)185Ta reaction,Table 3andFig. 2show that three of the five major evaluated nuclear data libraries of IAEA (namely JEFF-3.3, JENDL-4.0, ROSFOND-2010) provided the excitation function curves, and there are significant differences in the three curves and the theoretical excitation curve based on TALYS-1.9. The evaluated curve of JEFF-3.3 passes only through the experimental point of Qaim and Graca [4] within experimental error. In contrast, the results of Ganguly and Bakhru [5] and Poularikas et al. [6] are much higher than the values of three excitation function curves and those of the theoretical excitation curve at the corresponding energies. The theoretical excitation curve based on TALYS-1.9 matches our experimental cross-section data and the result of Qaim and Graca [4] well.
For the182W(n,p)182Ta reaction, as shown inTable 4andFig. 3, the evaluated excitation curves of the five major evaluated nuclear data libraries of IAEA and the theoretical excitation curve based on TALYS-1.9 increase with increasing neutron energy in the incident neutron energy range from the threshold to 20 MeV; however, there are differences between them except the curves of ENDF/B-VII.0 and JEFF-3.3 (which are the same). The experimental values of Songet al.[8], Konget al. [10], and Lindner and Miskel [12] are lower than those of the fitting line of our experimental values and the theoretical excitation curve obtained by TALYS-1.9 at the corresponding energies. In contrast, the value of Grallertet al. [11] is higher, and the values of Makwanaet al. [7] at the neutron energies of 12.47 and 16.63 MeV are lower. The theoretical excitation curve based on TALYS-1.9 matches our experimental cross-section data and the results of Filatenkov [2], Filatenkov and Chuvaev [3], and Qaim and Graca [4] well.
For the184W(n,p)184Ta reaction, shown inTable 5andFig. 4, four of the five major nuclear data libraries of IAEA that were evaluated gave the excitation function curves, and there are differences in the four curves except the curves of ROSFOND-2010 and ENDF/B-VII.0 (which are the same) and the theoretical excitation curve based on TALYS-1.9. The experimental values of Kasugaiet al. [14] are higher than the values of the four evaluated curves and those of the theoretical excitation curve at the same energy. In contrast, the results of Poularikaset al. [6], Mukherjee and Bakhru [16], and Colemanet al. [17] are much higher than the values of four excitation function curves and those of the theoretical excitation curve at the same energy. Our experimental cross-section values are consistent, within experimental error, with those of the fitting line of the cross-section values of Filatenkov [2], Ikedaet al. [15], and the theoretical excitation curve based on TALYS-1.9 at the corresponding energies beside the neutron energy of 14.1 MeV. The theoretical excitation curve based on TALYS-1.9 matches our experimental cross-section data and the results of Filatenkov [2], Qaim and Graca [4], Semkovaet al. [9], Filatenkovet al. [13], and Ikedaet al. [15] well. In particular, the consistency of the theoretical excitation curve with the results of Semkovaet al. [9] is better than the evaluated curves.
For the182W(n,2n)181W reaction, shown inTable 6andFig. 5, the five major evaluated nuclear data libraries of IAEA gave the excitation function curves, and there are differences in the five curves except the curves of BROND-3.1 and ENDF/B-VIII.0 (which are the same) and the theoretical excitation curve based on TALYS-1.9. Our experimental cross-section values are consistent, within experimental error, with those of the fitting lines of the results of Konget al. [10] and Frehautet al. [18], and with those of the theoretical excitation curve based on TALYS-1.9 at the corresponding energies. The experimental cross-section values of Qaim and Graca [4], Maslovet al. [19], Dilget al. [20], and Druzhininet al. [21] are consistent, within experimental error, with those of the fitting line of our experimental results at the corresponding energies. In contrast, the value of Lindner Miskel [12] is much lower than the value of excitation function curves and that of the theoretical excitation curve at the same energy. Comparison with the evaluation curves shows that the obtained theoretical excitation curve based on TALYS-1.9 can match all the experimental data except the value of Lindner Miskel [12]. In particular, the consistency of the theoretical excitation curve with the results of Frehautet al. [18] is better than the evaluated curves.
For the184W(n,α)181Hf reaction, shown inTable 7andFig. 6, four of the five major nuclear data libraries of IAEA that were evaluated gave the excitation function curves, and there are significant differences in the curves except the curves of ROSFOND-2010 and ENDF/B-VII.0 (which are the same) and the theoretical excitation curve based on TALYS-1.9. Our experimental cross-section values are consistent, within experimental error, with those of the fitting lines of the results of Filatenkov [2], Semkovaet al. [9] and Kasugaiet al. [22], and with those of the theoretical excitation curve based on TALYS-1.9 at the corresponding energies. The experimental cross-section values of Filatenkov and Chuvaev [3], Grallertet al. [11], and Lindner and Miskel [12] are consistent, within experimental error, with those of the fitting line of our experimental results at the corresponding energies. In contrast, the value of Qaim and Graca [4] is higher. The obtained theoretical excitation curve based on TALYS-1.9 can match all the experimental data except the value of Qaim and Graca [4] and that of Semkovaet al. [9] at the neutron energy of 20.5 MeV. The evaluated excitation curve of JENDL-4.0 matches all the experimental data except the value of Qaim and Graca [4], whereas the evaluated excitation curves of ENDF/B-VII.0 and ROSFOND-2010 do not pass through any experimental point of Semkovaet al. [9], and the evaluated excitation curve of JEFF-3.3 passes only through one experimental point of Semkovaet al. [9] at the neutron energy of 14.8 MeV. Comparison with the evaluation curves shows that the obtained theoretical excitation curve based on TALYS-1.9 is in good agreement with the evaluation curve of JENDL-4.0 in the neutron energies from the threshold to 17.5 MeV.
For the186W(n,α)183Hf reaction, it can be seen fromTable 8andFig. 7that four of the five major nuclear data libraries of IAEA that were evalutated gave the excitation function curves, and there are significant differences in these curves except the curves of ROSFOND-2010 and ENDF/B-VII.0 (which are the same) and the theoretical excitation curve based on TALYS-1.9. Our experimental cross-section values are consistent, within experimental error, with those of the fitting lines of the results of Filatenkov [2] and Konget al. [10], and with those of the theoretical excitation curve based on TALYS-1.9 at the corresponding energies. The experimental cross-section value at a single energy of Filatenkov and Chuvaev [3], Qaim and Graca [4] is consistent, within experimental error, with that of the fitting lines of our experimental results at the corresponding energy. In contrast, the results of Poularikaset al. [6] and Mukherjee and Bakhru [16] are much higher than the values of the excitation curves and those of the theoretical excitation curve at the corresponding energies. Comparison with the evaluation curves shows that the obtained theoretical excitation curve based on TALYS-1.9 can match most of the experimental data well; in particular, the theoretical excitation curve is highly consistent with the fitting line of the results of Semkovaet al. [9].
-
New experimental cross-section data of the183W(n,α)180mHf,186W(n,d*)185Ta,182W(n,p)182Ta,184W(n,p)184Ta,182W(n,2n)181W,184W(n,α)181Hf, and186W(n,α)183Hf reactions were obtained in the neutron energy range of 13.5–14.8 MeV via the activation technique. The theoretical excitation curves of the seven nuclear reactions mentioned above in the neutron energies from the threshold to 20 MeV were also obtained using the nuclear theoretical model program TALYS-1.9 with the relevant parameters properly adjusted. The measured experimental cross-section data were analyzed and compared with that of previous experiments conducted by other researchers, the evaluated data available in the five major nuclear data libraries of IAEA, and the theoretical values based on TALYS-1.9. The new cross section measurements agree with those of some recent experiments and the theoretical excitation curve at the corresponding energies. Comparison with these evaluation curves shows that the consistency of the theoretical excitation curves based on TALYS-1.9 with the experimental data is better than the evaluated curves available in the five major nuclear data libraries of IAEA that were evaluated. New cross section measurements in the present study on tungsten isotopes would improve the quality of the neutron cross section database and are expected to help with new evaluations of cross sections on tungsten isotopes, and the theoretical excitation curves are significant for the design of fusion reactors and the related applications.
-
We thank the crew of the K-400 Neutron Generator at Institute of Nuclear Physics and Chemistry China Academy of Engineering Physics for performing irradiation work.
New cross section measurements on tungsten isotopes around 14 MeV neutrons and their excitation functions
- Received Date:2021-04-25
- Available Online:2022-05-15
Abstract:New cross sections of the183W(n,α)180mHf,186W(n,d*)185Ta,182W(n,p)182Ta,184W(n,p)184Ta,182W(n,2n)181W,184W(n,α)181Hf, and186W(n,α)183Hf reactions were measured in the neutron energy range of 13.5-14.8 MeV via the activation technique to improve the database and resolve discrepancies. Monoenergetic neutrons in this energy range were produced via the T(d,n)4He reaction on a solid Ti-T target. The activities of the irradiated monitor foils and samples were measured using a well-calibrated high-resolution HPGe detector. Theoretical calculations of the excitation functions of the seven nuclear reactions mentioned above in the neutron energies from the threshold to 20 MeV were performed using the nuclear theoretical model program TALYS-1.9 to aid new evaluations of cross sections on tungsten isotopes. The experimental data obtained were analyzed and compared with that of previous experiments conducted by other researchers, and with the evaluated data available in the five major evaluated nuclear data libraries of IAEA (namely ENDF/B-VIII.0 or ENDF/B-VII.0, JEFF-3.3, JENDL-4.0u+, CENDL-3.2, and BROND-3.1 or ROSFOND-2010), and the theoretical values acquired using TALYS-1.9 nuclear-reaction modeling tools. The new cross section measurements agree with those of some recent experiments and theoretical excitation curves at the corresponding energies. The consistency of the theoretical excitation curves based on TALYS-1.9 with these experimental data is better than that of the evaluated curves available in the five major nuclear data libraries of IAEA.


 DownLoad: