


 Abstract
 HTML
HTML Reference
 Related
 PDF
PDF


-
Nuclear data such as cross section, half-life, decay modes, decay radiation properties, and γ-rays from radionuclides of the various radioisotopes are widely used in nuclear medicine, radiation shielding, fusion/fission reactor design, radioactive waste disposal and transmutation, radiation safety, etc. Neutron-induced reaction cross section data for different nuclei is often used to predict various theoretical nuclear models [1]. The
$ (n, 2n) $ reaction cross sections of the121Sb and123Sb isotopes are essential for neutron multiplication calculations. In recent years, the121Sb$ \left(n,2n\right) $ 120Sb and123Sb$ \left(n,2n\right) $ 122Sb reaction cross sections within the energy range 13 to 20 MeV was measured by several authors, as mentioned in the EXFOR compilation [2]. The available experimental and evaluated data of the121Sb$ \left(n,2n\right) $ 120Sb and123Sb$ \left(n,2n\right) $ 122Sb reactions from threshold to 20 MeV shows disagreement at the same incident energy. Since there are significant discrepancies in the measured cross section and evaluated data from different libraries for common incident neutron energy, it is difficult to refine and correct various statistical parameters.The compound nucleus, direct and pre-equilibrium emission are the different models used to understand the reaction mechanism, and the optimum parameters needed to understand these processes. Therefore, it is essential to improve the accuracy of measured experimental data and understand these reaction models [3]. Some of the antimony isotopes in nuclear fission have been identified as nuclides of the fission product. For the decommissioning of light-water nuclear reactors, the cross section data of neutron-induced reactions of antimony are very important. Therefore, fast-neutron-induced cross section measurements with better accuracy for antimony are essential for improving nuclear data [4–5]. It was observed that when antimony is alloyed with lead, this increased the hardness and mechanical strength of lead. This lead–antimony alloy is used in radiation shielding. The123Sb
$ \left(n,2n\right) $ 122Sb reaction produces122Sb (${\tau }_{1/2}=$ 2.47 day) nuclei, and essential radiotracers are used to study food crops and environmental contamination. Natural antimony is also used in the start-up of neutron sources [6–7].The neutron-induced reactions that result in the formation of various isomers of residual nuclei are crucial for better understanding the role of nuclear structure in the compound nucleus reaction process. In comparison with the ground state of120Sbgand122Sbgwith spin
$ {J}^{\pi }={1}^{+} $ and$ {J}^{\pi }={2}^{-} $ ,120Sbmand122Sbmare high spin isomers, each with a spin value of$ {J}^{\pi }={8}^{-} $ . Due to the high spin value$ {8}^{-} $ of the isomeric state relative to the ground state$ {1}^{+} $ and$ {2}^{-} $ value, the spin distribution of the residual nucleus can be studied with great sensitivity [8].In the present work, the excitation functions of the121Sb
$ \left(n,2n\right) $ 120Sbmand123Sb$ \left(n,2n\right) $ 122Sb reactions were measured at 12.50, 15.79 and 18.87 MeV neutron energies. The experimental results and latest evaluated data from JEFF-3.3 [9], JENDL/AD-2017 [10], ENDF/B-VIII.0 [11] and TENDL-2019 [12] libraries were compared with the each other. Specifically, the uncertainties in the measured cross section data were obtained through the covariance analysis method, which involves uncertainties from each source. In addition, a systematic study of the$ (n, 2n) $ reaction cross section for antimony isotopes was also carried out using different formulae given by several authors. The isomeric cross section ratioσm/σgfor the121Sb$ \left(n,2n\right) $ 120Sbm,gand123Sb$ \left(n,2n\right) $ 122Sbm,greactions were studied theoretically in the energy range 10–26 MeV using the TALYS (ver. 1.9) [13] and EMPIRE (ver. 3.2.2) [14] codes. The present measurements and available literature data were compared with theoretical calculations performed using the two codes. Additionally, the different theoretical models from the two codes were used to study the pre-equilibrium process mechanism and the contribution to the current interest reaction channels. The main reason for measuring the$ (n, 2n) $ reaction cross section of121Sb and123Sb isotopes was the lack of sufficient data at higher energies. -
The 6-m elevation level (above analysing magnet) irradiation setup of the 14UD BARC-TIFR Pelletron accelerator facility at Mumbai, India, was used for neutron generation and activation. Quasi-monoenergetic neutrons are produced when a proton beam with current of 150–160 nA is incident on the natural lithium foil through the7Li
$ \left(p,n\right) $ reaction. The pressure inside the 6-m setup was 8×10⁻⁸torr, and in the neutron activation zone was atmospheric. The energy spreads of the proton energy at the height of 6 m were 50–90 keV. In the above experimental setup, protons with energies of 15, 18 and 21 MeV after passing through a beam collimator with a diameter of 6 mm have impinged on 8.0-mg/cm2thin natural lithium foil, which was prepared at the TIFR target laboratory. This lithium foil was placed between the two tantalum foils of different thicknesses. The lithium target was pasted on 0.1-mm-thick tantalum foil to stop the proton beam along with a 4.0-mg/cm2thick front tantalum foil. The energy losses of the protons in the lithium and tantalum foils were calculated from the Monte Carlo simulation code SRIM [15]. The proton energy loss in the lithium foil is from 264.08 to 167.12 keV, whereas in the tantalum foils, it is from 56.7 to 44.96 keV. The samples for irradiation were kept one at a time at a distance of 2.1 cm from the Ta–Li–Ta stack at$ {0}^{\mathrm{o}} $ with respect to the proton beam direction. The experimental arrangement for the neutron irradiation is shown inFig. 1.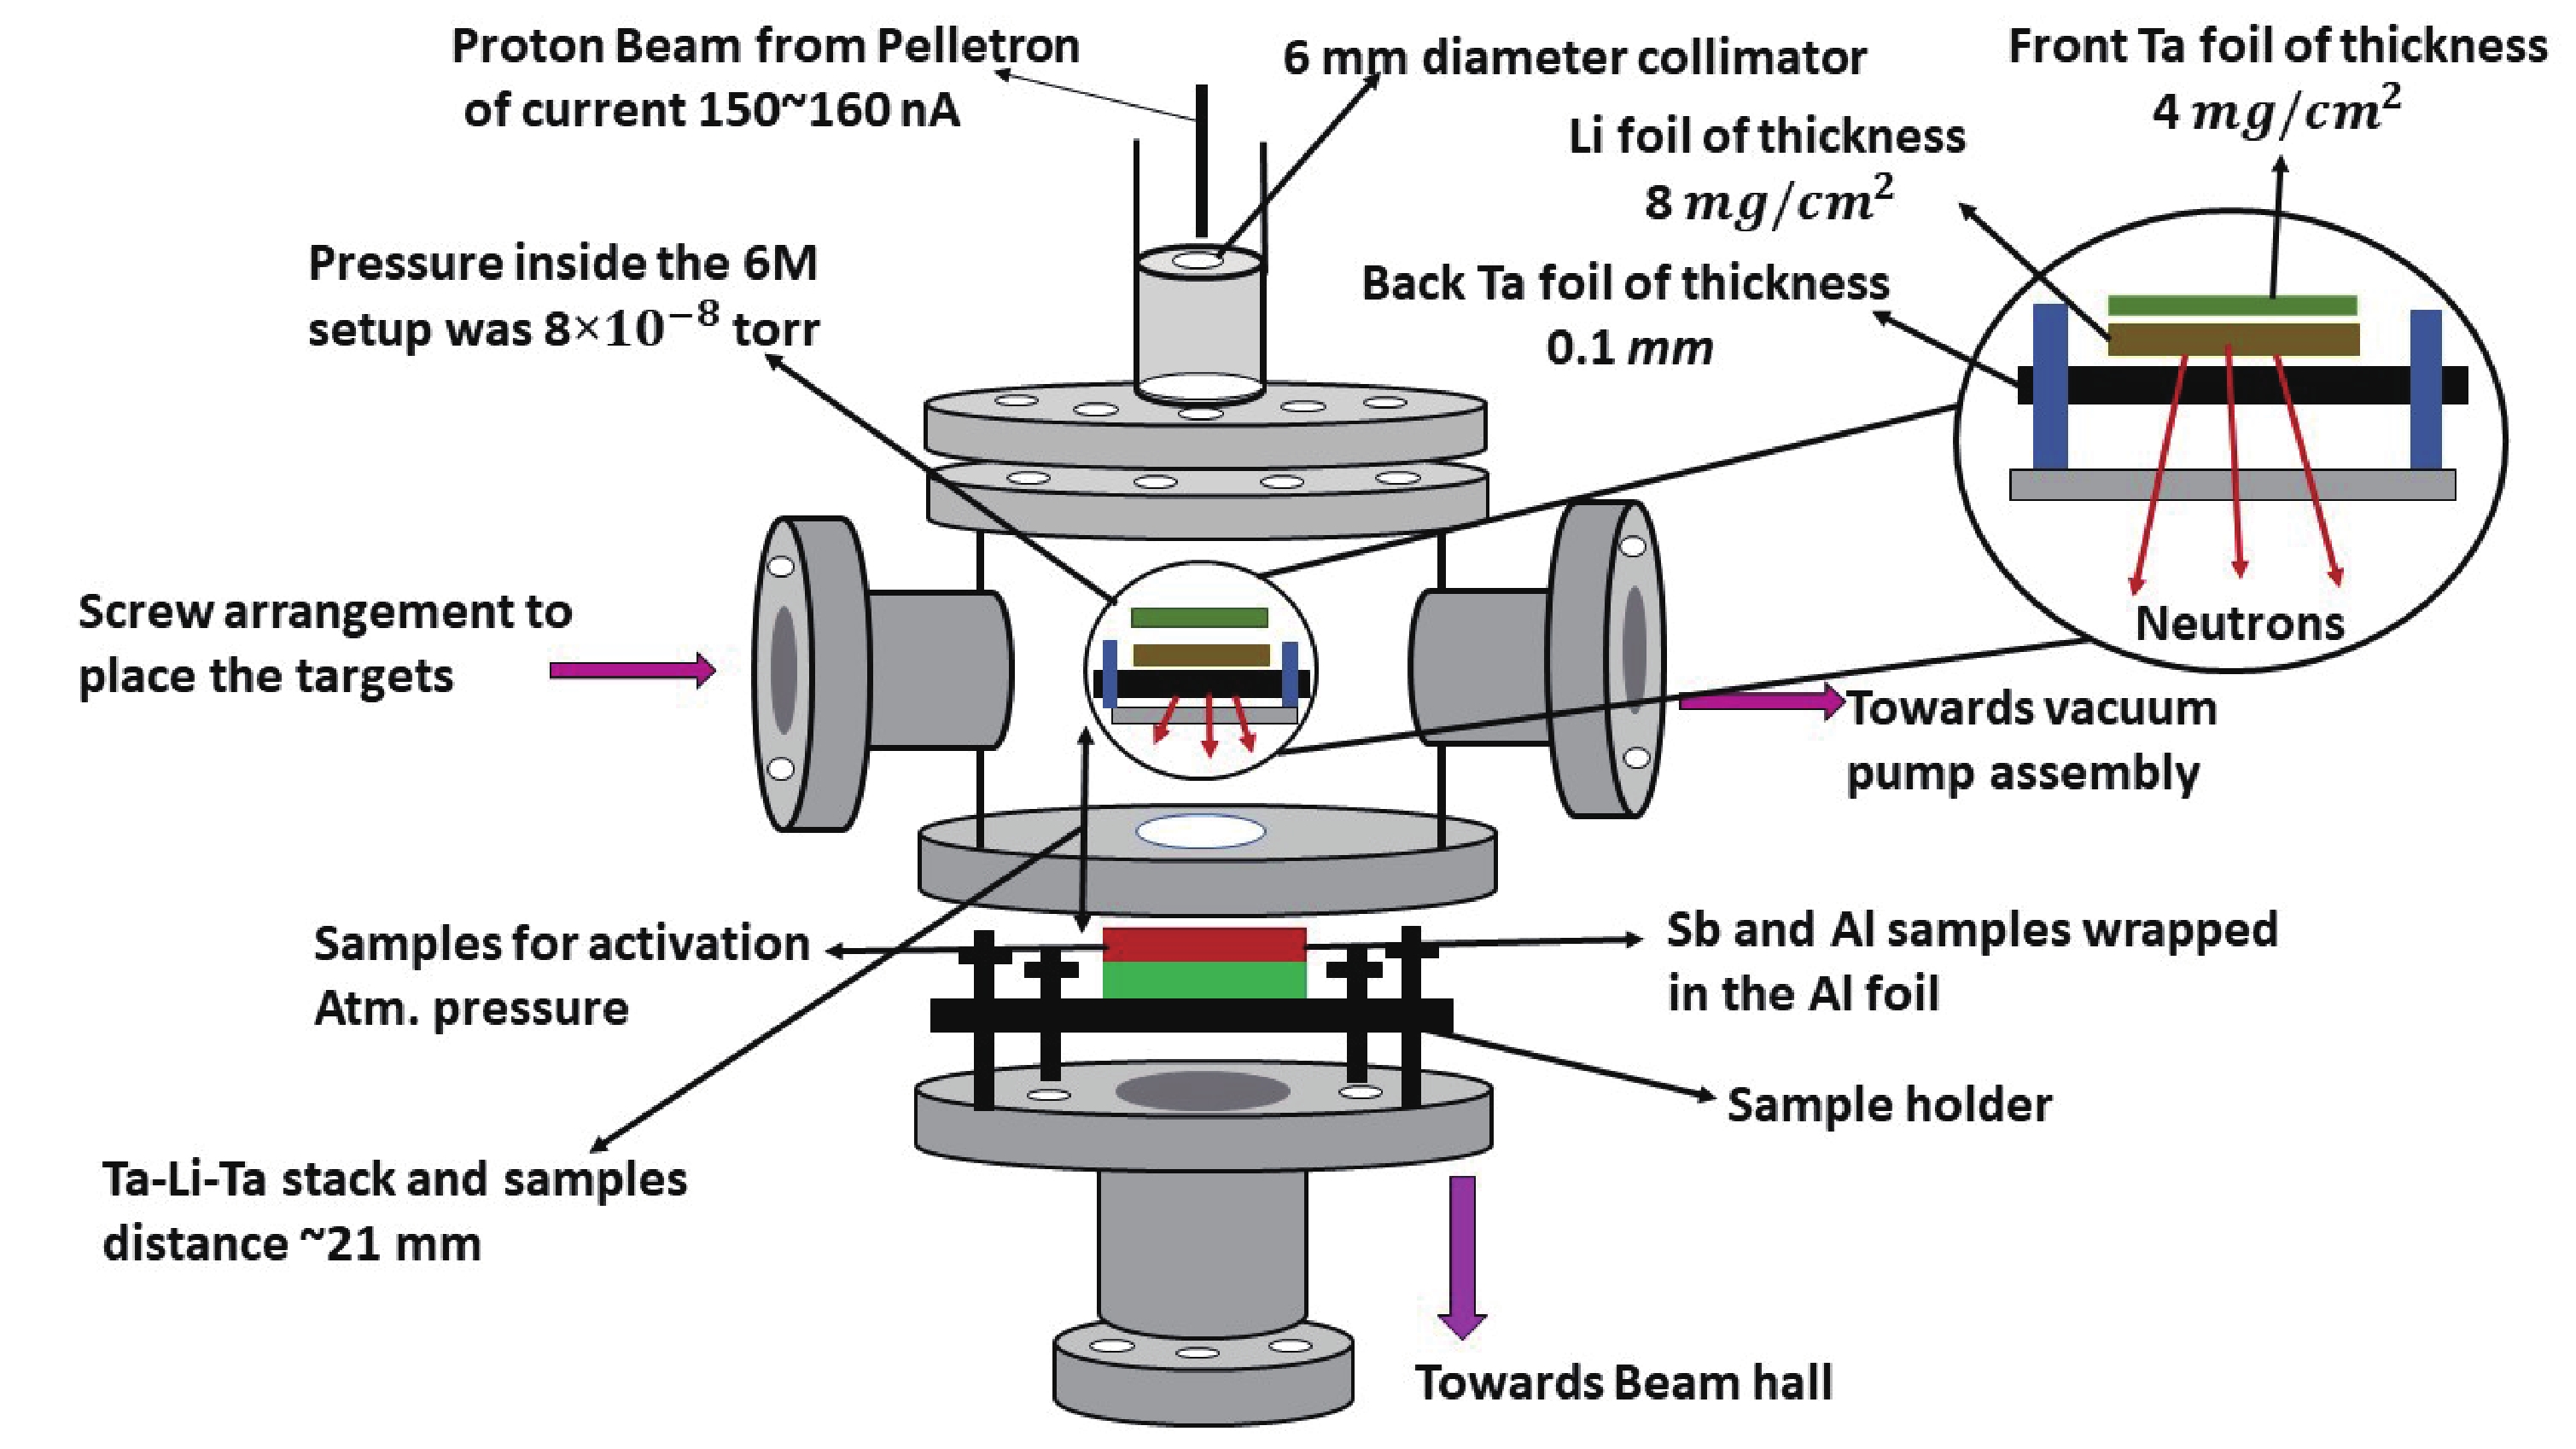
Figure 1.(color online) Schematic diagram of the experimental setup used for neutron irradiation.
In the above experimental setup, when the natural lithium foil was bombarded with protons with energies of 15, 18 and 21 MeV, quasi-monoenergetic neutrons
$ \left({n}_{0}\right) $ were produced in the forward direction via the7Li$ (p,n) $ reaction. This reaction7Li$ (p,n) $ (Eth=1.88 MeV) produces monoenergetic neutrons below the proton energy of 2.4 MeV. However, above the proton energy of 2.4 MeV, the first excited state of7Be is populated 0.43 MeV above the ground state, which is the second group of neutrons$ \left({n}_{1}\right) $ . The7Be ground state threshold is 1.881, and neutron energy corresponding to the ground state isEp−1.881. Similarly, the first excited state threshold for7Be is 2.38 MeV, and neutron energy corresponding to the first excited state isEp−2.38. In the7Li$ (p,n) $ reaction, for proton energies below 5 MeV at zero-degree, these low energy neutrons yield less than about 10% of the ground state yield. Thus the usefulness of the monoenergetic neutron source is only slightly impaired. Three-body interactions take place above 6 MeV, which populates excited states of7Be and produces neutrons with primary neutron peak$ \left({n}_{0}\right) $ [16]. The primary neutron peak$ \left({n}_{0}\right) $ has a higher neutron energy and flux, and this peak is used to measure the$ (n, 2n) $ reaction cross section of antimony isotopes. The neutron distribution for energies of 15, 18 and 21 MeV was obtained by interpolation techniques using the neutron distribution of M. W. Mcnaughtonet al.[17]. The neutron distribution has a quasi-monoenergetic peak nearEp−1.88 and a long tail towards lower energies, as shown inFig. 2(a,b,c) for the proton energies of 15, 18 and 21 MeV. This neutron spectrum was used for the neutron energy calculation based on the kinematic relation$\left({E}_{n}={E}_{p}-{E}_{\rm th}\right)$ ,$ {E}_{p} $ is the proton energy, and${E}_{\rm th}$ is the threshold energy of the7Li$ (p,n) $ reaction. The effective mean neutron energy of the primary neutron group from the neutron spectrum was calculated using equation (1), and the uncertainty associated with this neutron energy is the spectrum width of the primary neutron peak. The calculated neutron energy is given as 12.50±0.68, 15.79±0.55 and 18.87±0.59 MeV corresponding to proton energies 15, 18 and 21 MeV.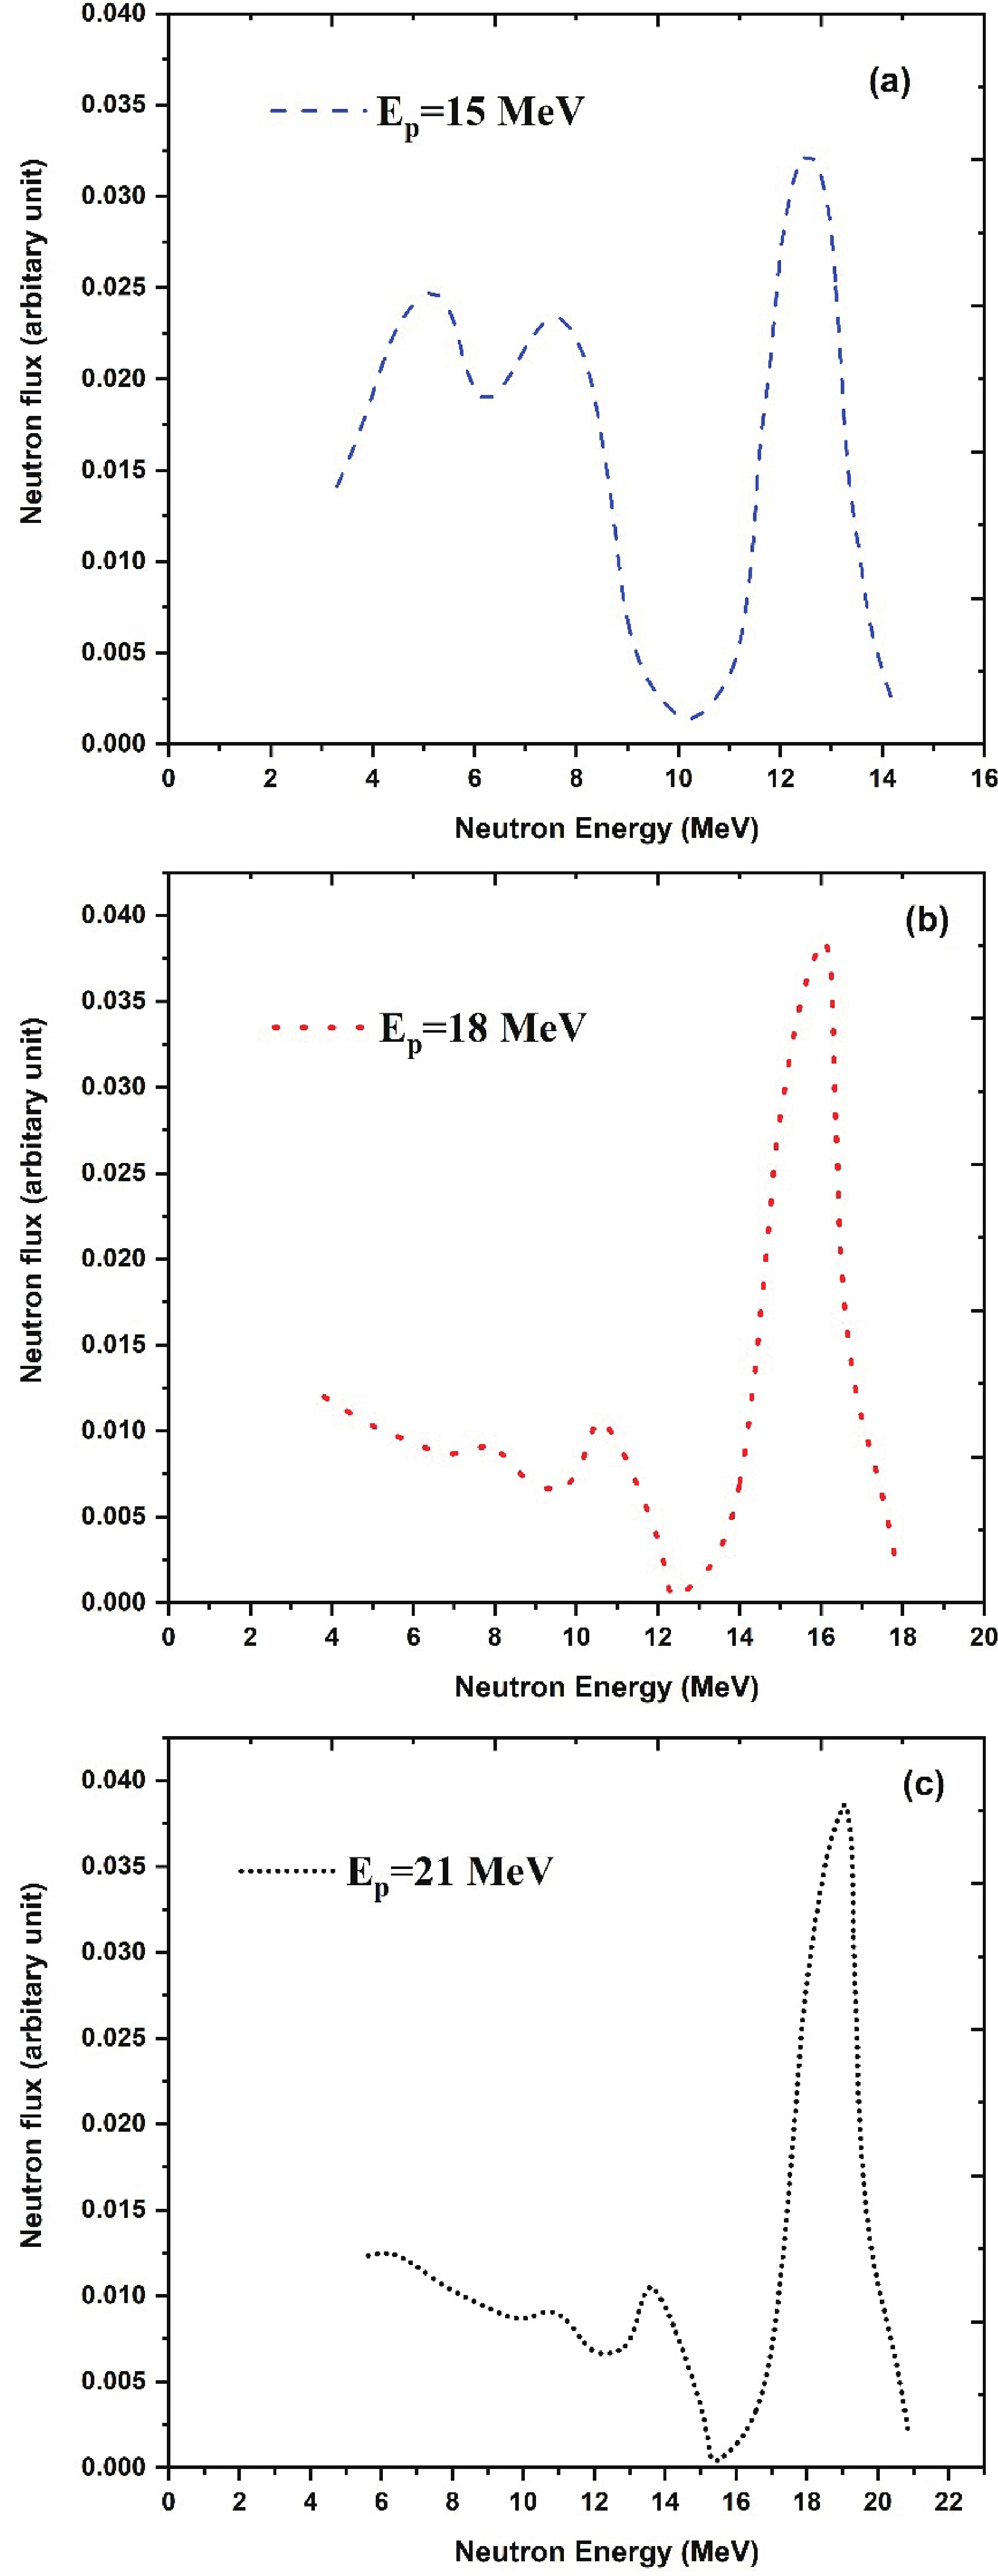
Figure 2.(color online) Neutron energy flux spectra from the7Li
$ (p,n) $ reaction at 0° of the impinging protons at energies 15, 18 and 21 MeV, obtained from the distribution of M. W. Mcnaughtonet al.[17].$ \left\langle{{E}_{n}}\right\rangle=\frac{{\displaystyle\int }_{{E}_{ps}}^{{E}_{\max}}{E}_{i}{\phi }_{i}\left(E\right){\rm d}E}{{\displaystyle\int }_{{E}_{ps}}^{{E}_{\max}}{\phi }_{i}\left(E\right){\rm d}E}, $

(1) $ \left\langle{{E}_{n}}\right\rangle $ is the effective mean neutron energy,$ {E}_{\max} $ is the maximum neutron energy,$ {E}_{ps} $ is the peak forming start energy,$ {E}_{i} $ is the energy bin and$ {\phi }_{i}\left(E\right) $ is the neutron flux for the energy bin$ {E}_{i} $ . -
Natural antimony (with purity 99.89%) in powder form was used for sample preparation of weight ~600 mg for each sample. Three antimony pellets of area 1.327 cm2and diameter 1.3 cm were prepared into circular shapes using the pelletizer. Thin aluminium metal foil (with purity 99.97%) of weight ~25.6 mg was used as a standard for normalization during the irradiation process. The aluminium monitor foil in a square shape of area 1 cm2and thickness 0.1 mm was placed with each antimony sample. The neutron flux was determined using the standard27Al
$ (n,\alpha ) $ 24Na reference reaction. During the irradiations, these samples were wrapped in 0.011-mm-thick aluminium foil to prevent radioactive contamination from one another and to the surrounding. -
The samples were irradiated at a distance of 2.1 cm from the neutron source for 7 to 9 hours to obtain sufficient activity in the antimony targets and the reference foils. After the irradiation process and sufficient cooling, the samples were transferred to the low-background counting location. The irradiation, cooling and counting time of the samples at different energies are summarized inTable 1. The emitted γ-rays from the neutron-irradiated samples were measured by a 40% relative efficiency pre-calibrated Balticp-type coaxial high-purity germanium detector (HPGe) coupled to a PC-based 4096 multi-channel analyzer. This detector was shielded with lead blocks to reduce the contribution of the natural background radioactivity. The samples were kept at a distance of 3 cm from the end cup of the HPGe detector to maintain a very low dead time throughout the experiment. At this distance, the correction for the coincident summing effect was considered in the efficiency calculation. The CAMAC-based Genie γ-ray spectroscopy software was used for the data acquisition. The energy and efficiency calibration of the detector was carried out using the standard calibrated152Eu point source at the same geometry to reduce the coincidence summing effect. The energy resolution of the HPGe detector was 3.305 keV at 1408 keV γ-ray of a standard152Eu point source. A typical γ-ray spectrum obtained from the HPGe detector is given inFig. 3, where the 564.12 keV and 1171.3 keV γ-lines of antimony isotopes are seen. The necessary decay data of the antimony and aluminium targets are presented inTable 2.
Isotope Natural abundance
(%)Ep(MeV) Samples weight (mg) Thickness (cm) Irradiation time
(sec)Cooling time
(sec)Counting time
(sec)Sb pellet Al foil Sb pellet Al foil 121Sb 57.38 (5) 15 601 25.6 0.07 0.01 32700 20986 1930 123Sb 42.64 (5) 18 602 25.9 0.07 0.01 25200 21475 1244 27Al 100 21 600 25.9 0.07 0.01 25200 24117 1214 Table 1.Sample details and irradiation, cooling and counting times for Sb samples.
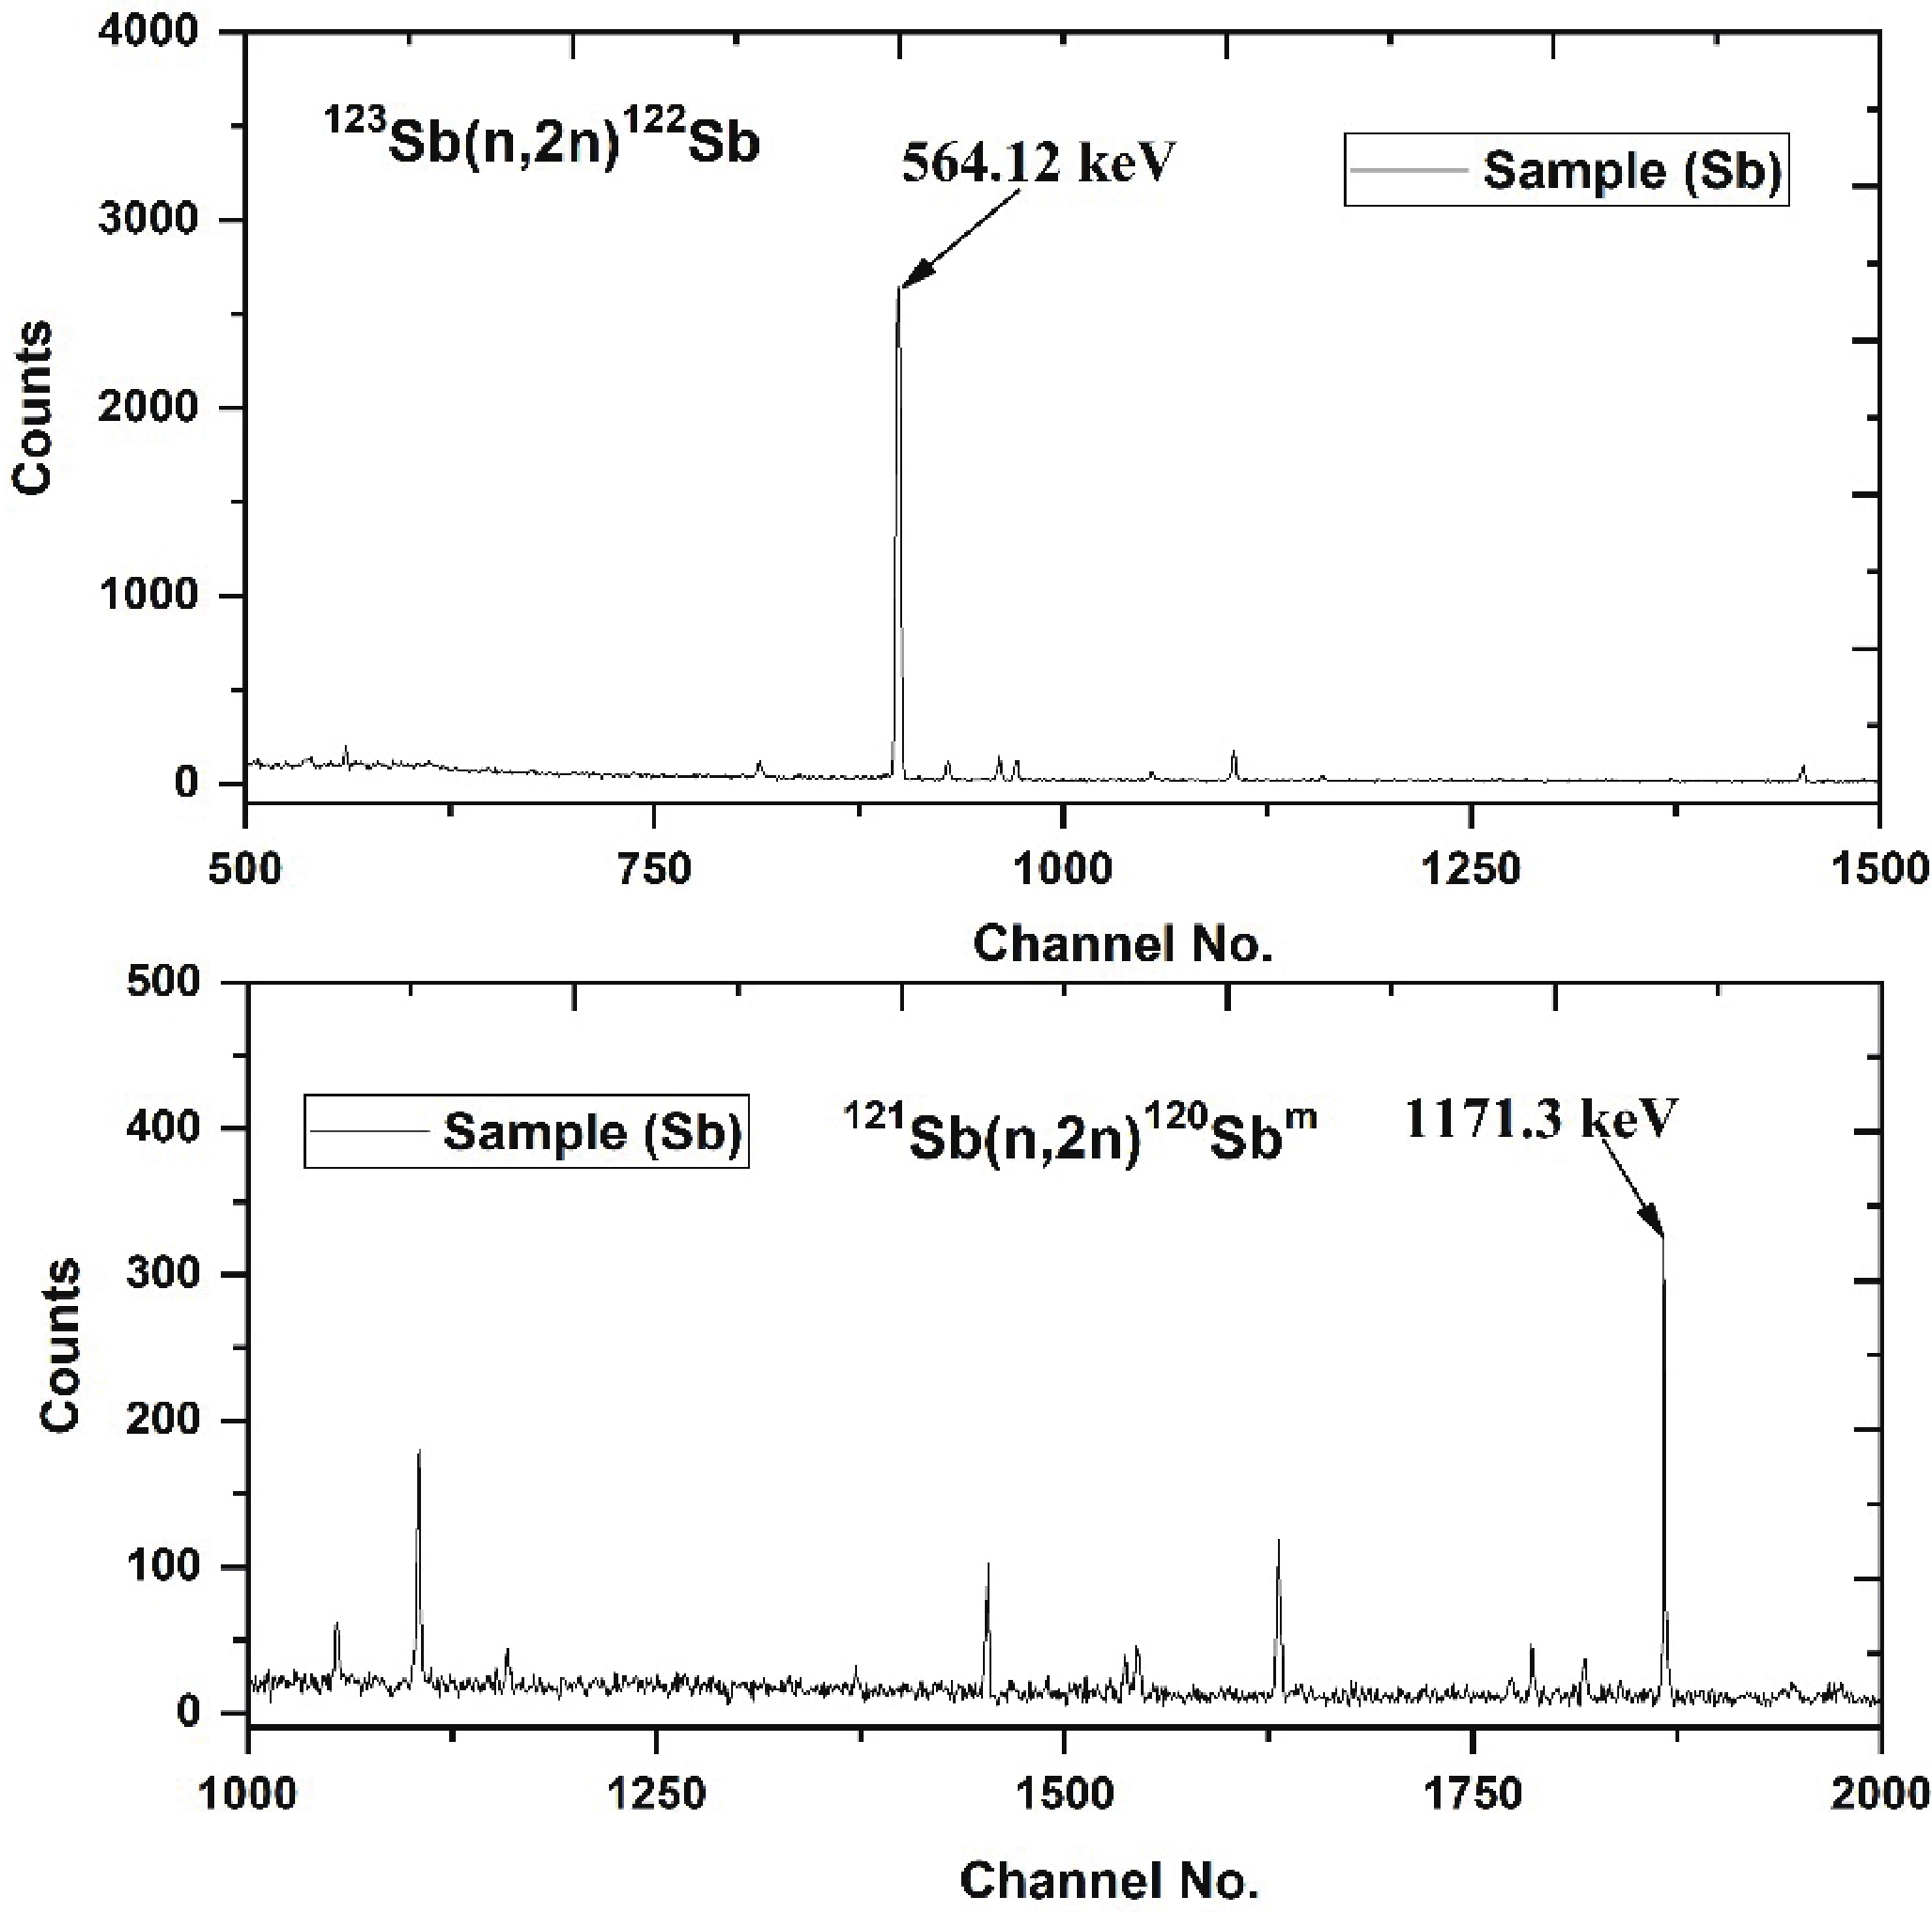
Figure 3.Typical offline γ-ray energy spectra obtained with an HPGe detector after irradiation at neutron energy of 15.79 MeV for thenatSb sample.
Reaction Eth(MeV) Half-life ( $ {\tau }_{1/2} $ )

Decay mode $ {E}_{\gamma } $ (keV)

$ {I}_{\gamma } $ (%)

121Sb $ (n, 2n) $ 120Sbm

9.33 5.76 (2) day ε(100 %) 1171.3 100 123Sb $ (n, 2n) $ 122Sb

9.03 2.72 (2) day $ {\beta }^{-} $ (97.59 %)

ε(2.41%)564.12 70.68 (18) 27Al $ (n,\alpha ) $ 24Na

3.47 14.99 (12) hours $ {\beta }^{-} $ (100 %)

1368.62 99.99 (4) -
The cross sections were measured by irradiating the target samples with a neutrons beam using the neutron activation method. These activated samples emit characteristic γ-rays having a suitable half-life with γ-ray transition probability. The neutron activation cross sections for the selected reactions were calculated relative to the27Al
$ \left(n,\alpha \right) $ 24Na reference reaction cross section using the following formula,$\begin{aligned}[b] \left\langle{{\sigma }_{\rm Sb}}\right\rangle=&\left\langle{{\sigma }_{\rm Al}}\right\rangle\cdot \frac{{\left(\varepsilon .{I}_{\gamma }.Abu.Wt.f\right)}_{\rm Al}}{{\left(\varepsilon .{I}_{\gamma }.Abu.Wt.f\right)}_{\rm Sb}} \cdot \frac{{\left(C.\lambda .AM.\frac{CL}{LT}\right)}_{\rm Sb}}{{\left(C.\lambda .AM.\frac{CL}{LT}\right)}_{\rm Al}}\\& \cdot \prod \frac{{{C}_{{\varGamma }_{\rm attn}}}_{\rm Sb}*{{C}_{\rm low}}_{\rm Sb}*{{C}_{\rm area}}_{\rm Sb}}{{{C}_{{\varGamma }_{\rm attn}}}_{\rm Al}*{{C}_{\rm low}}_{\rm Al}*{{C}_{\rm area}}_{\rm Al}} ,\end{aligned}$

(2) where
${\sigma }_{\rm Sb}$ and${\sigma }_{\rm Al}$ are sample and monitor reaction cross sections,Cis the γ-ray peak count,λis the decay constant,εis the efficiency for the characteristic γ-ray of the radionuclide,$ {I}_{r} $ is the γ-ray abundance,Wt.is the weight,Abu.is the isotopic abundance,AMis the atomic mass,fis the time factor, CL and LT are the clock and live time,${C}_{\rm low}$ is the correction factor due to the low energy neutron contribution,${C}_{{\varGamma }_{\rm attn}}$ is the correction factor due to the self-attenuation of theγ-ray and${C}_{\rm area}$ is the correction factor due to area. The following relation gives the time factorf,$ f=(1-{\rm e}^{-\lambda {t}_{\rm irr}}).\left(1-{\rm e}^{-\lambda {t}_{\rm c}}\right).{\rm e}^{-\lambda {t}_{\rm cool}} $

(3) where
${t}_{\rm irr}$ is the irradiation time,${t}_{\rm cool}$ is the cooling time and${t}_{\rm c}$ is the counting time. The half-life, isotopic abundance, γ-ray abundance and decay mode for the sample and monitor reaction products with their uncertainties are given inTable 2. The spectroscopic decay data with uncertainties were taken from the nuclear database [18–20]. The present measured cross sections of the121Sb$ \left(n,2n\right) $ 120Sbmand123Sb$ \left(n,2n\right) $ 122Sb reactions are given inTable 3.$ \left\langle{{E}_{n}}\right\rangle $ (MeV)

121Sb $ (n, 2n) $ 120Sbm

$(\rm mb)$ 

123Sb $ (n, 2n) $ 122Sb

$(\rm mb)$ 

Correlation matrix 12.50±0.68 424.47±46.35 1371.74±130.56 1.0
0.1735 1.0
0.3176 0.2556 1.0
0.8483 0.1775 0.3233 1.0
0.1652 0.9253 0.2561 0.1778 1.0
0.3412 0.2401 0.8511 0.3672 0.2418 1.015.79±0.55 596.25±94.37 1570.29±233.34 18.87±0.59 633.68±55.17 1412.50±101.63 Table 3.Measured cross sections with uncertainties and correlation matrix atEn=12.50, 15.79 and 18.87 MeV.
Interaction of theγ-rays with samples requires correction for the self-attenuation effect. This self-attenuation factor
${\varGamma }_{\rm attn}$ for activated materials was calculated by the relation${\varGamma }_{\rm attn}=\left(\right(1-{\rm e}^{-\mu l})/\mu l)$ , wherelis the thickness of the sample andμis the mass attenuation coefficient, which was taken from the XMuDat ver.1.0.1 [21–22]. The values for the correction factor of the self-attenuation are given inTable 4. The reaction cross sections were measured for the primary neutron$ \left({n}_{0}\right) $ energy peak, as shown inFig. 2. The following relation gives a correction for the low energy background neutrons,Reaction $ \left\langle{{E}_{n}}\right\rangle $ (MeV)

$ {E}_{\gamma } $ (keV)

$\left({C}_{ {\varGamma }_{\rm attn} }\right)$ 

$\left({C}_{\rm low}\right)$ 

12.50 0.988029 0.99948 121Sb $ (n, 2n) $ 120Sbm

15.79 1171.2 0.988064 0.96515 18.87 0.988076 0.90076 12.50 0.980661 0.99841 123Sb $ (n, 2n) $ 122Sb

15.79 564.2 0.980717 0.95577 18.87 0.980736 0.88616 12.50 0.999322 0.87381 27Al $ (n,\alpha ) $ 24Na

15.79 1368.62 0.999330 0.90274 18.87 0.999320 0.75953 Table 4.Values of γ-ray self-attenuation and low energy background neutron correction factors used to measure the cross section.
$ {C}_{\rm low}=1-\frac{\int \phi \left({E}_{{p}_{1}}\right){\sigma }_{i}\left({E}_{{p}_{1}}\right)}{\int \phi \left(E\right){\sigma }_{i}\left(E\right){\rm d}E} , $

(4) where
$ \phi \left(E\right)=\phi \left({E}_{{p}_{1}}\right)+\phi \left({E}_{{p}_{2}}\right) $ is the neutron flux,$ {E}_{{p}_{1}} $ and$ {E}_{{p}_{2}} $ are the primary and secondary neutron energy peaks in the neutron spectrum and$ {\sigma }_{i}\left(E\right) $ is the reaction cross section. The values of this cross section$ {\sigma }_{i}\left(E\right) $ for the sample and monitor reactions were obtained from the TENDL-2019 and IRDFF-1.05 evaluated data libraries [12,23]. The spectral indexing method for correcting the low energy background neutron is given in Ref. [24]. The calculated values of the correction factor for the low energy background neutrons are given inTable 4. The spectrum-averaged cross section for the monitor reaction is$ \left\langle{{\sigma }_{m}}\right\rangle $ , obtained by the following relation,$ \left\langle{{\sigma }_{m}}\right\rangle=\int {\varphi }_{0}{\sigma }_{m}\left(E\right){\rm d}E \Big/ \int {\varphi }_{0}{\rm d}E . $

(5) The correlation coefficients for the monitor reaction are obtained using the following equation,
$ {\rm Cor}\left( \langle{{\sigma }_{i}} \rangle \langle{{\sigma }_{j}} \rangle\right)= {\rm Cov}\left( \langle{{\sigma }_{i}} \rangle \langle{{\sigma }_{j}} \rangle\right)/{(Var \langle{{\sigma }_{i}} \rangle.Var \langle{{\sigma }_{j}} \rangle)}^{1/2}. $

(6) The reference cross section of the27Al
$ \left(n,\alpha \right) $ 24Na monitor reaction at the nearest point energies was calculated using the evaluated cross-section data of the IRDFF-1.05 [23] library. The monitor cross sections with uncertainties and the covariance and correlation matrix are given inTable 5.$ \left\langle{{E}_{n}}\right\rangle $ (MeV)

Cross section $ (\rm mb) $ 

Covariance matrix Correlation matrix 12.50±0.68 118.94±0.079 0.006326
0.000389 0.004493
0.002165 0.000917 0.011681.0
0.0729 1.0
0.2517 0.1265 1.015.79±0.55 114.38±0.067 18.87±0.59 55.74±0.108 Table 5.Standard27Al
$ (n,\alpha ) $ 24Na reaction cross sections with their covariance and correlation matrix obtained from IRDFF-1.05 [23]. -
We calculated the covariance matrix for the detector efficiency and reaction cross section in the above data analysis. All the uncertainty information for the experimental data is included in the covariance matrix. Therefore, the calculated matrix gives complete information of the uncertainties in the measured cross section. The efficiencies of the detector were measured using γ-lines of the calibrated152Eu point source. The following relation gives the efficiency of the HPGe detector,
$ \varepsilon =\frac{C{K}_{c}}{{N}_{0}{I}_{\gamma }{\rm e}^{-\lambda t}}, $

(7) whereεis the efficiency of the corresponding γ-rays,Cis the count under the gamma peak,N0is the activity of the standard152Eu source at an initial time,
$ {I}_{\gamma } $ is the γ-ray intensity, λ is the decay constant of152Eu,$ {K}_{C} $ is the correction factor for the coincidence summing effect, andtis the time elapsed from the manufacture date to the start of counting. The correction factor$ {K}_{C} $ was calculated from the Monte Carlo Simulation code EFFTRAN [25] using HPGe detector structured data such as crystal hole cavity, end cup, mount cup, crystal material, dimension, absorber, window and calibration source information. It is observed that the HPGe detector efficiency is the function of counts, decay constant, the activity of source and γ-ray intensity. Uncertainty in these four variables propagates in the detector efficiency estimation. Therefore, detector efficiency can be written as the function of only four attributes,$ {I}_{\gamma },\lambda ,{C,N}_{0} $ . The total uncertainties due to these four attributes in detector efficiency were calculated using quadratic sum formula,$ {\left(\frac{{\Delta \varepsilon }_{i}}{{\varepsilon }_{i}}\right)}^{2} ={\left(\frac{{\Delta C}_{i}}{{C}_{i}}\right)}^{2}+{\left(\frac{{\Delta I}_{\gamma i}}{{I}_{\gamma i}}\right)}^{2}+{\left(\frac{{\Delta N}_{0}}{{N}_{0}}\right)}^{2}+{\left(t\Delta \lambda \right)}^{2}. $

(8) Uncertainty in the decay constant is
$\Delta \lambda = $ $ \left(0.693*{\Delta \tau }_{1/2}/{\tau }_{1/2}^{2}\right)$ .The knowledge about the partial uncertainties and their correlations provides a foundation for creating the covariance matrix, which fully describes the uncertainties in the calculated efficiencies. It is possible to directly calculate the elements of this covariance matrix using the formula,
$ {\left({V}_{\varepsilon }\right)}_{ij}={\sum }_{r}{e}_{ir}{S}_{ijr}{e}_{jr}, $

(9) where
$ {S}_{ijr} $ is the$ n\times n $ micro-correlation matrix between the${i}^{\rm th}$ and${j}^{\rm th}$ observations due to the${r}^{\rm th}$ attributes,$ {e}_{ir} $ and$ {e}_{jr} $ are the$ n\times n $ diagonal matrices of partial uncertainties of the${i}^{\rm th}$ and${j}^{\rm th}$ observations due to the${r}^{\rm th}$ attributes. The partial uncertainties in different attributes are given inTable 6. The total error in the measured efficiencies is related to the variances by the formula$ {\sigma }_{\varepsilon ii}={\left({\left({V}_{\varepsilon }\right)}_{ii}\right)}^{1/2} $ . The calculated covariance and correlation matrix for the HPGe detector efficiency is given inTable 7. The γ-rays emitted by120Sbm,122Sb and24Na nuclei are different from the γ-ray of the standard152Eu source. A linear interpolation method was used in the calculation to estimate efficiencies for the corresponding γ-rays of120Sbm,122Sb and24Na nuclei. An empirical relation as a model through interpolation uses the following linear parametric function,$ {E}_{\gamma } $ (keV)

Counts
$ (\times {10}^{-4}) $ 

Half-life
$ (\times {10}^{-4}) $ 

$ {I}_{\gamma } $ 

$ (\times {10}^{-4}) $ 

Activity
$ (\times {10}^{-4}) $ 

Total Uncertainty
$ (\times {10}^{-4}) $ 

121.78 0.619 2.092 1.331 2.698 3.716 244.69 1.081 1.556 4.434 2.008 5.223 344.27 0.489 1.166 2.001 1.504 2.804 443.96 1.455 1.105 0.623 1.426 2.401 778.91 0.457 0.522 3.665 0.673 3.791 964.08 0.391 0.433 2.359 0.558 1.493 1085.87 0.381 0.358 1.995 0.462 2.114 1408.01 0.261 0.285 1.389 0.368 1.448 Table 6.Partial uncertainties in various parameters to obtain HPGe detector efficiency.
$ {E}_{\gamma } $ (keV)

Covariance matrix ( $ \times {10}^{-8}) $ 

Correlation matrix 121.78
244.69
344.27
443.96
778.91
964.08
1085.86
1408.0113.81
8.672 27.28
6.497 4.834 7.865
6.159 4.852 3.433 5.761
2.906 2.162 1.619 1.535 14.36
2.411 1.794 1.344 1.274 0.601 6.216
1.966 1.485 1.112 1.054 0.497 0.413 4.466
1.588 1.182 0.885 0.839 0.396 0.328 0.272 2.2141.0
0.446 1.0
0.623 0.331 1.0
0.691 0.365 0.511 1.0
0.206 0.109 0.152 0.168 1.0
0.261 0.137 0.192 0.213 0.063 1.0
0.254 0.134 0.187 0.208 0.062 0.078 1.0
0.287 0.152 0.212 0.235 0.071 0.089 0.086 1.0Table 7.Calculated covariance and correlation matrix for the HPGe detector efficiencies.
$ \ln\left({\varepsilon }_{i}\right)={\sum }_{k=1}^{m}{p}_{k}{\left(\ln\left[{E}_{i}\right]\right)}^{k-1}, $

(10) where
$ {\varepsilon }_{i} $ is the efficiency for the corresponding γ-ray energy,$ {E}_{i} $ and$ {p}_{k} $ is the fitting parameter. The least-square condition states that the best estimate for$ \grave{P} $ in the model is the one that minimizes the chi-square statistic given by$ {\chi }_{m}^{2}={\left(Z-AP\right)}^{\text{'}}{V}_{Z}^{-1}\left(Z-AP\right). $ From the least square method, the best estimate for$ \grave{P} $ is calculated by the following relation,$ {\grave{P}=\left({A}^{T}{V}_{z}^{-1}A\right)}^{-1}\left({A}^{T}{V}_{z}^{-1}Z\right). $

(11) In the above equation
$ \grave{P} $ is the column matrix,$ {V}_{z} $ was calculated as$ {\left({V}_{\varepsilon }\right)}_{ij}/{\varepsilon }_{i}{\varepsilon }_{j} $ where$ {V}_{\varepsilon } $ is the covariance matrix for the corresponding efficiencies$ \varepsilon , $ A is the design matrix with$ {A}_{ik} $ =${\left(\ln\left[{E}_{i}\right]\right)}^{k-1}$ ,k= 1, 2... 7,i= 1, 2... 8 andZis the column matrix with$ {Z}_{i} $ =$\ln\left({\varepsilon }_{i}\right)$ [26]. The best fit of the chosen model in the present work was obtained by considering six parameters, and the model gives the best fit value fork=7 andi=8, with the goodness of fit$ {\chi }^{2} $ =0.799. We consider the following linear parametric model as the best model, which gives the values of fitting parameters$ \grave{P} $ =−5.453, −1.092, 1.783, −0.0567, −5.579, −4.976, −1.208. From the above calculation, the correlation matrix and efficiencies for the characteristics γ-rays of the120Sbm,122Sb and24Na are given inTable 8.Reaction Nuclide $ {E}_{\gamma } $ (keV)

Efficiency Correlation matrix 121Sb $ (n, 2n) $ 120Sbm

120Sbm 1171.2 0.003749±0.0001326 1.0
0.4826 1.0
0.6459 0.1056 1.0123Sb $ (n, 2n) $ 122Sb

122Sb 564.2 0.010791±0.0002988 27Al $ (n,\alpha ) $ 24Na

24Na 1368.6 0.003369±0.0001385 Table 8.Interpolated detector efficiencies of the characteristic γ-rays of the product nuclides with their uncertainties and correlation matrix.
In covariance analysis, a ratio method was used for the calculation of the activation cross section. In the standard equation (2), the sample reaction cross section was normalized to monitor the reaction cross section. We obtained the ratio of
$ \left\langle{\sigma }_{r}\right\rangle $ and$ \left\langle{\sigma }_{m}\right\rangle $ , i.e. the sample and monitor reaction cross sections. The covariance matrix for the measured cross section was calculated by the following formula,$ {\left({V}_{\sigma s}\right)}_{ij}={\sum }_{r}{e}_{ir}{S}_{ijr}{e}_{jr} ,$

(12) where
$ {S}_{ijr} $ is the$ n\times n $ micro-correlation matrix between theithandjthobservations due to therthattributes,$ {e}_{ir} $ and$ {e}_{jr} $ are the$ n\times n $ diagonal matrix of partial uncertaintyithandjthobservations due to therthattributes [27]. TheTable 9summarizes the partial uncertainties in various parameters to obtain$ (n, 2n) $ reaction cross section of Sb isotopes. The calculated correlation matrix for the121Sb$ \left(n,2n\right) $ 120Sbmand123Sb$ \left(n,2n\right) $ 122Sb reactions cross sections is given inTable 9. The error in the measured cross sections are calculated by taking the square root of the diagonal elements of the covariance matrix, i.e.$ {\left({\left({V}_{\sigma s}\right)}_{ii}\right)}^{1/2}. $ The source of uncertainty and their values in the present measured cross sections are given as follows: counting statistics (≤5%), isotopic abundance (≤1%), detector efficiency (≤4%), the weight of samples (≤0.01%), reference cross section (≤1%), and self-absorption of γ-ray (≤1%). The uncertainties due to the other sources are very small and neglected in measured cross sections.Parameters 121Sb $(n,2n)$ 120Sbm

123Sb $(n,2n)$ 122Sb

$ \left\langle{{E}_{n}}\right\rangle $ =12.50 (MeV)

$ \left\langle{{E}_{n}}\right\rangle $ =15.79 (MeV)

$ \left\langle{{E}_{n}}\right\rangle $ =18.87 (MeV)

$ \left\langle{{E}_{n}}\right\rangle $ =12.50 (MeV)

$ \left\langle{{E}_{n}}\right\rangle $ =15.79 (MeV)

$ \left\langle{{E}_{n}}\right\rangle $ =18.87 (MeV)

${\sigma }_{\rm Al}$ 

2.838 3.498 12.289 9.172 9.218 2.740 ${C}_{\rm Sb}$ 

22.657 32.923 17.691 23.466 28.323 15.095 ${AM}_{\rm Sb}$ 

0.070 0.099 0.105 0.112 0.128 0.115 ${\lambda }_{\rm Sb}$ 

2.963 4.232 5.993 9.353 10.802 9.289 $ {W}_{\rm Al} $ 

6.367 11.925 15.842 27.435 39.282 3.533 $ {I\gamma }_{\rm Al} $ 

0.170 0.239 0.253 0.549 0.629 0.565 $ {\varepsilon }_{\rm Al} $ 

17.450 24.512 26.051 56.392 64.596 58.090 $ {C}_{\rm Al} $ 

31.208 77.626 31.804 100.852 204.565 70.918 $ {AM}_{\rm Al} $ 

0.472 0.663 0.705 1.525 1.747 1.571 $ {\lambda }_{\rm Al} $ 

1.117 2.063 3.128 3.608 5.438 6.684 $ {W}_{\rm Sb} $ 

8.504 23.850 9.505 27.480 62.852 2.120 $ {Abun}_{\rm Sb} $ 

0.212 0.298 0.317 0.683 0.782 0.703 $ {I\gamma }_{\rm Sb} $ 

0.006 0.009 0.010 2.465 2.823 2.539 $ {\varepsilon }_{\rm Sb} $ 

15.010 21.085 22.408 37.983 43.509 39.127 Table 9.Partial uncertainties in various parameters to obtain the121Sb
$ (n,2n) $ 120Sbmand123Sb$ (n,2n) $ 122Sb reactions cross section. -
There are no evaluation cross sections in the database of IAEA for the121Sb
$ (n, 2n) $ 120Sbm,121Sb$ (n, 2n) $ 120Sbg,123Sb$ (n, 2n) $ 122Sbmand123Sb$ (n, 2n) $ 122Sbgreactions. The results of the present measurements with cross sections at neutron energies of 12.50, 15.79 and 18.87 MeV are plotted inFigs. 4(a) and5(c) along with all other reported data. We can see fromFigs. 4(c) and5(c) that the trends of these evaluation excitation curves of JEFF-3.3, TENDL-2019, JENDL/AD-2017 and ENDF/B-VIII.0 are not the same.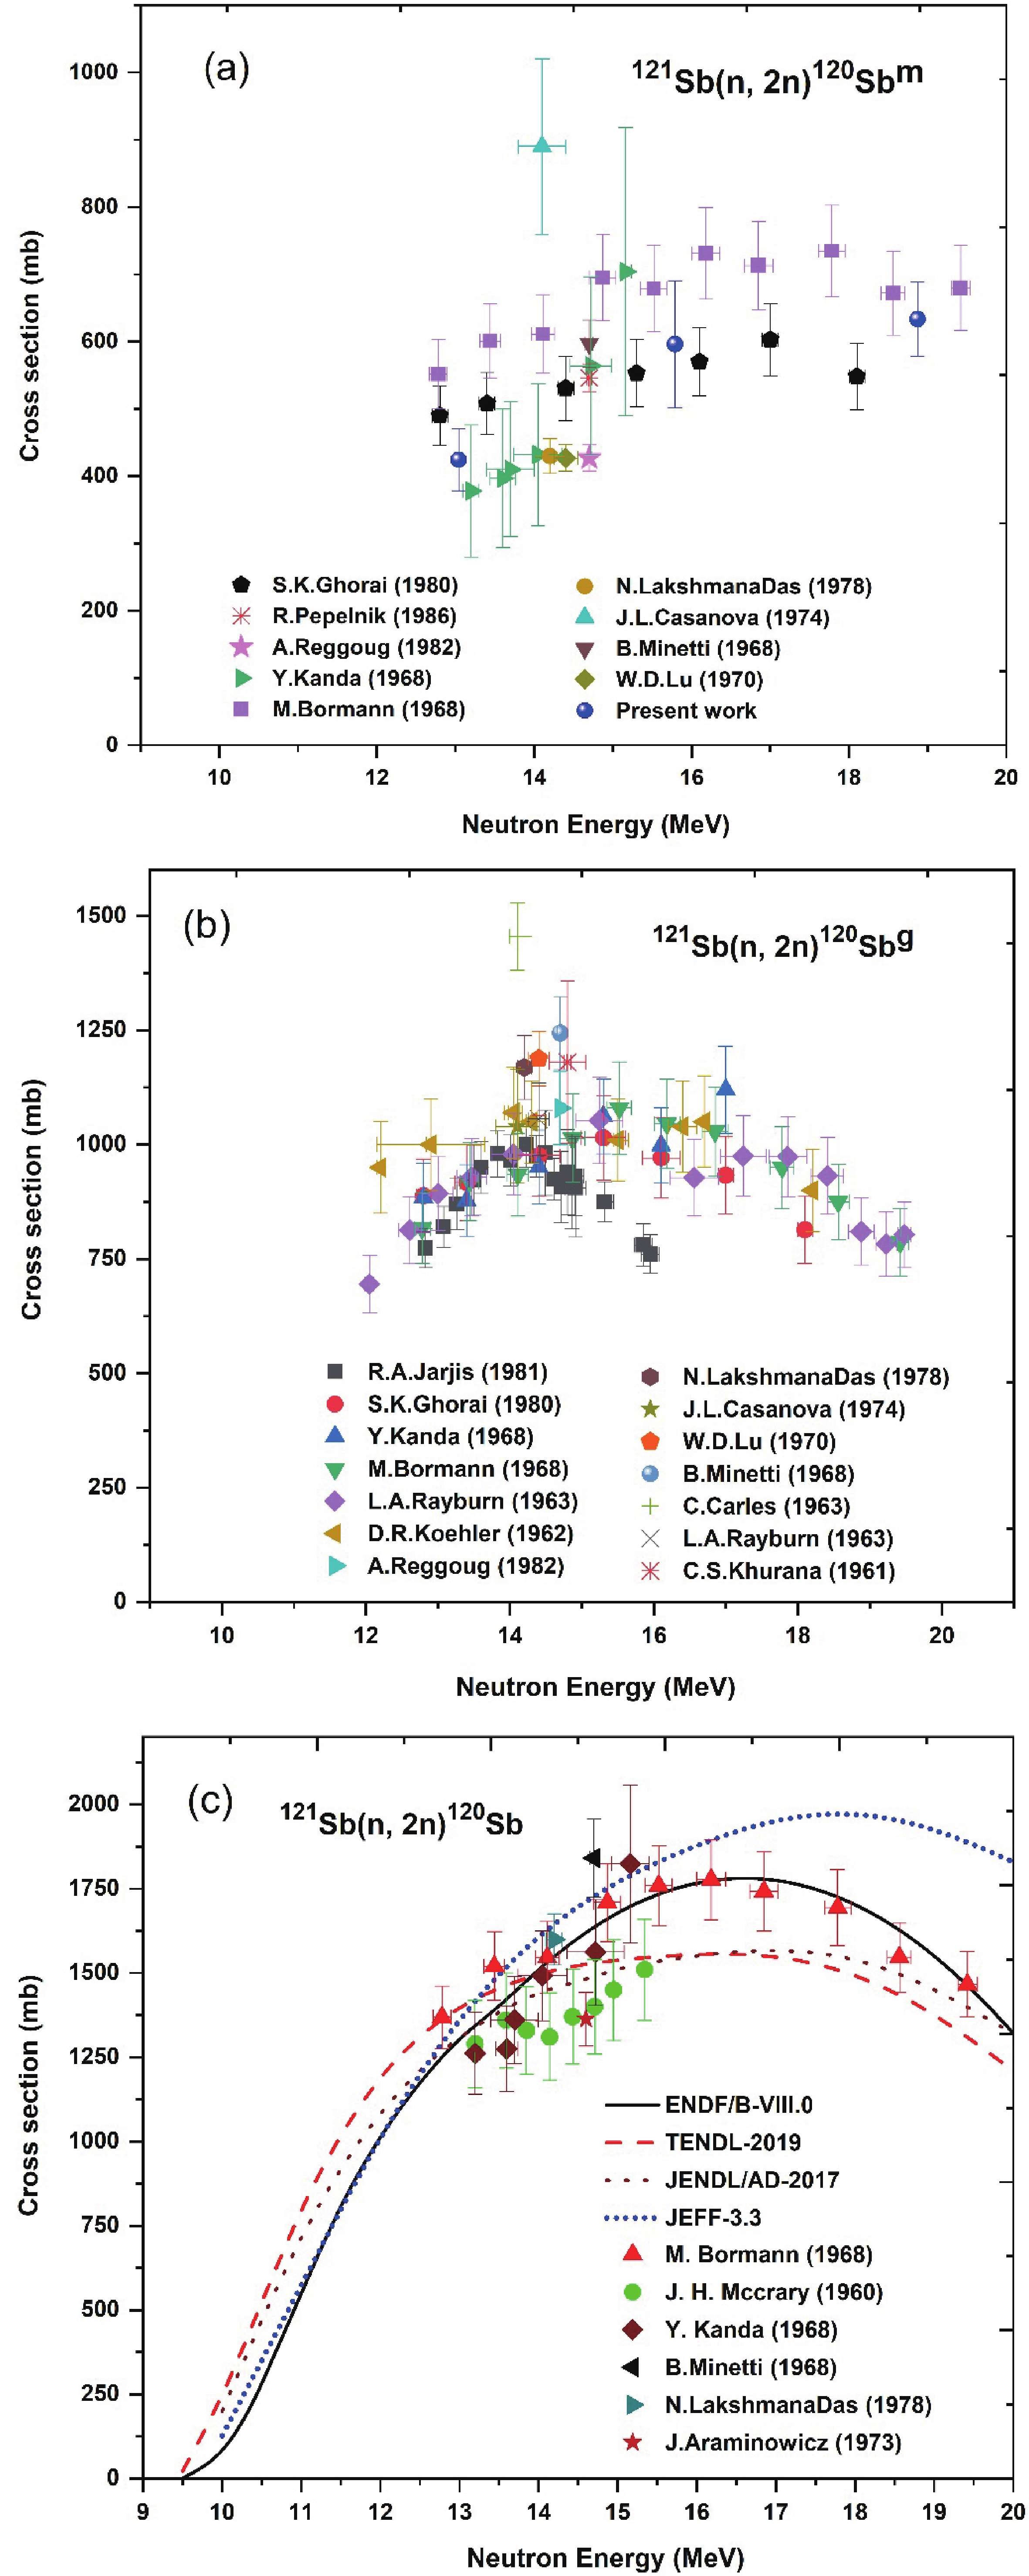
Figure 4.(color online) Comparison of existing literature and evaluated data of the121Sb
$ (n, 2n) $ 120Sbm,121Sb$ (n, 2n) $ 120Sbgand121Sb$ (n,2n) $ 120Sb reactions.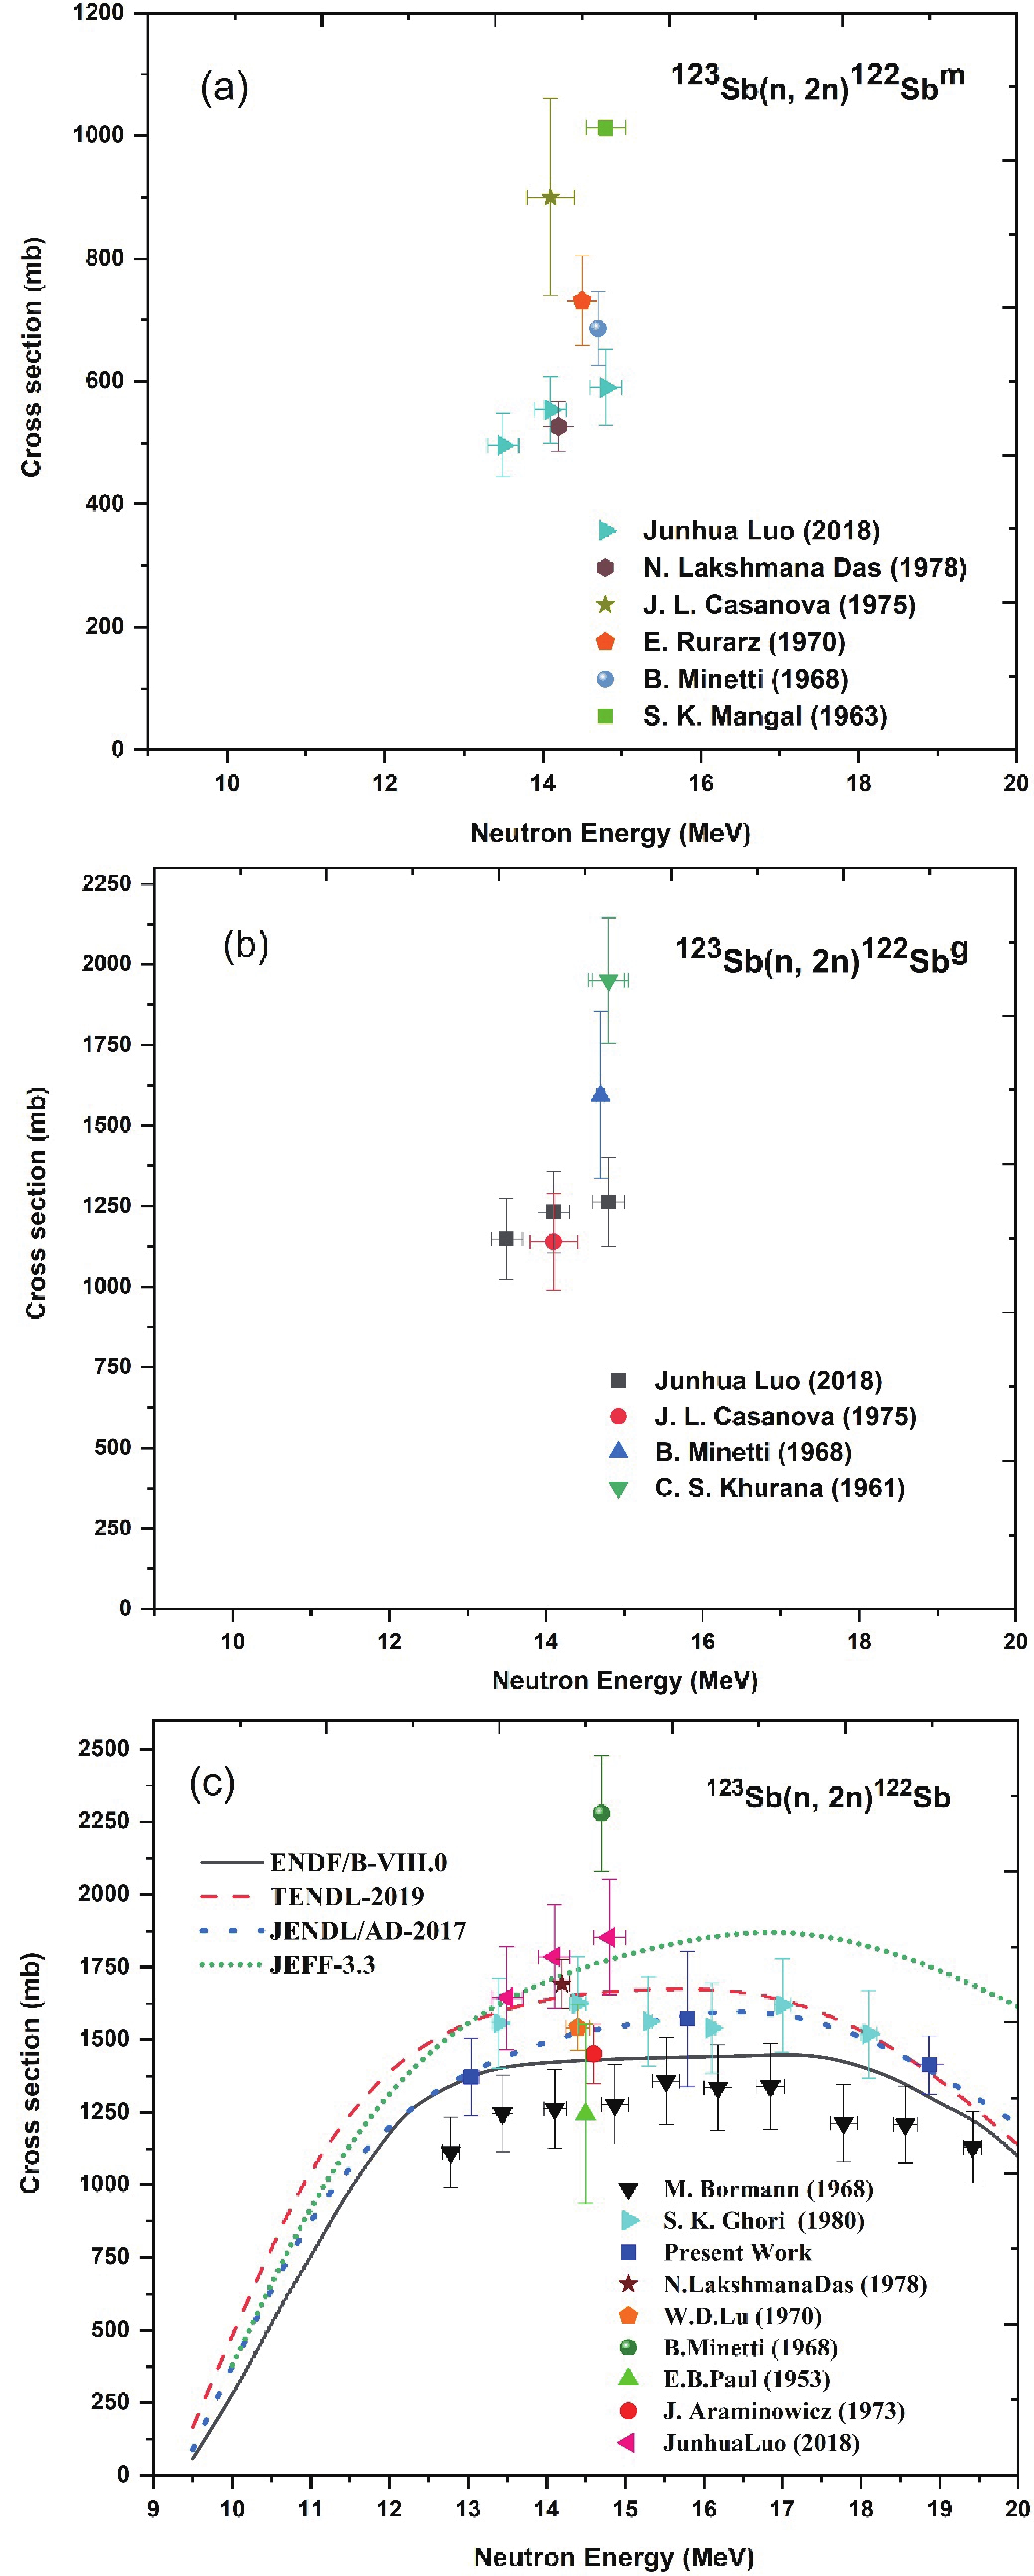
Figure 5.(color online) Comparison of existing literature and evaluated data of the123Sb
$ (n, 2n) $ 122Sbm,123Sb$ (n, 2n) $ 122Sbgand123Sb$ (n,2n) $ 122Sb reactions.For the isomeric state cross section fromFig. 4(a), our results are higher than those obtained by N. L. Daset al.[54], W. D. Luet al.[55] and A. Reggouget al.[66]. At 15.79 and 18.87 MeV, the present measured data are in agreement with the results of S. K. Ghoraiet al.[56] and M. Bormannet al.[59] within experimental uncertainties. In contrast, at 12.50 MeV, the present data lies between the data of S. K. Ghoraiet al.[56] and Y. Kanda [65]. In addition, for the isomeric state the cross section values of J. L Casanova [62] is much higher than the present measured cross section. Similarly, the reported measurements of the various experiments for the121Sb
$ (n, 2n) $ 120Sbgreaction agree very well except for some of the reported data by R. A. Jarjis [60] and C. Carles [69] as shown inFig. 4(b).It can be seen fromFig. 4(c) that in the 14 to 20 MeV energy range, results of N. L. Daset al.[54], M. Bormannet al.[59] and Y. Kanda [65] are consistent with the result of ENDF/B-VIII.0 evaluation for the121Sb
$ (n, 2n) $ 120Sb reaction. In addition, the JENDL/AD-2017 and TENDL-2019 evaluations agree with the reported data of J. H. Mccraryet al.[63] and Y. Kanda [65] at higher energies within experimental uncertainties. The cross section predicted by the JEFF-3.3 library is too large in the 15 MeV energy region and agrees very well with lower energy data of N. L. Daset al.[54], B. Minettiet al.[57] and M. Bormannet al.[59].It is observed that, for the123Sb
$ (n, 2n) $ 122Sbmand123Sb$ (n, 2n) $ 122Sbgreactions, experimental data exist within 13–16 MeV neutron energies. The reported experimental results of J. L. Casanova [62], E. Rurarzet al.[72] and S. K. Mangalet al.[73] are slightly higher than N. L. Daset al.[54] and J. Luoet al.[61] for the isomeric state. However, the data of J. Luoet al.[61] is in agreement with N. L. Daset al.[54] as shown inFig. 5(a). Similarly, we can see fromFig. 5(b) that for the ground state, the results of B. Minettiet al.[57] and C. S. Khuranaet al.[70] are slightly higher than the J. Luoet al.[61] and J. L. Casanova [62]. However, the results of J. Luoet al.[61] are consistent with J. L. Casanova [62] within experimental error.FromFig. 5(c), we can be seen that in the 13 to 19 MeV energy range our data at 12.50, 15.79 and 18.87 MeV are consistent with the result of the JENDL/AD-2017 evaluation for the123Sb
$ (n, 2n) $ 122Sb reaction. At 15.79 and 18.87 MeV, the present measured data are in agreement with the results of the TENDL-2019 evaluation, whereas at 12.50 MeV the present measurement data are in agreement with the ENDF/B-VIII.0 evaluation, as we can see fromFig. 5(c). However, the results of W. D. Luet al.[55] and S. K. Ghoraiet al.[56] are in agreement with the result of the JENDL/AD-2017 evaluation within experimental uncertainties. Similarly, the results of N. L. Daset al.[54] and J. Luoet al.[61] agree very well with the JEFF-3.3 evaluation. -
The different semi-empirical formulae for calculating neutron-induced reaction cross sections such as
$ \left(n,p\right),\left(n,2n\right),\left(n,\alpha \right)~~\mathrm{a}\mathrm{n}\mathrm{d}~~\left(n,t\right) $ reactions are developed by various authors for incident neutron energies around 14 to 15 MeV. The experimental cross section of neutron-induced reactions is given by the relation,$ \sigma \left(n,x\right)=C{\sigma }_{ne}{e}^{as}, $

(13) whereCandaare the fitting parameters for different reactions obtained by the least square method,sis the asymmetry parameter
$ s=\left(N-Z\right)/\left(A\right) $ and$ {\sigma }_{ne} $ is the non-elastic cross section. These non-elastic cross sections have been measured for many nuclei, varying with the atomic mass of the nuclei. The semi-empirical formulae for the$ \left(n,2n\right) $ cross section developed by the authors Chatterjee [28], Lu and Fink [29], Luo [30], Bychkov [31] and Habbani [32] within 14 to 15 MeV energies are given inTable 10. All semi-empirical formulae developed by various authors are exponentially dependent on the mass number A, the neutron number N and proton number Z of the target nucleus. We have calculated neutron-induced$ \left(n,2n\right) $ reaction cross sections for the121Sb and123Sb isotopes from systematic formulae, and calculated values are given inTable 11. The cross section data from these formulae are essential in nuclear reaction theories, medical accelerators, and the designing and shielding of advanced reactors.Authors The formulae for $ (n, 2n) $ cross section

Mass region Ref. Chatterjee ${\sigma }_{n,2n}=31.39{\left({A}^{\frac{1}{3} }+1\right)}^{2}\exp\left(\dfrac{1.706\left(N-Z\right)}{A}\right)$ 

45 $ \le $ A

$ \le $ 238

[28] Lu and Fink ${\sigma }_{n,2n}=45.76{\left({A}^{\frac{1}{3} }+1\right)}^{2}\left[1-7.372\exp\left(\dfrac{-32.21\left(N-Z+1\right)}{A}\right)\right]$ 

28 $ \le $ Z

$ \le $ 82

[29] Luo ${\sigma }_{n,2n}=0.0226{\left({A}^{\frac{1}{3} }+1\right)}^{2}\exp\left(\dfrac{133.86\left(N-Z\right)}{A}-\dfrac{ {779.47\left(N-Z\right)}^{2} }{ {A}^{2} }+\dfrac{ {1500.51\left(N-Z\right)}^{3} }{ {A}^{3} }\right)$ 

23 $ \le $ A

$ \le $ 209

[30] Bychkov ${\sigma }_{n,2n}=8.7\left(A+100\right)\left[1-0.88\exp\left(\dfrac{-7.95\left(N-Z\right)}{A}\right)\right]$ 

45 $ \le $ A

$ \le $ 238

[31] Habbani ${\sigma }_{n,2n}=23.53{\left({A}^{\frac{1}{3} }+1\right)}^{2}\exp\left(3.5\dfrac{\left(N-Z\right)}{A}\right)$ 

45 $ \le $ A

$ \le $ 209

Odd A[32] ${\sigma }_{n,2n}=20.82{\left({A}^{\frac{1}{3} }+1\right)}^{2}\exp\left(3.76\dfrac{\left(N-Z+1\right)}{A}\right)$ 

48 $ \le $ A

$ \le $ 238

Even A[32] Table 10.Systematic formulae for
$ (n, 2n) $ reaction cross section given by different authors.Authors 121Sb $ (n, 2n) $ 120Sb

123Sb $ (n, 2n) $ 122Sb

Chatterjee 1410 1458 Lu and Fink 1519 1569 Luo 1568 1626 Bychkov 1369 1440 Habbani 1360 1442 JENDL/AD-2017 1471 1533 ENDF/B-VIII.0 1607 1430 TENDL-2019 1524 1659 JEFF-3.3 1621 1709 EXFOR 1364 1853 Table 11.The
$ (n, 2n) $ reaction cross sections for121Sb and123Sb isotopes estimated using systematic formulae.The cross sections of the121Sb
$ (n,2n) $ 120Sb and123Sb$ (n,2n) $ 122Sb reactions were calculated from the systematic formulae, and the obtained values are given inTable 11. It is observed that$ (n, 2n) $ reaction cross sections obtained from formulae of Chatterjee and Bychkov agree with literature data of J. H. Mccraryet al.[63] and J. Araminowiczet al.[64] for the121Sb$ (n,2n) $ 120Sb reaction, and with data of J. Araminowiczet al.[64] for the123Sb$ (n,2n) $ 122Sb reaction. Similarly, the cross sections obtained from the formulae of Luo and Lu and Fink are in agreement with literature data of Y. Kanda [65] for the121Sb$ (n,2n) $ 120Sb reaction and data of W. D. Luet al.[55] and S. K. Ghoraiet al.[56] for the123Sb$ (n,2n) $ 122Sb reaction. In contrast, the$ (n, 2n) $ reaction cross sections obtained from the Habbani formulae are much lower compared to other formulae and do not agree with the available literature data of121Sb and123Sb isotopes. -
Different theoretical models have been developed in nuclear physics to understand the compound nucleus, pre-equilibrium and direct nuclear reaction mechanisms. Theoretical calculations of the121Sb
$ \left(n,2n\right) $ 120Sbm,121Sb$\left(n, $ $ 2n\right)$ 120Sbgand121Sb$ \left(n,2n\right) $ 120Sb reactions as well as for the123Sb$ \left(n,2n\right) $ 122Sbm,123Sb$ \left(n,2n\right) $ 122Sbgand123Sb$ \left(n,2n\right) $ 122Sb reactions cross section were performed by the statistical nuclear reaction codes TALYS (ver. 1.9) [13] and EMPIRE (ver. 3.2.2) [14]. In both codes, different nuclear level density, pre-equilibrium models and other input parameters are given, and these parameters were used to calculate the$ (n,2n) $ reaction cross sections. -
In the EMPIRE code, the theoretical calculations of the compound nucleus (CN) particles and γ-ray emission were described by the statistical theory of Hauser–Feshbach [33] and the width fluctuation correction for this neutron-induced reaction was considered using the Hofmann–Richert–Tepel–Weidenmuller (HRTW) model [34]. Different nuclear level density models were chosen to calculate the
$ (n, 2n) $ reaction cross sections. The optical model parameters given by Koning and Delaroche [35] for neutrons and protons were used from the Reference Input Parameters Library (RIPL-3) [36] database. The exciton model code PCROSS developed by Kalbach [37] was used to study the pre-equilibrium contribution in the reaction cross section. Further, the pre-equilibrium contribution in the cross section was obtained by the theories of quantum-mechanical pre-equilibrium models multistep compound (MSC) and multistep direct (MSD) [38–39]. The direct reaction was described by coupled channel calculations using an optical potential (ECIS code in DR). The γ-ray strength function was described by the Brink–Axel model [40–41], except for E1, where the empirical model of Kopecky and Uhl was used for calculation [42]. In EMPIRE code, phenomenological EMPIRE-specific level density (ESLM) [47], Gilbert–Cameron (GCM) [46] and generalized superfluid (GSM) [49,50] level density models were used for the cross section calculations. The generalized superfluid model used BCS theory in the low energy region and the Fermi-gas model (FGM) in the high energy region. The Gilbert–Cameron nuclear level density model utilized the constant temperature model (CTM) in the low energy region and the FGM in the high energy region. The generalized superfluid model includes deformation effects by an empirical parameterδconsidered in the moment of inertia. The third level density based on the Hartree–Fock Bogoliubov microscopic model (HFBM) was also used for cross section estimation [53]. -
Furthermore, calculations with statistical nuclear reaction code TALYS (ver. 1.9) [12] were performed to analyse and predict nuclear reactions. This code simulates the nuclear reactions that involve neutrons, protons, photons, deuterons, tritons and α-particles in the energy range from 1 keV to 200 MeV with mass of target nuclei 12 and heavier. The CN cross section was calculated considering the Hauser–Feshbach theory [33] and default Moldauer model [43–44], including width fluctuation correction in reactions. The Koning and Delaroche [35] phenomenological optical model local potential was used in the theoretical cross section calculations. The exciton model of Koning and Duijivestjin [45] was used to study the pre-equilibrium contribution in the reaction cross section. The γ-ray strength function (SF) was described by the Kopecky–Uhl generalized Lorentzian [42]. In the TALYS code, six different nuclear level density models are given and used for predicting the cross section at excitation energies where discrete level information is unavailable or incomplete. These models range from phenomenological analytical expressions to tabulated level densities derived from microscopic models. Three phenomenological level densities were suggested. The first is the constant temperature model (CTM) introduced by Gilbert and Cameron [46]. In this model, denoted ‘ldmodel 1’, the excitation energy divided into two parts: a lower energy region where the constant temperature law is applied and a higher energy region where the Fermi gas model is applied. ‘ldmodel 2’ is the back-shifted Fermi gas model (BFGM) [47], in which the Fermi gas expression is used in all energy region. ‘ldmodel 3’ is the generalized superfluid model (GSM), which considers superconductive pairing correlations according to the theory of the Barden–Cooper–Schrieffer — i.e., at low energy, paring correlations strongly influence the level density, and the high energy region is described by the Fermi gas model [48–50]. Similarly, three microscopic level density models were also suggested in the TALYS code. In ‘ldmodel 4’, for the RIPL database, S. Goriely has calculated level densities from drip line to drip line based on Hartree–Fock calculations for excitation energies up to 150 MeV and for spin values up toI= 30 [51]. In ‘ldmodel 5’, the calculations make coherent use of nuclear structure properties determined within a deformed Skyrme–Hartree–Fock Bogolyubov framework. Level densities for more than 8500 nuclei are made available in tabular format for excitation energies up to 200 MeV and for spin values up toJ= 49 [52]. ‘ldmodel 6’ is based on temperature-dependent Hartree–Fock Bogolyubov calculations using the Gogny force [53]. The relative feeding of the isomeric and ground states can be used as a ‘probe’ to investigate the spin distribution of the populated excited states of the compound nucleus. The spin cut-off parameter
$ {\sigma }_{F}^{2} $ represents the width of the angular momentum distribution of the level density and is given by the following equation,$ {\sigma }_{F}^{2}\left({E}_{x}\right)=0.01389({A}^{5/4}/\widehat{\alpha })\sqrt{\alpha U}\ , $

(14) whereAis the mass number,Uis the effective excitation energy defined asU= (Ex– Δ),Exis the true excitation energy and the energy shift Δ is an empirical parameter that is equal to, or for certain models, closely equivalent to, the pairing energy that is used to represent observed odd–even effects in nuclei. The parameterαis the energy-dependent level density parameter, which considers shell effects at low energies and the damping at higher excitation energy. When shell effects are absent, the parameter
$ \widehat{\alpha } $ is called the asymptotic level density parameter and is equal to theαparameter. The TALYS keyword “Rspincut” was modified (from the default value of 1.0) to reproduce the existing experimental data. This keyword represents a multiplication factor of the spin cut-off parameter$ {\sigma }_{F}^{2} $ . -
Statistical calculations were performed by the TALYS (ver. 1.9) and EMPIRE (ver. 3.2.2) codes using different level density and pre-equilibrium models. The experimental data obtained in the present work are discussed and compared with the literature data and results from the available evaluations: the TENDL-2019, JEFF-3.3, JENDL/AD-2017, and ENDF/B-VIII.0 databases. Due to the very small cross section of the
$ (n,\gamma ) $ reaction above the 9 MeV energy region, the small contribution to the γ-ray activity of products from the121Sb$ (n,\gamma ) $ 122Sb reaction can be neglected. In the present work, further study of the existing experimental cross section data for populating120Sb and122Sb ground and isomeric state as well as the total were also discussed and compared with the theoretical calculations obtained from the TALYS (ver. 1.9) and EMPIRE (ver. 3.2.2) codes. -
The theoretical calculations from the TALYS and EMPIRE codes utilizing different level density models were performed for the121Sb
$ (n, 2n) $ 120Sbm,121Sb$ (n, 2n) $ 120Sbgand121Sb$ (n, 2n) $ 120Sb reactions and results are demonstrated inFig. 6from threshold to 26 MeV neutron energies. Different statistical models were used in the TALYS and EMPIRE codes for the estimation of cross sections, and these models are included inTables 12and13.
Figure 6.(color online) Experimental data of the121Sb
$ (n,2n) $ 120Sbm,121Sb$ (n,2n) $ 120Sbgand121Sb$ (n,2n) $ 120Sb reactions and theoretical calculations from the TALYS and EMPIRE codes using different level density models.Optical model Level density models Pre-equilibrium models E1 γ-ray strength function model Koning–Delaroche
local OMPConstant temperature model
Back-shifted Fermi gas model
Generalized superfluid model
Goriely (microscopic model 1)
Goriely–Hilaire (microscopic model 2)
Goriely–Hilaire–Gogny force (microscopic model 3)preeqmode 2 Kopecky–Uhl generalized Lorentzian Table 12.Models and parameterization of the TALYS (ver. 1.9) code used to calculate
$ (n,2n) $ reaction cross section of121Sb and123Sb isotopes.Optical model Level density models Pre-equilibrium models E1 γ-ray strength function model Koning global potential Constant temperature model (GCM)
Generalized superfluid model (GSM)
Hartree–Fock–Bogoliubov model (HFBM)Exciton model calculations with code PCROSS,
quantum-mechanical pre-equilibrium models multistep compound (MSC) and multistep direct (MSD)Phenomenological Brink–Axel model Table 13.Models and parameterization of the EMPIRE (ver. 3.2.2) code used to calculate
$ (n,2n) $ reaction cross section of121Sb and123Sb isotopes.It can be seen that for the isomeric state the theoretical TALYS calculations based on three phenomenological level density models are in agreement with the results of N. L. Daset al.[54] and W. D. Luet al.[55]. However, our results at 12.50, 15.79 and 18.87 MeV and reported data [56–59] are much higher than those of the three phenomenological models for the121Sb
$ (n, 2n) $ 120Sbmreaction. The three phenomenological level density models for the121Sb$ (n, 2n) $ 120Sbgreaction are able to reproduce the reported experimental data very well within the experimental uncertainties.The TALYS calculations using microscopic level density models Goriely and Goriely–Hilaire for the121Sb
$ (n, 2n) $ 120Sbmreaction are able to reproduce the experimental data of S. K. Ghoraiet al.[56], B. Minettiet al.[57] and R. Pepelniket al.[58], within experimental uncertainties. It can be seen that, in the 13 to 18 MeV energy range, the results of S. K. Ghoraiet al.[56] and M. Bormannet al.[59] are consistent with the results of TALYS calculations using the microscopic level density model Goriely–Hilaire–Gogny for the isomeric state, whereas for the ground state the Goriely and Goriely–Hilaire level density models calculations are in agreement with the existing experimental data. In addition, for the isomeric state the TALYS calculation using microscopic level density model Goriely–Hilaire–Gogny overestimated the cross section and agreed with the lower energies data of S. K. Ghoraiet al.[56] and M. Bormannet al.[59]. In contrast, for the121Sb$ (n, 2n) $ 120Sbgreaction, this model underestimated the cross section within neutron energies from 11 to 22 MeV, and agreed only with R. A. Jarjis [60] at 16 MeV energies. The TALYS calculations using microscopic level density model Goriely for the isomeric state and phenomenological level density model back-shifted Fermi gas for the ground state show overall agreement with the present work and existing data, as shown inFigs. 6(a) and6(b).Furthermore, our results at 12.50, 15.79 and 18.87 MeV energies agree very well with the EMPIRE calculation using the ESLD level density model as plotted inFig. 6(a). However, the results of EMPIRE calculations using the GSM, GCM and HFBM level density models are in agreement with the reported data within experimental uncertainties for the121Sb
$ (n, 2n) $ 120Sbmreaction. Similarly, the EMPIRE calculation using the GCM level density model describes the data reasonably well for the ground state, as shown inFig. 6(b). In contrast, the experimental results of the121Sb$ (n, 2n) $ 120Sbgreaction are in agreement with the ESLD and HFBM models calculations, whereas the GSM model calculation agrees with the reported data. The measurements of the various experimenters agree very well with each other except for some of the measurements reported by R. A. Jarjis [60] and C. Carles [69] for the121Sb$ (n, 2n) $ 120Sbgreaction.However, for the results of the121Sb
$ (n,2n) $ 120Sb reaction, the theoretical calculations from the TALYS code based on the generalized superfluid and back-shifted Fermi gas models describe the data of J. H. Mccraryet al.[63], J. Araminowiczet al.[64], and the data of Y. Kanda [65] within the 13 to 14 MeV energy range. In contrast, the constant temperature model is able to describe the data of Y. Kanda [65] within the 14 to 15 MeV energy range, the data of J. H. Mccraryet al.[63] at 15.34 MeV and the lower-energy data of M. Bormannet al.[59]. In addition, the TALYS calculations based on the microscopic models agree very well with J. H. Mccraryet al.[63], J. Araminowiczet al.[64], and the data of Y. Kanda [65] within the 13 to 14 MeV energy range. The TALYS calculation using the Goriely–Hilaire–Gogny microscopic model is plotted inFig. 6(c).Furthermore, the EMPIRE calculation using the GSM is able to describe the data of N. L. Daset al.[54], M. Bormannet al.[59] for the121Sb
$ (n,2n) $ 120Sb reaction. In contrast, the EMPIRE calculations using the GCM and microscopic HFBM are able to describe the data of Y. Kanda [65] at 14.05 and 14.72 MeV and data of M. Bormannet al.[59] from 12.78 to 19.42 MeV energies within experimental uncertainties. The EMPIRE calculation using the GCM level density model describes the reported data as shown inFig. 6(c).The contribution of the cross sections from different reaction processes in the121Sb
$ (n,2n) $ 120Sb reaction were studied from threshold to 30 MeV neutron energies. It is observed that the contribution of the pre-equilibrium process increases with energy above 19 MeV. The contribution from the direct process is zero in reaction cross section and the compound nucleus process contributes maximum cross section. The more significant pre-equilibrium emission leads to a reduction in the compound nucleus emission. In order to investigate the effect of the pre-equilibrium emission at higher energies, theoretical calculations were performed using the EMPIRE code. Therefore, a more detailed comparison of the EMPIRE calculations using different pre-equilibrium and level density models for the121Sb$ (n,2n) $ 120Sb reaction are illustrated inFig. 6(c). In the present work, the two quantum-mechanical pre-equilibrium models (i) Multi-Step Compound (MSC), and (ii) Multi-Step Direct (MSD) were used to study the pre-equilibrium emission from the EMPIRE code along with generalized superfluid, Gilbert–Cameron and Hartree–Fock level density models. However, the results of the121Sb$ (n,2n) $ 120Sb reaction, the MSC pre-equilibrium model with a generalized superfluid, Gilbert–Cameron and Hartree–Fock level density models describe the data of M. Bormannet al.[59] up to 16 MeV. In contrast, the MSD pre-equilibrium model with a generalized superfluid, Gilbert–Cameron and Hartree–Fock level density models agree very well with the lower-energy data of the N. L. Daset al.[54], M. Bormannet al.[59] and Y. Kanda [65]. The best theoretical excitation curve for the121Sb$ (n,2n) $ 120Sb reaction with the MSD pre-equilibrium and the Gilbert–Cameron level density model is plotted inFig. 6(c). -
The existing experimental data of the123Sb
$ (n, $ $ 2n) $ 122Sbm,123Sb$ (n,2n) $ 122Sbgand123Sb$ (n,2n) $ 122Sb reactions and the theoretical calculations from the TALYS and EMPIRE codes using different level density models are illustrated inFig. 7from threshold to 26 MeV neutron energies. The different statistical models used in the calculations are included inTables 12and13.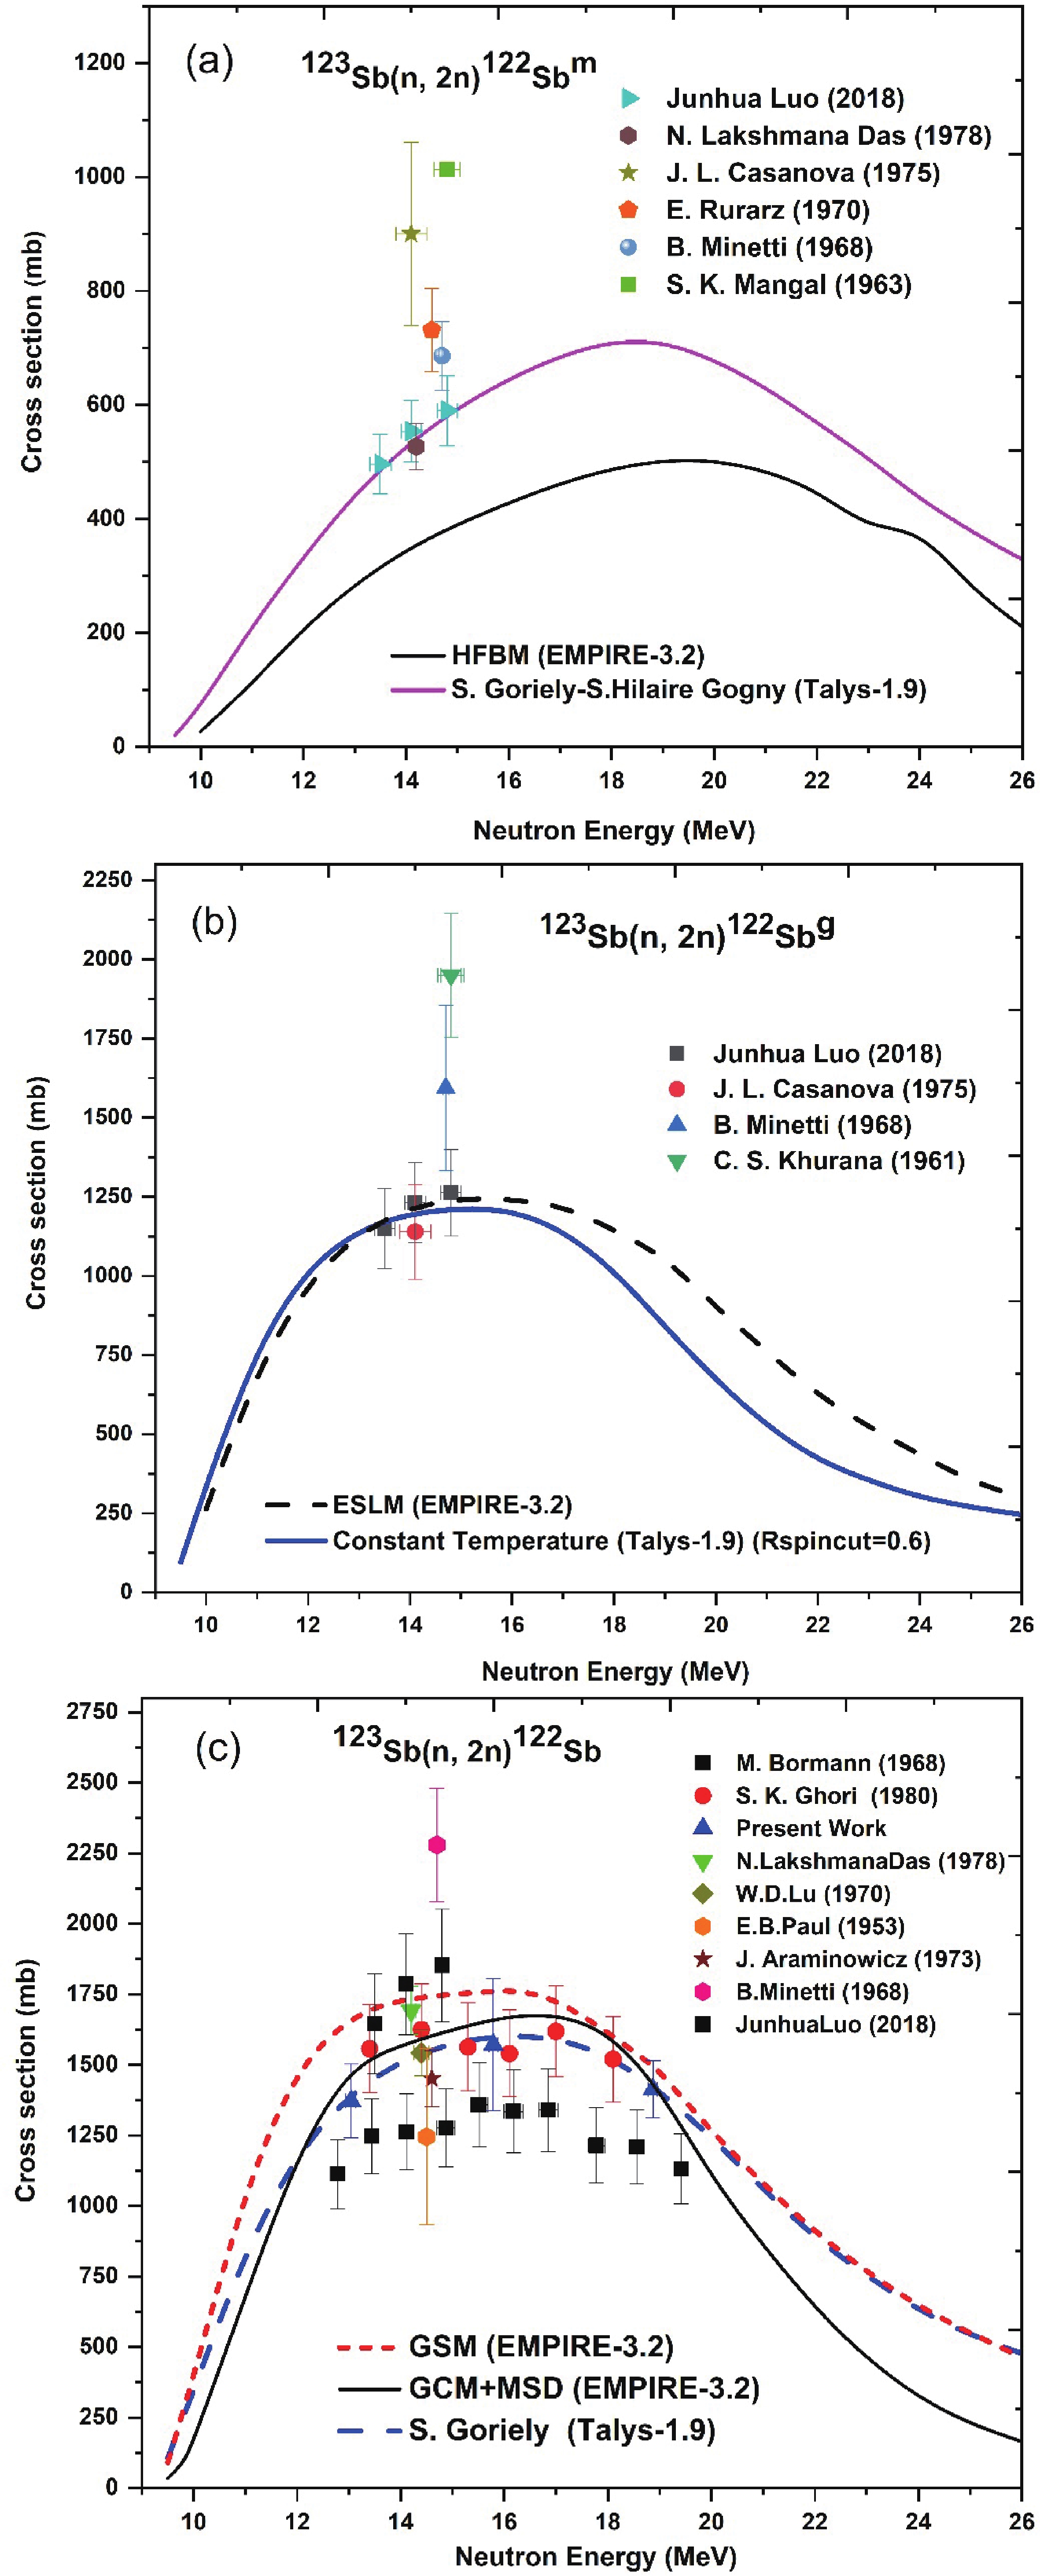
Figure 7.(color online) Experimental data of the123Sb
$ (n,2n) $ 122Sbm,123Sb$ (n,2n) $ 122Sbgand123Sb$ (n,2n) $ 122Sb reactions and theoretical calculations from the TALYS and EMPIRE codes using different level density models.It is observed that cross section for the isomeric state, the theoretical calculations from TALYS based on the three phenomenological level density models fail to reproduce the experimental data. In contrast, the TALYS calculations using three microscopic level density models are agree very well with the experimental data reported by J. Luoet al.[61] and N. L. Daset al.[54]. The microscopic calculation based on the Goriely–Hilaire–Gogny model is plotted inFig. 7(a).
However, for the cross section of the123Sb
$ (n,2n) $ 122Sbgreaction, the TALYS calculation based on the constant temperature level density model is less satisfactory for the literature data of J. Luoet al.[61] but agrees very well with the J. L. Casanova [62] for the default value 1.0 for the ‘Rspincut’ parameter. By reducing the value of ‘Rspincut’ to 0.6, this model is in agreement with the higher-energy data of J. Luoet al.[61] as shown inFig. 7(b). However, the results of TALYS calculations using the back-shifted Fermi gas and generalized superfluid level density models are lower than the experimental results. In addition, the TALYS calculations using three microscopic level density models fail to describe the experimental data for the ground state.The EMPIRE calculation using the ESLM level density model describes the123Sb
$ (n,2n) $ 122Sbgreaction cross section reasonably well, as shown inFig. 7(b). In contrast, the theoretical values from the EMPIRE using the GCM, GSM and HFBM level density models are much higher than experimental values. The reported cross sections of the123Sb$ (n,2n) $ 122Sbmreaction are much higher than those of the theoretical excitation curves from the EMPIRE code using the GCM, GSM and HFBM level density models. The results of the EMPIRE calculation using the HFBM model is plotted inFig. 7(a).The measured cross sections for the123Sb
$ \left(n,2n\right) $ 122Sb reaction at neutron energies of 12.50, 15.79 and 18.87 MeV and the results of the TALYS and EMPIRE calculations using different level density models are plotted inFig. 7(c), and measured values are given inTable 3. The theoretical calculations from the TALYS code based on the phenomenological level density models describe the data of W. D. Luet al.[55], and S. K. Ghoraiet al.[56] within the 15 to 16 MeV energy range. In contrast, the TALYS calculations based on the microscopic level density models Goriely and Goriely–Hilaire agrees very well with W. D. Luet al.[55], and S. K. Ghoraiet al.[56], whereas the calculations based on microscopic level density model Goriely–Hilaire–Gogny is in agreement with the lower-energy data of M. Bormannet al.[59], J. Arminowiczet al.[64] and with the higher-energy data of S. K. Ghoraiet al.[56]. Further, the EMPIRE calculation using the GSM model is shown inFig. 7(c), and it is observed that the generalized superfluid model is in agreement with J. Luoet al.[61]. In contrast, the EMPIRE results of the Gilbert–Cameron and Hartree–Fock level density models are consistent with N. L. Daset al.[54] and the lower-energy data of S. K. Ghoraiet al.[56].The contribution of the cross sections from different reaction processes in the123Sb(n, 2n)122Sb reaction were studied from threshold to 30 MeV neutron energies. It is observed that the contribution of the pre-equilibrium process increases with energy above 19 MeV. The contribution from the direct process is zero in the reaction cross section and the compound nucleus process contributes maximum cross section. The more significant pre-equilibrium emission leads to a reduction in the CN emission. In order to investigate the effect of the pre-equilibrium emission at higher energies, theoretical calculations were performed with the EMPIRE code. Therefore, a more detailed comparison of the EMPIRE calculations using different pre-equilibrium and level density models for the123Sb
$ (n,2n) $ 122Sb reaction are illustrated inFig. 7(c). In the present work, two quantum-mechanical pre-equilibrium models (i) Multi-Step Compound (MSC) and (ii) Multi-Step Direct (MSD) were used to study the pre-equilibrium emission from the EMPIRE code along with generalized superfluid, Gilbert–Cameron and Hartree–Fock level density models. However, for the results of the123Sb$ (n,2n) $ 122Sb reaction, the MSC pre-equilibrium model with a generalized superfluid, Gilbert–Cameron and Hartree–Fock level density models are able to describe the data of J. Luoet al.[61]. In contrast, the MSD pre-equilibrium model with a generalized superfluid, Gilbert–Cameron and Hartree–Fock level density models agree very well with the data of N. L. Daset al.[54], W. D. Luet al.[55] and S. K. Ghoraiet al.[56] within experimental uncertainties, as shown inFig. 7(c). -
The isomeric pair120Sbm,gand122Sbm,gare formed in the
$ (n,2n) $ reaction on121Sb and123Sb isotopes. The EMPIRE and TALYS codes were used to calculate the isomeric to ground state cross section ratio$ \left({\sigma }_{m}/{\sigma }_{g}\right) $ theoretically. This ratio is low at low energies and increases as the incident particle energy increases, resulting in an increase in the population of high spin levels of the compound nucleus. The reported experimental data and theoretical results of the TALYS and EMPIRE calculations based on the different level density models are shown together inFigs. 8(a) and8(b).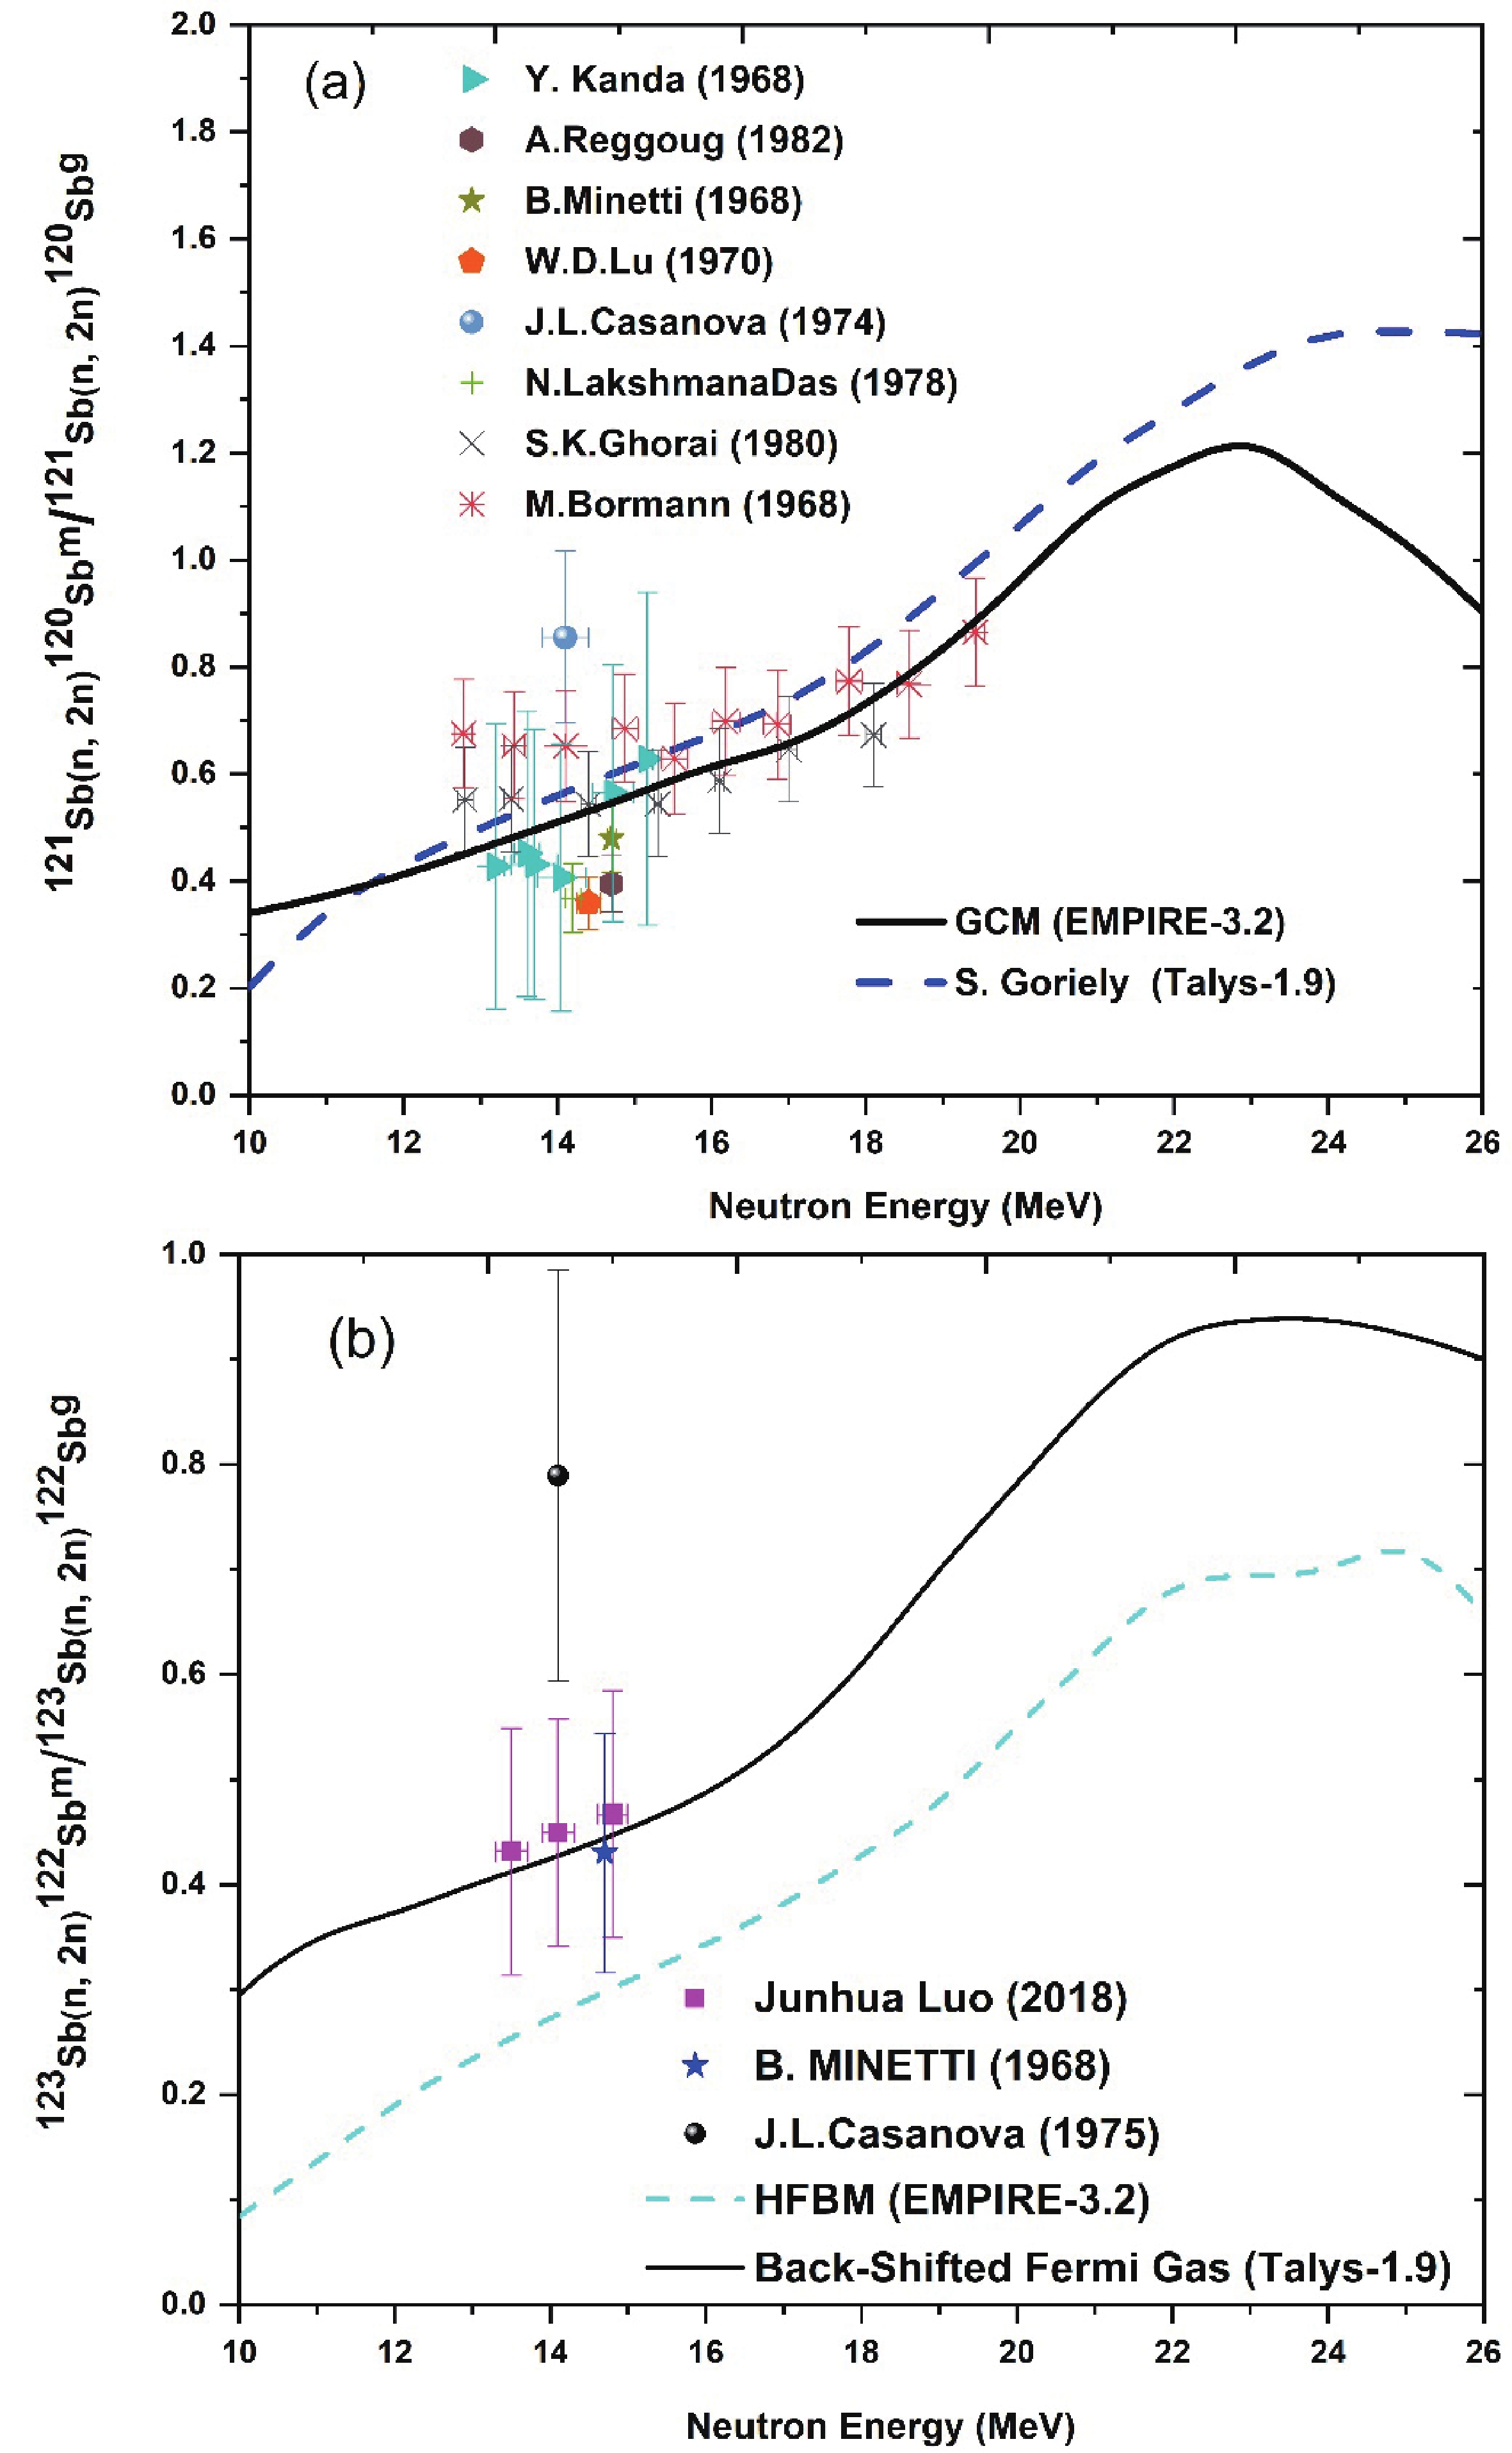
Figure 8.(color online) Isomeric cross section ratio
$ \left({\sigma }_{m}/{\sigma }_{g}\right) $ and theoretical calculations from the TALYS and EMPIRE codes using different level density models.For the isomeric pair120Sbm,g, theTALYS calculations using three phenomenological level density models are in agreement with the experimental data of W. D. Luet al.[55], Y. Kanda [65] and A. Reggouget al.[66] in the lower-energy region, whereas in the higher-energy region the calculated isomeric cross section ratio retains the trend of underestimating. In contrast, the TALYS calculations based on the microscopic level density models Goriely and Goriely–Hilaire reproduce the higher-energy data of M. Bormannet al.[59] and the lower-energy data of S. K. Ghoraiet al.[56] and Y. Kanda [65] within experimental uncertainties, whereas the microscopic level density models of Goriely–Hilaire–Gogny overestimated the isomeric cross section ratio in higher-energy regions and agreed only with the lower-energy data of M. Bormannet al.[59] and J. L. Casanova [62].
However, the theoretical isomeric cross section ratio from the EMPIRE code based on the GSM, GCM and HFBM level density models are in agreement with the S. K. Ghoraiet al.[56], Y. Kanda [65] and the higher-energy data of M. Bormannet al.[59] within experimental uncertainties. The results show that the TALYS and EMPIRE calculations using the GCM and Goriely level density models describe quite well the behaviour of isomeric cross section ratio, as shown inFig. 8(a).
It can be seen that, for the123Sb
$(n, 2n)$ 122Sbm/123Sb$ (n,2n) $ 122Sbgisomeric cross section ratio, literature data exist only in the energy region 13–15 MeV. The theoretical calculations from the TALYS code based on the three phenomenological level density models are in agreement with the data of B. Minettiet al.[57] and J. Luoet al.[61]. The results show that the back-shifted Fermi gas model describes the isomeric cross section ratio quite well, as shown inFig. 8(b). However, the TALYS calculations based on the three microscopic level density models does not reproduce the reported experimental data.The theoretical excitation curve from the EMPIRE calculation using the HFBM level density model is lower than the data of B. Minettiet al.[57], J. Luoet al.[61] and J. L. Casanovaet al.[62], as shown inFig. 8(b). However, the results of the GCM and GSM level density models does not reproduce the experimental data of the previous work.
-
The cross sections for the121Sb
$ \left(n,2n\right) $ 120Sbmand123Sb$ \left(n,2n\right) $ 122Sb reactions were measured using the neutron activation and offline γ-ray spectrometric techniques in the 13–19 MeV energy region relative to the27Al$ \left(n,\alpha \right) $ 24Na reference reaction. The present measured data and statistical cross sections from the TALYS and EMPIRE codes were compared with the previous literature data and evaluated JEFF-3.3, ENDF/B-VIII.0, JENDL/AD-2017 and TENDL-2019 libraries. A detailed analysis of uncertainties in efficiencies of the HPGe detector and present measured cross sections were studied by covariance analysis. In addition, the different authors’ formulae were used to systematically study the$ (n, 2n) $ reaction cross section of antimony isotopes. The formulae of Chatterjee, Bychkov Luo and Lu and Fink reproduce the cross sections very well except for the Habbani formula. The theoretical calculations of the$ (n, 2n) $ reaction cross sections for ground and isomeric states and the isomeric cross section ratio were performed using the statistical nuclear reaction codes TALYS (ver. 1.9) and EMPIRE (ver. 3.2.2). The calculated cross sections differ in magnitude only due to different nuclear inputs and different nuclear reaction models in the theoretical calculations. The emission of particles and photons in CN is the dominant reaction mechanism, just above the two-neutron emission threshold energy. The CN cross section depends on the OPs, NLDs, and γSFs statistical nuclear ingratiates. In conclusion, the cross section from the EMPIRE calculations differ only due to the difference between the generalized superfluid and Gilbert–Cameron level density models. This generalized superfluid level density model considered the deformation effect and played an essential role in describing the$ (n,2n) $ reaction cross section. We considered nuclear ingratiates OPs, level density, pre-equilibrium and γSFs for comparisons in the EMPIRE and TALYS calculations. It is shown that the two nucleon OPs of Koning and Delaroche give the same results. Similarly, for the γSFs, the phenomenological Brink–Axel model used in EMPIRE and Kopecky–Uhl generalized the Lorentzian model used in the TALYS code. It is safe to say that EMPIRE and the TALYS calculations differ only by using different theoretical models. The TALYS calculations at energies above 14 MeV saturated more rapidly compared to the EMPIRE calculation. It is observed that more experimental data are needed in the high-energy region to investigate the contribution of different reaction channels and to test the reliability of the theoretical calculations. The outcomes of the experiment discussed here will be used for the evaluation of nuclear data libraries, verification of nuclear reaction models, and other basic fundamental applications. -
The authors are thankful to the BARC-TIFR Pelletron accelerator facility staff for their support and help during the experiment. Special thanks to Rohan (BARC-TIFR target lab) for providing Li and Ta targets for the experiment. One of the authors (RKS) is thankful for the IUAC New Delhi financial assistance through a research project (IUAC/XIII.7/UFR-60321).
Systematic study of the (n, 2n) reaction cross section for121Sb and123Sb isotopes
- Received Date:2021-05-07
- Available Online:2022-05-15
Abstract:The cross sections of the121Sb


 DownLoad: