


 Abstract
 HTML
HTML Reference
 Related
 PDF
PDF


-
The neutron-induced light-charged particle emitting reactions of carbon in several tens of MeV neutron energy, i.e.,12C(n,lcp) reactions, can offer information about the nuclear structure, and their angle-differential cross section (hereinafter referred to as differential cross section) data are needed to test the nuclear reaction models [1,2]. Among these (n,lcp) reactions, deuteron production (12C(n,xd)) reactions are rather crucial because their differential cross sections are required for dose calculations in human tissues for fast neutron cancer therapy and cosmic-ray-induced neutrons considering the large amount of carbon in human tissues [1,3-8]. Meanwhile, charged particle production reactions are of great significance to nuclear detection. Taking carbon-based neutron detectors such as plastic scintillator detectors as an example [9], precise cross sections and differential cross sections of12C(n,xd) reactions are required in the simulation of the response of the detectors to fast neutrons. In addition, the cross sections of the12C(n,d0)11B and12C(n,d1)11B reactions were measured by Pillonet al. [10], and the cross section of the12C(n,d0)11B reaction was recently measured by Majerleet al. [11]. Diamond detectors were used in both measurements, which suggests that deuteron production reactions can contribute to the response of diamond detectors. This importance necessitates the study of the differential cross sections of13C(n,xd) reactions, which are referred to as12C(n,xd) reactions hereinafter in accordance with literature because of the dominance of12C over13C in abundance (98.93% vs 1.07%) [12].
However, the cross sections of the12C (n,xd) reactions are rather small, which creates difficulties in their measurement [13]. There are nine previous measurements [14], seven of which are in the several tens of MeV range: the works by Slypenet al. atEn= 29.5 to 72.8 MeV [13,15], as well as those by Subramanianet al. atEn= 27.4 to 60.7 MeV [16], Tippawanet al. atEn= 95.6 MeV [1], Bergenwallet al. atEn= 95.6 MeV [2], McNaughtonet al. atEn= 56.0 MeV [9], and Nauchiet al. atEn= 64.5 and 75.0 MeV [17] were all aimed at the measurement of the double differential cross sections of12C (n,xd) reactions, while the work by Younget al. forEn= 60.0 MeV [18] was aimed in particular at the measurement of the differential cross sections of the12C(n,d)11B reaction. All seven measurements under 100 MeV were carried out on7Li(p,n) mono-energetic neutron sources. The results from previous measurements agree in trend but relatively large discrepancies in magnitude exist in some of them. For example, McNaughton’s experimental data atEn= 56.0 MeV [9] are considerably larger than Slypen’s atEn= 55.3 [13] MeV and at forward deuteron angles. Brenneret al. carried out comprehensive theoretical calculations of double differential cross sections by using intranuclear cascade (INCA) code [19], and there are some discrepancies between the theoretical calculations and experimental results [13]. Therefore, more measurements are needed, especially measurements using a white neutron source, which can provide systematicness. The China Spallation Neutron Source (CSNS) Back-n white neutron source provides neutrons of a wide energy range, which is suitable for measurements of neutron-induced nuclear reaction data [20].
In the present work, differential cross sections of12C(n,xd) reactions relative to those ofn-pelastic scattering were measured at six neutron energies from 25 to 52 MeV. A graphite foil and a polyethylene foil were used as samples for the12C(n,xd) reactions and then-pscattering measurements, respectively. TheΔE-Etelescopes of the Light-charged Particle Detector Array (LPDA) system, each consisting of a Si-PIN detector (ΔEunit) and a CsI detector (Eunit) placed in the forward direction from 10.1° to 55.0° with respect to the incident neutron, were employed. Measurements of the carbon sample for the12C(n,xd) reactions and the polyethylene sample for then-pelastic scattering were performed. Ratios of the differential cross sections of the12C(n,xd) reactions to those of then-pscattering were measured, and then the differential cross sections of the12C(n,xd) reactions were obtained using the differential cross sections of then-pscattering [21] from the JENDL-4.0/HE-2015 library [22] as the standard.
-
The measurements were performed at Endstation #1 (ES#1) of the CSNS Back-n white neutron source [23]. Protons accelerated up to 1.6 GeV in the Rapid Cycling Synchrotron (RCS) impinged on a tungsten target with a repetition rate of 25 Hz and thus produce spallation neutrons. The Back-n beamline provided neutrons of a wide energy spectrum (from ~eV to higher than 100 MeV) while the interference of the charged particles emitted from the tungsten target was eliminated by the bending magnet. The neutron source operated in double-bunch mode, with the time width of each proton bunch ~43 ns, and the separation duration between the two proton bunches was 410 ns [24]. The beam power during the present experiment was 50 kW. The neutron flight path was 57.99 m from the source to the sample. The diameter of the neutron beam spot was approximately 15 mm, and the neutron flux was ~ 9.35×10⁵n/cm2/s. More details about the facility are presented in Ref. [25].
-
A picture of the samples and the sample holder is shown inFig. 1.
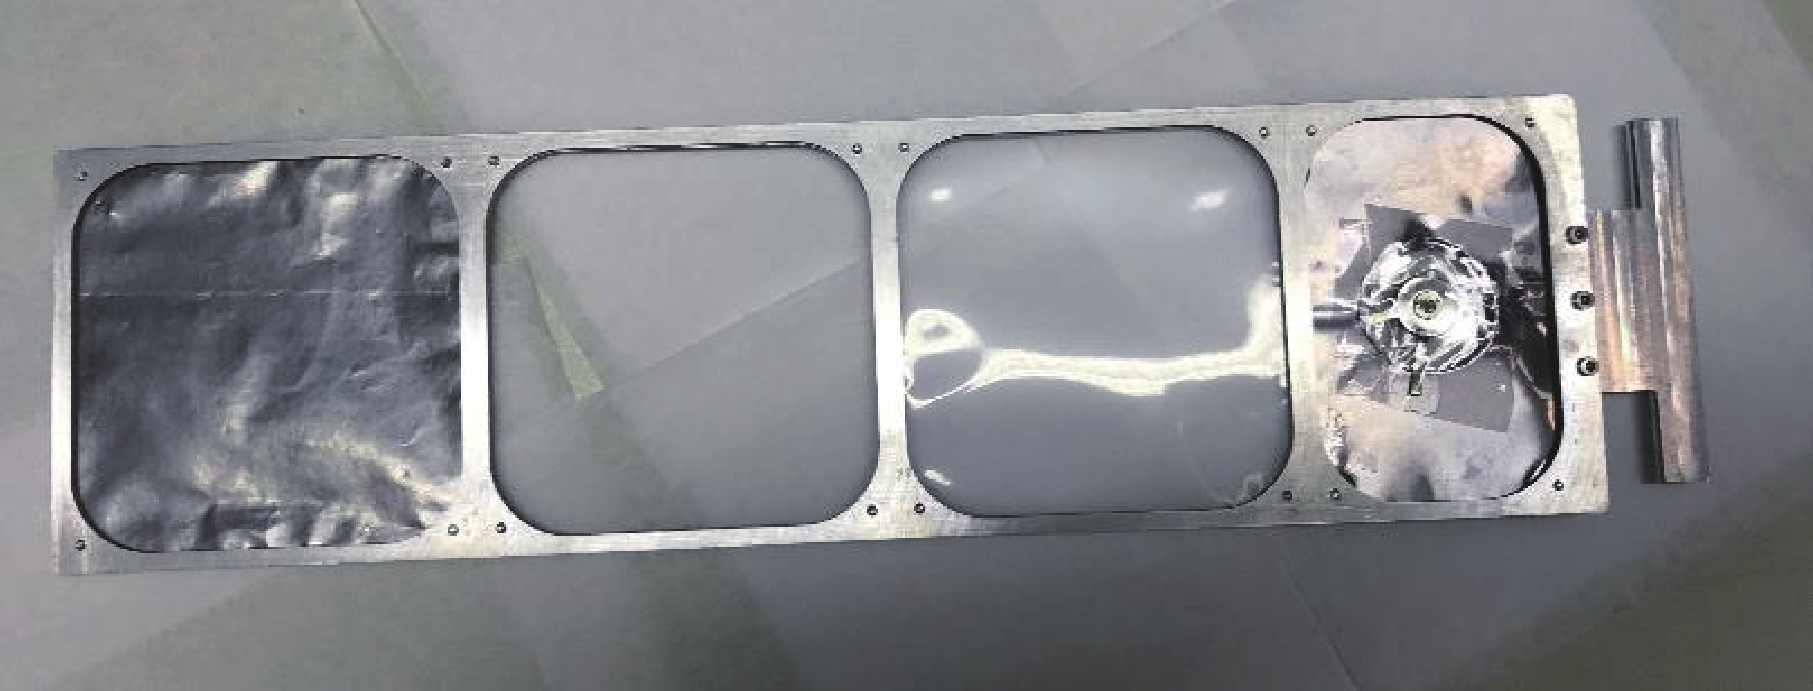
Figure 1.(color online) Samples and sample holder. From left to right: carbon sample, empty target, CH2sample, andαsources.
Four samples were used for the measurement: a high-purity graphite foil (carbon sample) of ~8.82 μg/cm2thickness for the foreground measurement of the12C(n,xd) reactions, a low-density polyethylene (CH2) sample of ~9.48 μg/cm2thickness for then-pscattering measurement, an empty target for instrumental and neutron beam background measurement, andαsources for signal tests for the detectors, their electronics, and the data acquisition (DAQ) system. Theαsources were back-to-back241Am sources, each with ~33 kBq activity. All the samples were mounted onto a customized aluminum holder, which has four sample positions. Three of them are rounded squares of 76.8 mm in side length for the graphite foil, empty target, and CH2sample, and one is a rectangle for theαsources. Therefore, the incident neutron beam spot was well covered by the sample (15 mm vs 76.8 mm).
-
The measurement of the charged particles was achieved using the LPDA detector system. A picture of the interior of the LPDA vacuum chamber and the configuration of the detectors are presented inFig. 2 (a)and(b), respectively. Ten sets ofΔE-Etelescopes of the LPDA system were used in the vacuum chamber. Each telescope is composed of a 300 μm-thick Si-PIN detector (ΔEunit) and a 30 mm-thick CsI scintillator (Eunit). The signals from each Si-PIN detector were amplified and pre-processed by a Mesytec MSI-8 amplifier [26], while the signals from each CsI detector were multiplied by a silicon photomultiplier (SiPM) [27] and then processed by a main amplifier. Detailed descriptions of the LPDA system and the electronics can be found in Refs. [28,29]. The telescopes were placed in the forward direction from 10.1° to 55.0° with respect to the incident neutron beamline. The telescopes at the anglesθL= 10.1°, 20.0°, …, 50.0° (denoted as L1, L2, …, L5) were placed on the left side of the neutron beamline while the other five sets of telescopes atθL= 15.1°, 25.1°, …, 55.0° (denoted as R1, R2, …, R5) were placed on the right. The distances between the centers of the detectors and the center of the sample are listed inTable 1. The detectors atθL= 10.1° andθL= 15.1° were located further away from the sample than the others to avoid the irradiation by the neutron beam. The solid angle and the average detection angle for each telescope were calculated from Monte Carlo simulation [30] and are listed inTable 1. Note that the surface of each sample was perpendicular to the direction of the incident neutron beam throughout the experiment.
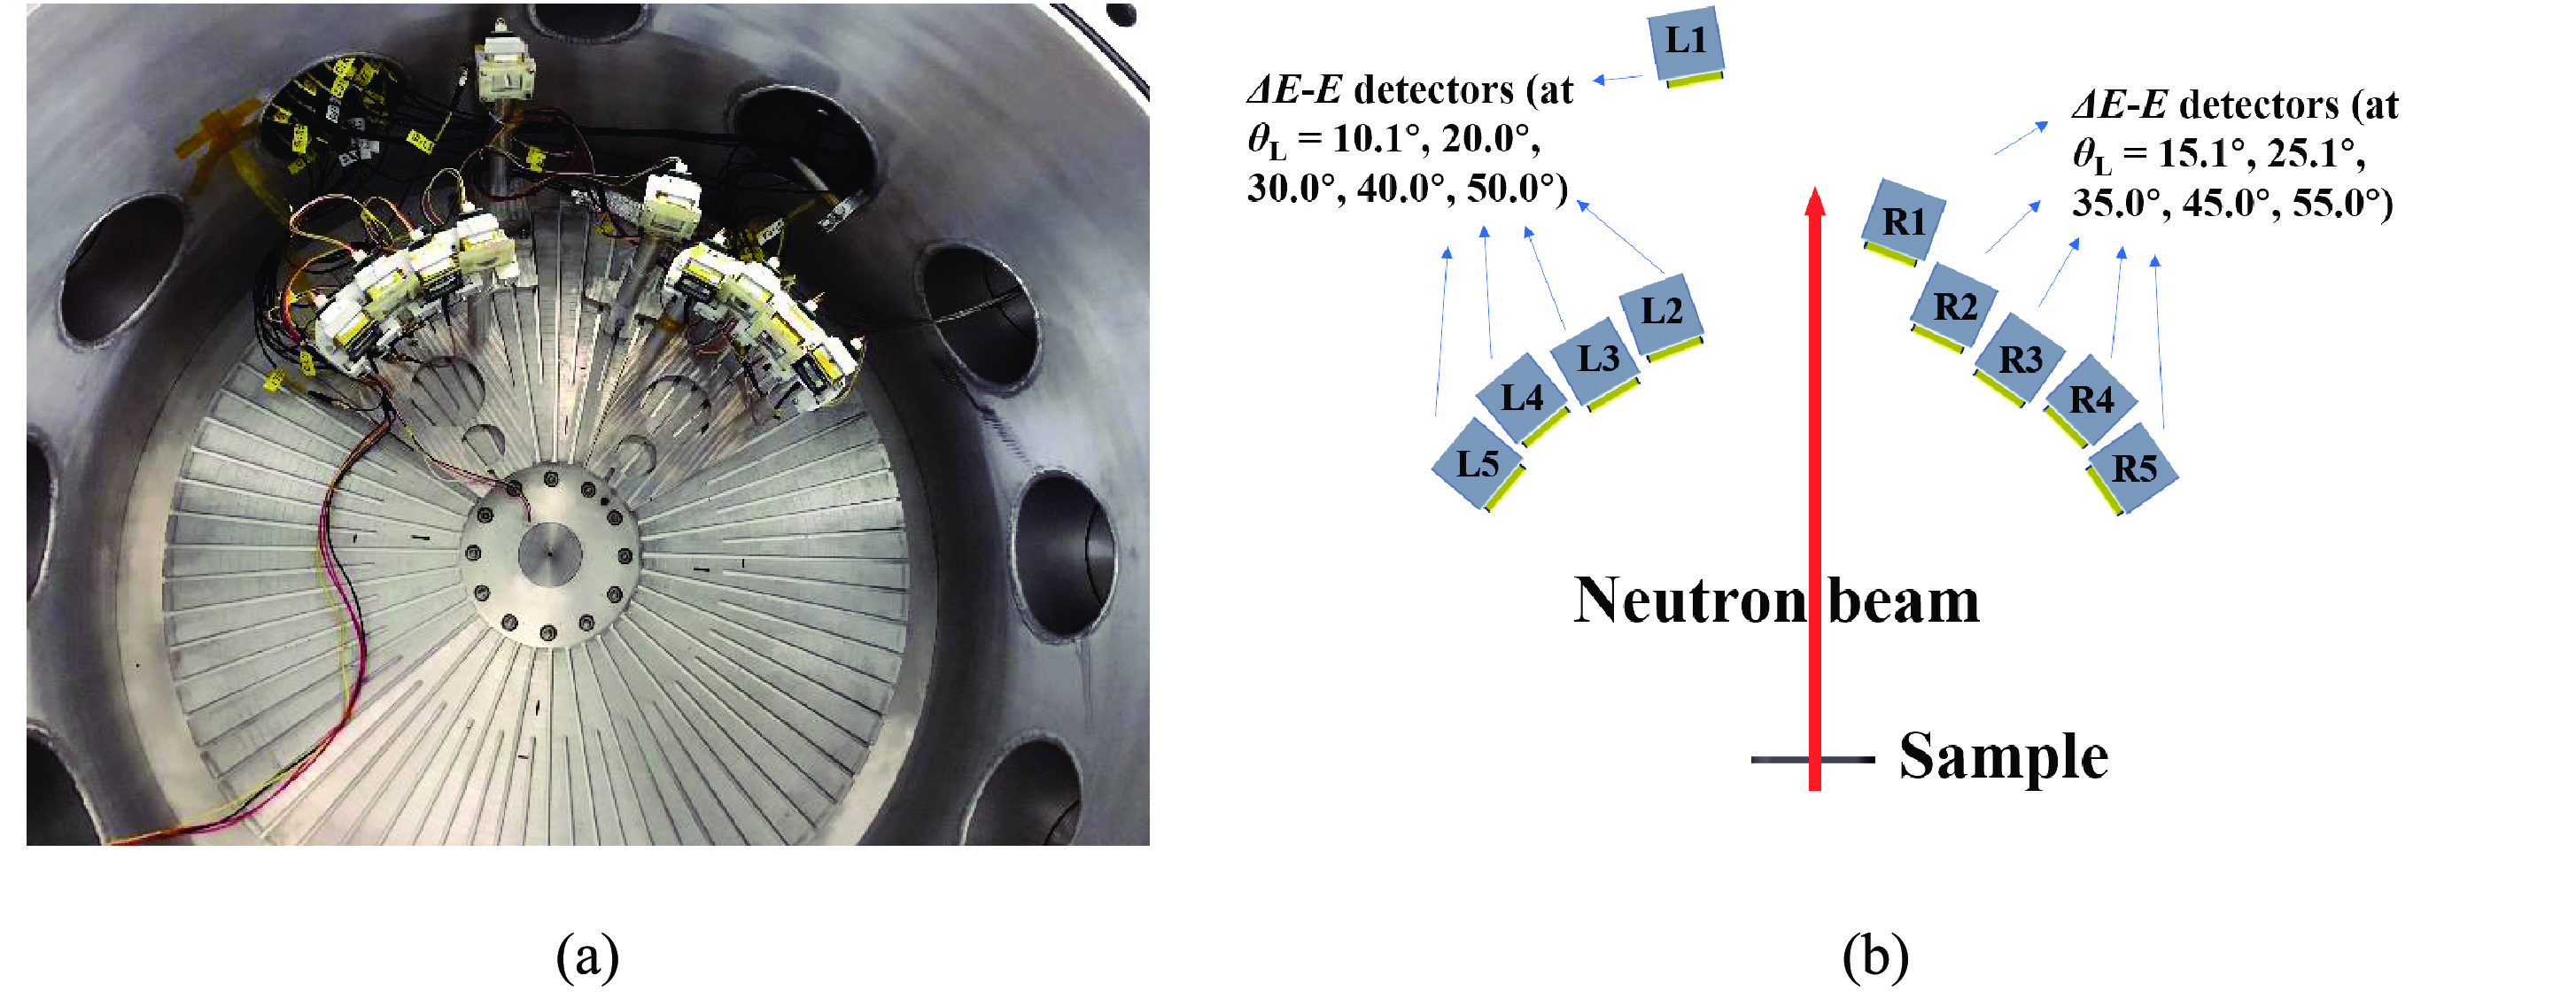
Figure 2.(color online) (a) Picture of the interior of the LPDA vacuum chamber. (b) Schematic of the experimental setup.
Telescope L1 L2 L3 L4 L5 R1 R2 R3 R4 R5 Detection Angle (°)a 10.1 20.0 30.0 40.0 50.0 15.1 25.1 35.0 45.0 55.0 Distance (cm)b 41.0 24.9 24.0 24.9 24.0 29.0 24.0 24.9 24.0 24.9 Solid Angle (0.01 sr)c 0.3675 0.4997 1.0620 0.9900 1.0657 0.7331 1.0599 0.9891 1.0674 0.9868 a: Detection angle, the average angle for each telescope according to Monte Carlo simulation. b: Distance, the distance between the center of each Si detector and the center of the sample. c: Solid angle of each telescope, calculated from Monte Carlo simulation (in 0.01 sr). Table 1.Geometric parameters of the LPDAΔE-Etelescopes.
-
The total beam duration for the measurement was approximately 210 h, split into seven rounds each consisting of ~18 h of CH2measurement, ~6 h of graphite measurement, and ~0.5 h of empty target measurement. Since the experiment was originally intended for the measurement ofn-pscattering and the graphite measurement served as the background run [21], the measurement duration for the CH2sample was much longer than that for the carbon sample. Moreover,241Am sources were used to test the detectors and the DAQ system before, during, and after the experiment.
-
The experimental data were recorded using the Back-n DAQ system [31], which contained binary data of waveforms from all the telescopes, including two kinds of signals: a) those from the Si detectors that were only pre-processed by preamplifiers, and b) those from the CsI detectors that were multiplied by SiPMs and then amplified by the main amplifiers.
-
The ratios of the differential cross sections of the12C(n,xd) reactions to those of then-pelastic scattering in the corresponding neutron energy binEnand at the outgoing angleθLwere measured first, and the principle for the measurement is described in the following equation:
$\begin{aligned}[b]R({\theta _{\rm{L}}},{E_{n}}) \equiv \frac{{{\rm d}\sigma /{\rm d}\Omega ({\theta _{\rm{L}}},{E_{n}}){\Big|_{{}^{{\rm{12}}}{\rm{C(}}n, xd{\rm{)}}}}}}{{{\rm d}\sigma /{\rm d}\Omega ({\theta _{\rm{L}}},{E_{n}}){{\Big|}_{n - p\;{\rm{scattering}}}}}}={\rm{ }}\frac{{{C_{d}}({\theta _{\rm{L}}},{E_{n}}) \cdot (1 - c_{p}^{{\rm{dead\_time}}}({\theta _{\rm{L}}},{E_{n}})) \cdot {\varepsilon _{p}}({\theta _{\rm{L}}},{E_{n}}) \cdot {N_{\rm{H}}}}}{{{C_{p}}({\theta _{\rm{L}}},{E_{n}}) \cdot (1 - c_{d}^{{\rm{dead\_time}}}({\theta _{\rm{L}}},{E_{n}})) \cdot {\varepsilon _{d}}({\theta _{\rm{L}}},{E_{n}}) \cdot {N_{{}^{12}{\rm{C}}}}}} \cdot {f_{{\rm{beam}}}},\end{aligned}$ 
(1) whereR(θL,En) is the ratio of the differential cross section of the12C(n,xd) reactions to those of then-pscattering in the corresponding neutron energy binEnand at the outgoing angleθL. The determination of neutron energy intervals will be explained in detail in section 4.5.Cd(θL,En) is the net count of deuteron events from the12C(n,xd) reactions detected by the telescope at laboratory angleθLfor neutron energyEn. A correction of the influence from the13C onCd(θL,En) was carried out. However, it was rather insignificant because the abundance of12C (98.93%) is 92.46 times that of13C (1.07%) [12], and the cross section of the12C(n,d)11B reaction is at least 1.80 times bigger than that of the13C(n,d)12B reaction according to the EAF-2010 library [32], which suggests that the deuterons from the12C(n,d)11B reaction are at least 166 times more than those from the13C(n,d)12B.Cp(θL,En) is the net count of proton events from then-pscattering.
$c_{d}^{{\rm{dead\_time}}}({\theta _{\rm{L}}},{E_{n}})$ and$c_{p}^{{\rm{dead\_time}}}({\theta _{\rm{L}}},{E_{n}})$ are the respective correction factors due to the DAQ dead time for the carbon measurement and then-pscattering measurement. They are determined by the portion of the saturated signals over the total number of the signals, which will be given in section IVA.εd(θL,En) is the detection efficiency for deuterons from the carbon sample, andεp(θL,En) is the detection efficiency for protons from the CH2sample, which will be discussed in section IVD.fbeamis the ratio of the number of protons bombarding the tungsten target (and thus producing neutrons) during the12C(n,xd) reactions measurement to that during then-pscattering measurement.${N_{{}^{12}{\rm{C}}}}$ andNHare the numbers of12C atoms in the graphite foil sample and hydrogen atoms in the CH2sample, respectively. For relative measurement, the neutron fluence term and the solid angle term are eliminated.The study ofn-pscattering was for the measurement of the relative differential cross sections of then-pscattering, details of which can be found in Ref. [21]. The results were relative differential cross sections of then-pscattering, but only the net counts of protons from then-pscattering, Cp(θL,En), the dead time correction,
$c_{p}^{{\rm{dead\_time}}}({\theta _{\rm{L}}},{E_{n}})$ , and the detection efficiency for protons,εd(θL,En), were used in the present work to calculateR(θL,En) in Eq. (1).As it is not convenient to compare the present results,R(θL,En), to the previous ones obtained directly, the differential cross sections of the12C(n,xd) reactions were thus calculated using the differential cross section data of then-pscattering from the JENDL-4.0/HE-2015 library as the standard [22].
$\frac{{{\rm d}\sigma ({\theta _{\rm{L}}},{E_{{n}}})}}{{{\rm d}\Omega }}\Big|_{{}^{{\rm{12}}}{\rm{C(}}n, xd{\rm{)}}}^{{\rm{lab}}} = R({\theta _{\rm{L}}},{E_{{n}}}) \cdot \frac{{{\rm d}\sigma ({\theta _{\rm{L}}},{E_{{n}}})}}{{{\rm d}\Omega }}{\Big |}_{n - p\;{\rm{scattering}}}^{{\rm{JENDL - lab}}},$

(2) where
$\dfrac{{{\rm d}\sigma ({\theta _{\rm{L}}},{E_{{n}}})}}{{{\rm d}\Omega }}\Big|_{{}^{{\rm{12}}}{\rm{C(}}n, xd{\rm{)}}}^{{\rm{lab}}}$ are the differential cross sections of the12C(n,xd) reactions to be calculated in the laboratory system.$\dfrac{{{\rm d}\sigma ({\theta _{\rm{L}}},{E_{{n}}})}}{{{\rm d}\Omega }}{\Big |}_{n - p\;{\rm{scattering}}}^{{\rm{JENDL - lab}}}$ are the evaluated data ofn-pscattering differential cross sections (in the laboratory system) extracted from the JENDL-4.0/HE-2015 [22] (= FENDL-3.1d [33]) library. Then-pdata extracted from the JENDL-4.0/HE-2015 library were originally given as Legendre polynomial coefficients in the center-of-mass (CM) system. Using the coefficients, the differential cross sections of then-pscattering in the CM system can be calculated, and they are transformed to the data in the laboratory system, which are$\dfrac{{{\rm d}\sigma ({\theta _{\rm{L}}},{E_{{n}}})}}{{{\rm d}\Omega }}{\Big|}_{n - p\;{\rm{scattering}}}^{{\rm{JENDL - lab}}}$ . -
The method of the data analysis is similar to that for ourn-pscattering measurement in 2019 [21]. A flowchart demonstrating the process of data analysis is shown inFig. 3.
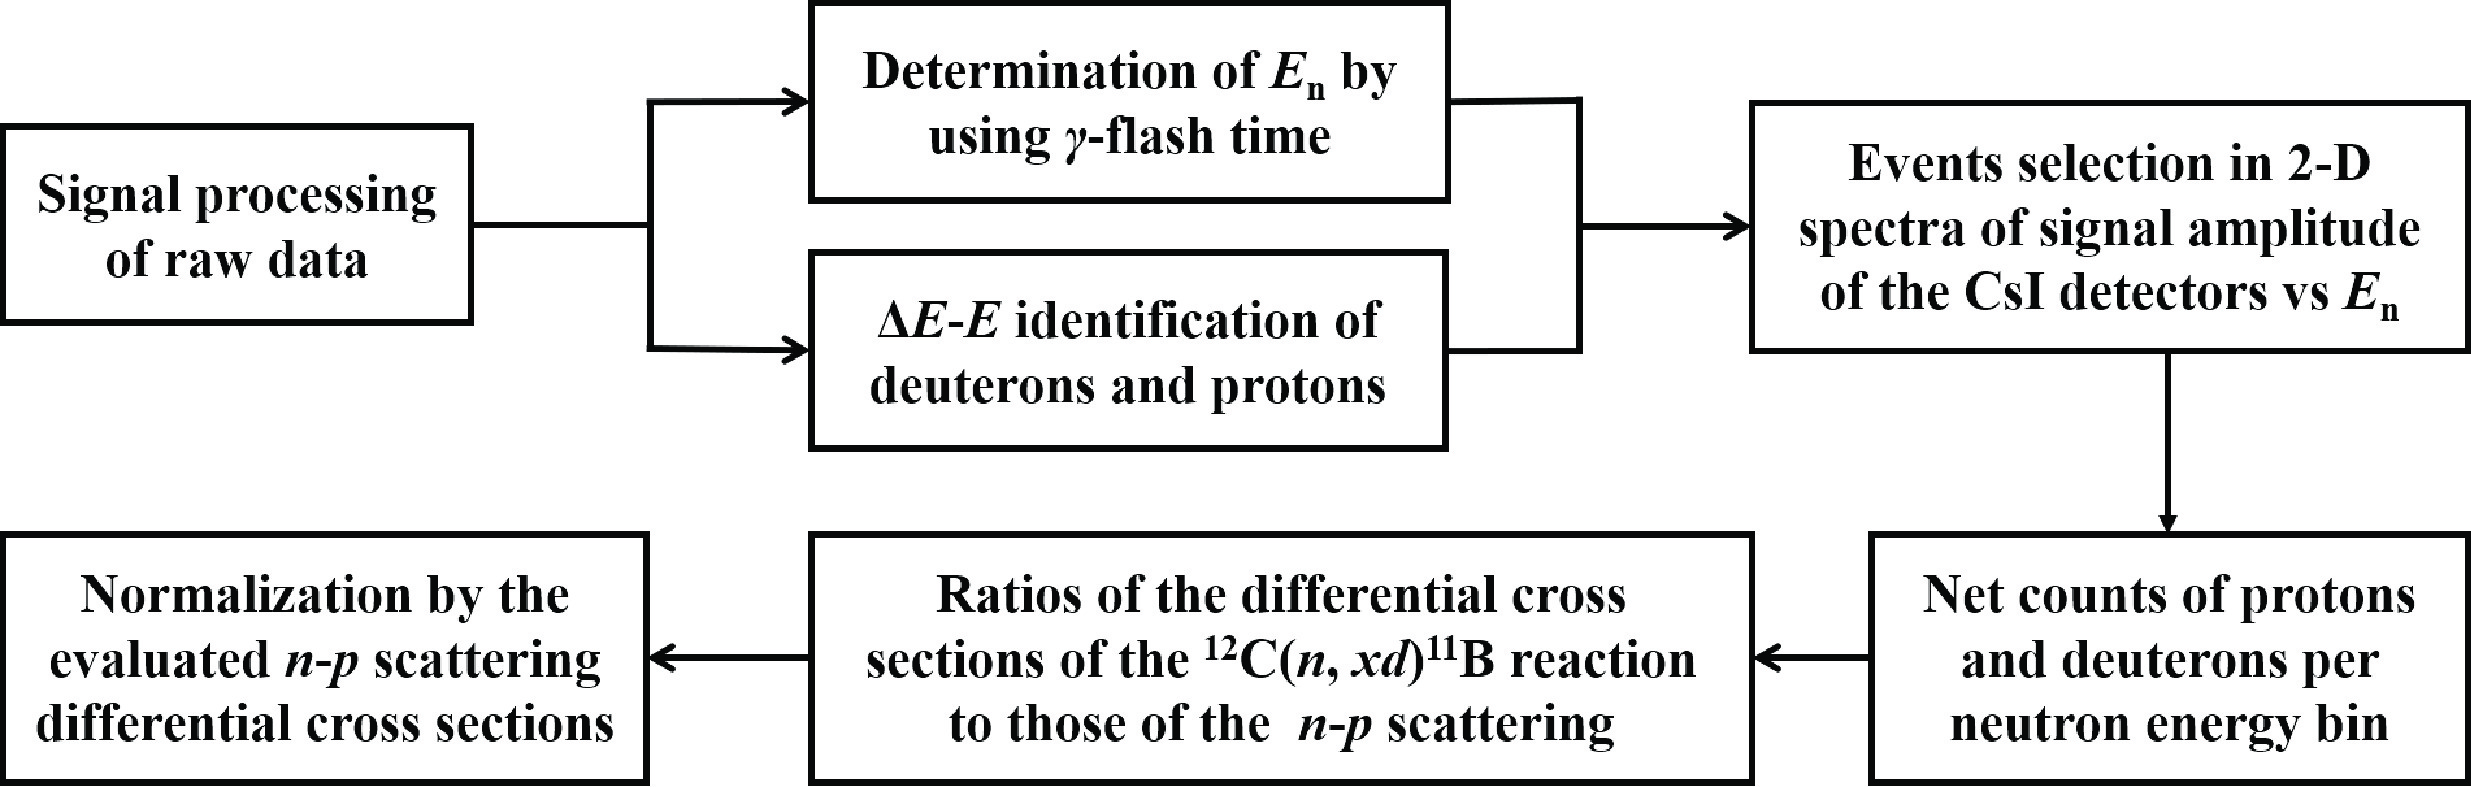
Figure 3.Process of data analysis.
-
The recorded data of waveforms were processed and the amplitudes of the signals, the corresponding neutron TOF of each event,
$c_{d}^{{\rm{dead\_time}}}({\theta _{\rm{L}}},{E_{n}})$ , and$c_{p}^{{\rm{dead\_time}}}({\theta _{\rm{L}}},{E_{n}})$ in Eq. (1) were thus obtained.$c_{d}^{{\rm{dead\_time}}}({\theta _{\rm{L}}},{E_{n}})$ (<3‰) are the portions of the saturated signals over the total number of the signals for the carbon sample measurement and$c_{p}^{{\rm{dead\_time}}}({\theta _{\rm{L}}},{E_{n}})$ (<2%) is that for the CH2sample measurement. -
The neutron energy for each event,En, is determined using the time-of-flight (TOF) method.γ-flash is produced in the spallation process and theγ-flash peak was used as theT0position. The TOF distributions of theγ-flash counts, i.e., theγ-flash event counts vs their TOFs for the Si-PIN detector and the CsI detector atθL= 15.1°, are presented inFig. 4 (a)and(b), respectively, as examples. For each of the telescopes, the TOF distribution of theγ-flash events can be fitted by a double-peaked Gaussian distribution with a standard deviation of ~25 ns. This ~25 ns of standard deviation was caused by a) the width of the proton pulse that impinged on the tungsten target (main source), b) the time resolution of the detectors (several ns), and c) the time resolution of the DAQ system (<1 ns). The absolute TOF of the neutron for each event can be calculated:
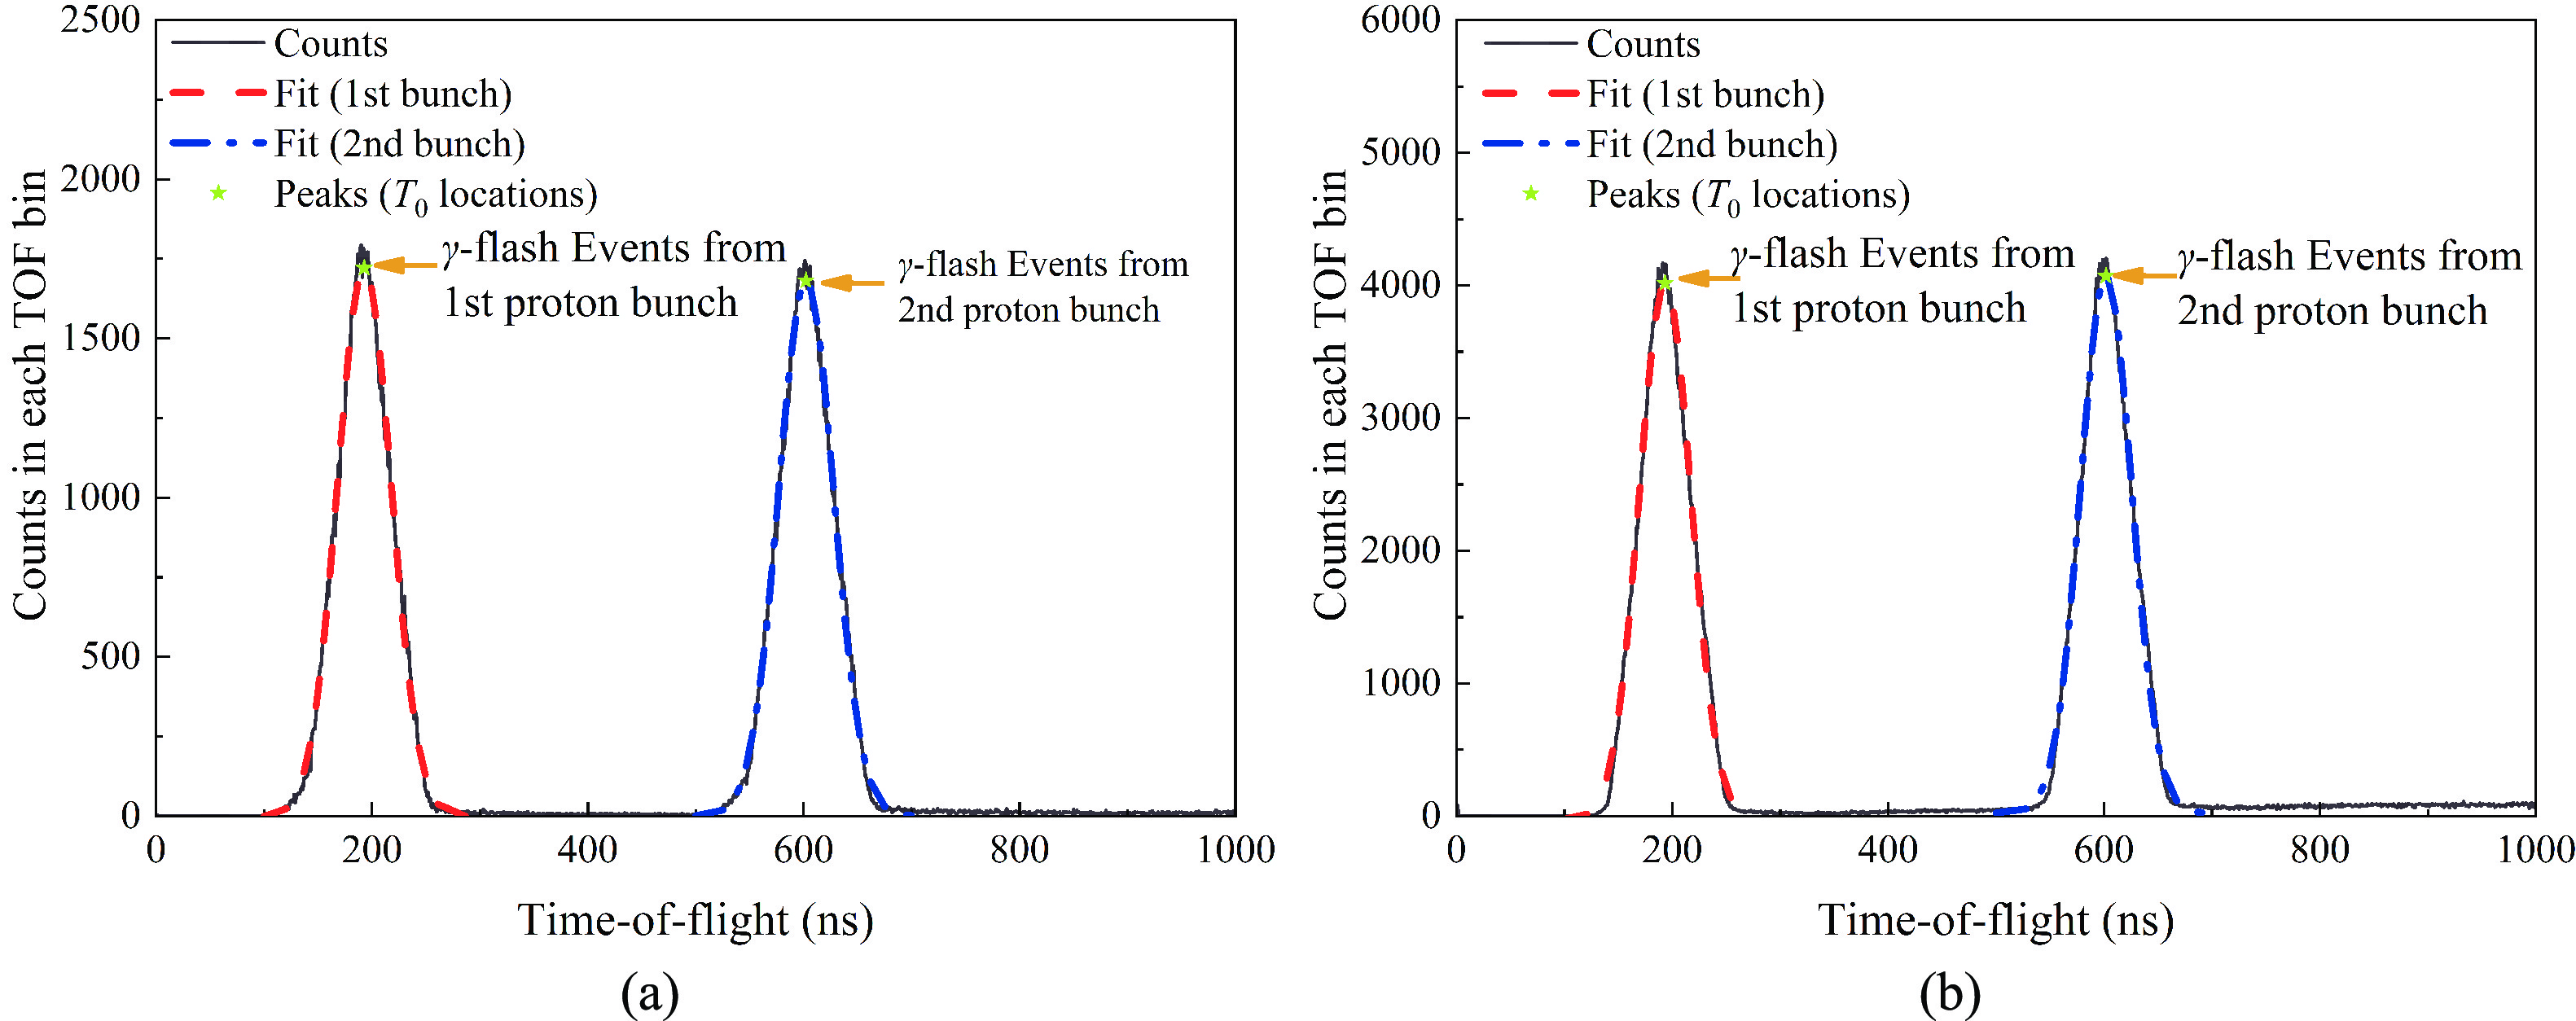
Figure 4.(color online) TOF spectra of theγ-flash detected by the Si-PIN (a) and the CsI (b) detectors atθL= 15.1°. The semi-transparent red and blue lines are the fitting curves corresponding to the first and second proton bunches, respectively. The peak positions are shown as green stars.
${\rm{TOF}} = {T_{{\rm{event}}}} - \left({T_0} - \frac{L}{c}\right),$

(3) whereTeventis the starting time for the proton and deuteron events obtained from the Si-PIN signal because of its faster response time compared to the CsI signal.Lis the length of the neuron flight path (57.99 m), andcis the velocity of light. The corresponding neutron energy for each eventEncan then be obtained from its TOF, where the relativistic effect is considered.
-
TheΔE-Edistributions for all ten telescopes were obtained for the identification of the deuteron and proton events from the carbon sample and the CH2sample, respectively. The 2-D spectra of theΔE-Esignal amplitudes atθL= 15.1° obtained from the carbon sample and from the CH2sample are shown inFig. 5 (a)and(b), respectively as examples. The same 2-D spectra obtained from the empty target were also analyzed and they were all blank, which proved that there was no charged particle background from the radiation on the aluminum sample holder by the neutron beam or the neutron beam itself.
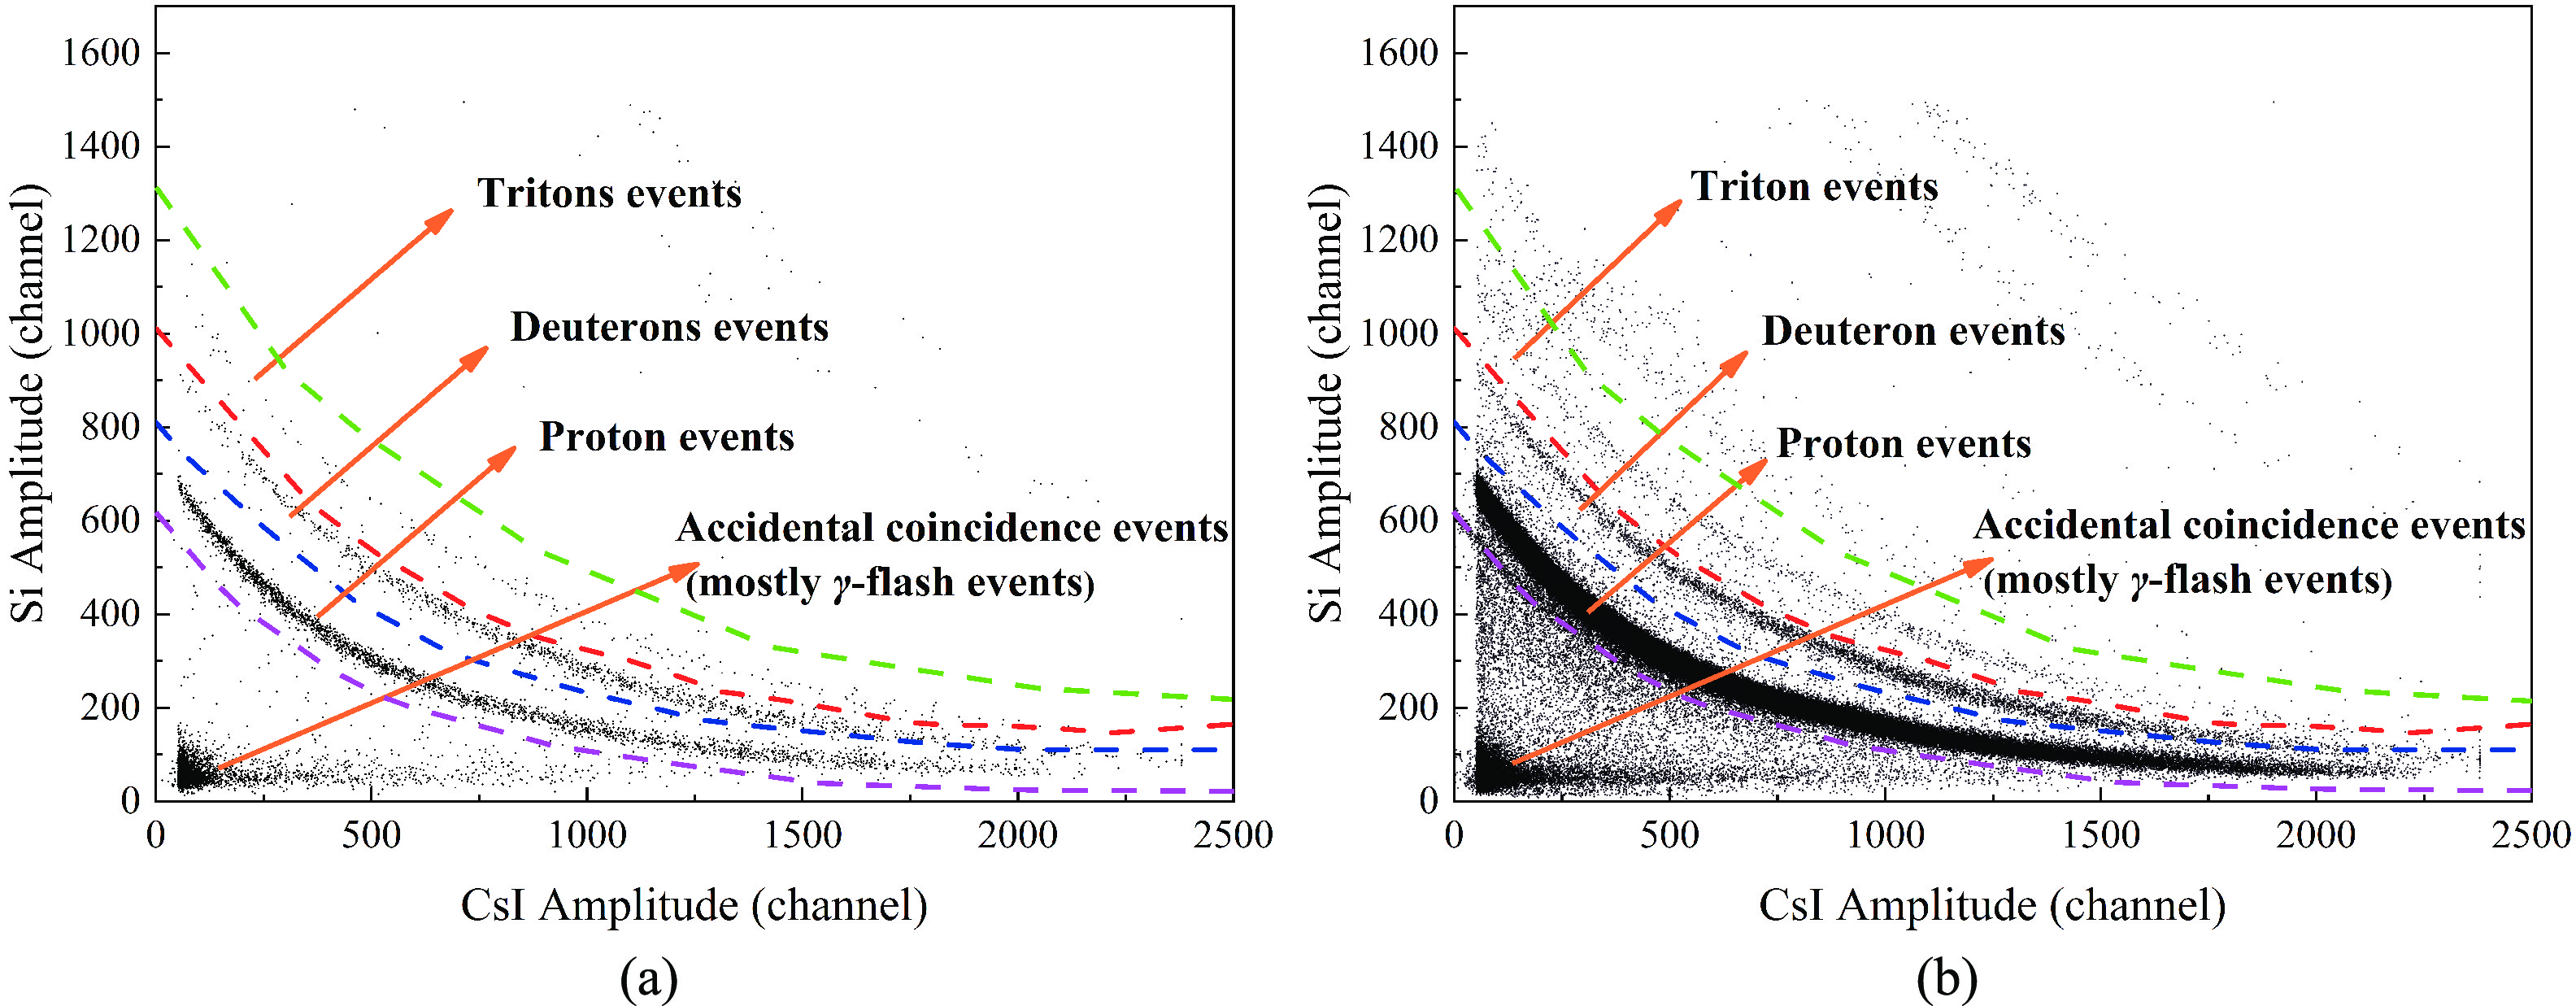
Figure 5.(color online) 2-D distributions of theΔE-Esignal amplitudes atθL= 15.1° from the carbon sample measurement (a) and the CH2sample measurement (b).
FromFig. 5 (a), it is clear that the number of proton events is much larger than the deuteron counts from the CH2sample. Therefore, the results from the CH2sample measurement are not suitable for obtaining the relative differential cross sections of the12C(n,xd) reactions because of the strong interference from the protons, although there are plenty of carbon atoms in the CH2sample. Taking the counts atθL= 15.1° for instance, the number of proton events is 14.67 times that of deuteron events, which indicates that even a small number of protons misidentified by the boundaries (red lines and blue lines inFig. 5 (b)) as deuterons will significantly affect the deuteron counts. This effect is particularly obvious for the area with high CsI detector signal amplitudes and low Si detector signal amplitudes, as can be seen inFig. 5 (b). Consequently, a carbon sample (the graphite foil) was necessary for the present work for deuteron events measurement from the12C(n,xd) reactions. As shown inFig. 5, the interference from the proton events was much less for the carbon sample than those for the CH2sample and the interference is apparent only for CsI detector signal amplitudes greater than 2000 channels, where the corresponding neutron energy is larger than 60 MeV and out of the range of the present results.
-
With the knowledge of the neutron energyEnfor each deuteron or proton event and the signal amplitude of the CsI detectors, the 2-D distribution of the amplitude of the CsI detector output signal vsEn(hereinafter referred to as the “CsI vsEnspectrum”) is obtained. As the neutron source is double-bunched, theT0time for each of the two bunches is used to determine the corresponding neutron energy separately. The protons detected atθL= 15.1° from the CH2sample are plotted inFig. 6 (a)and(b)as the 2-D distribution of the signal amplitude of the CsI detectors signals vsEnas an example, which correspond to the first and second bunch, respectively.
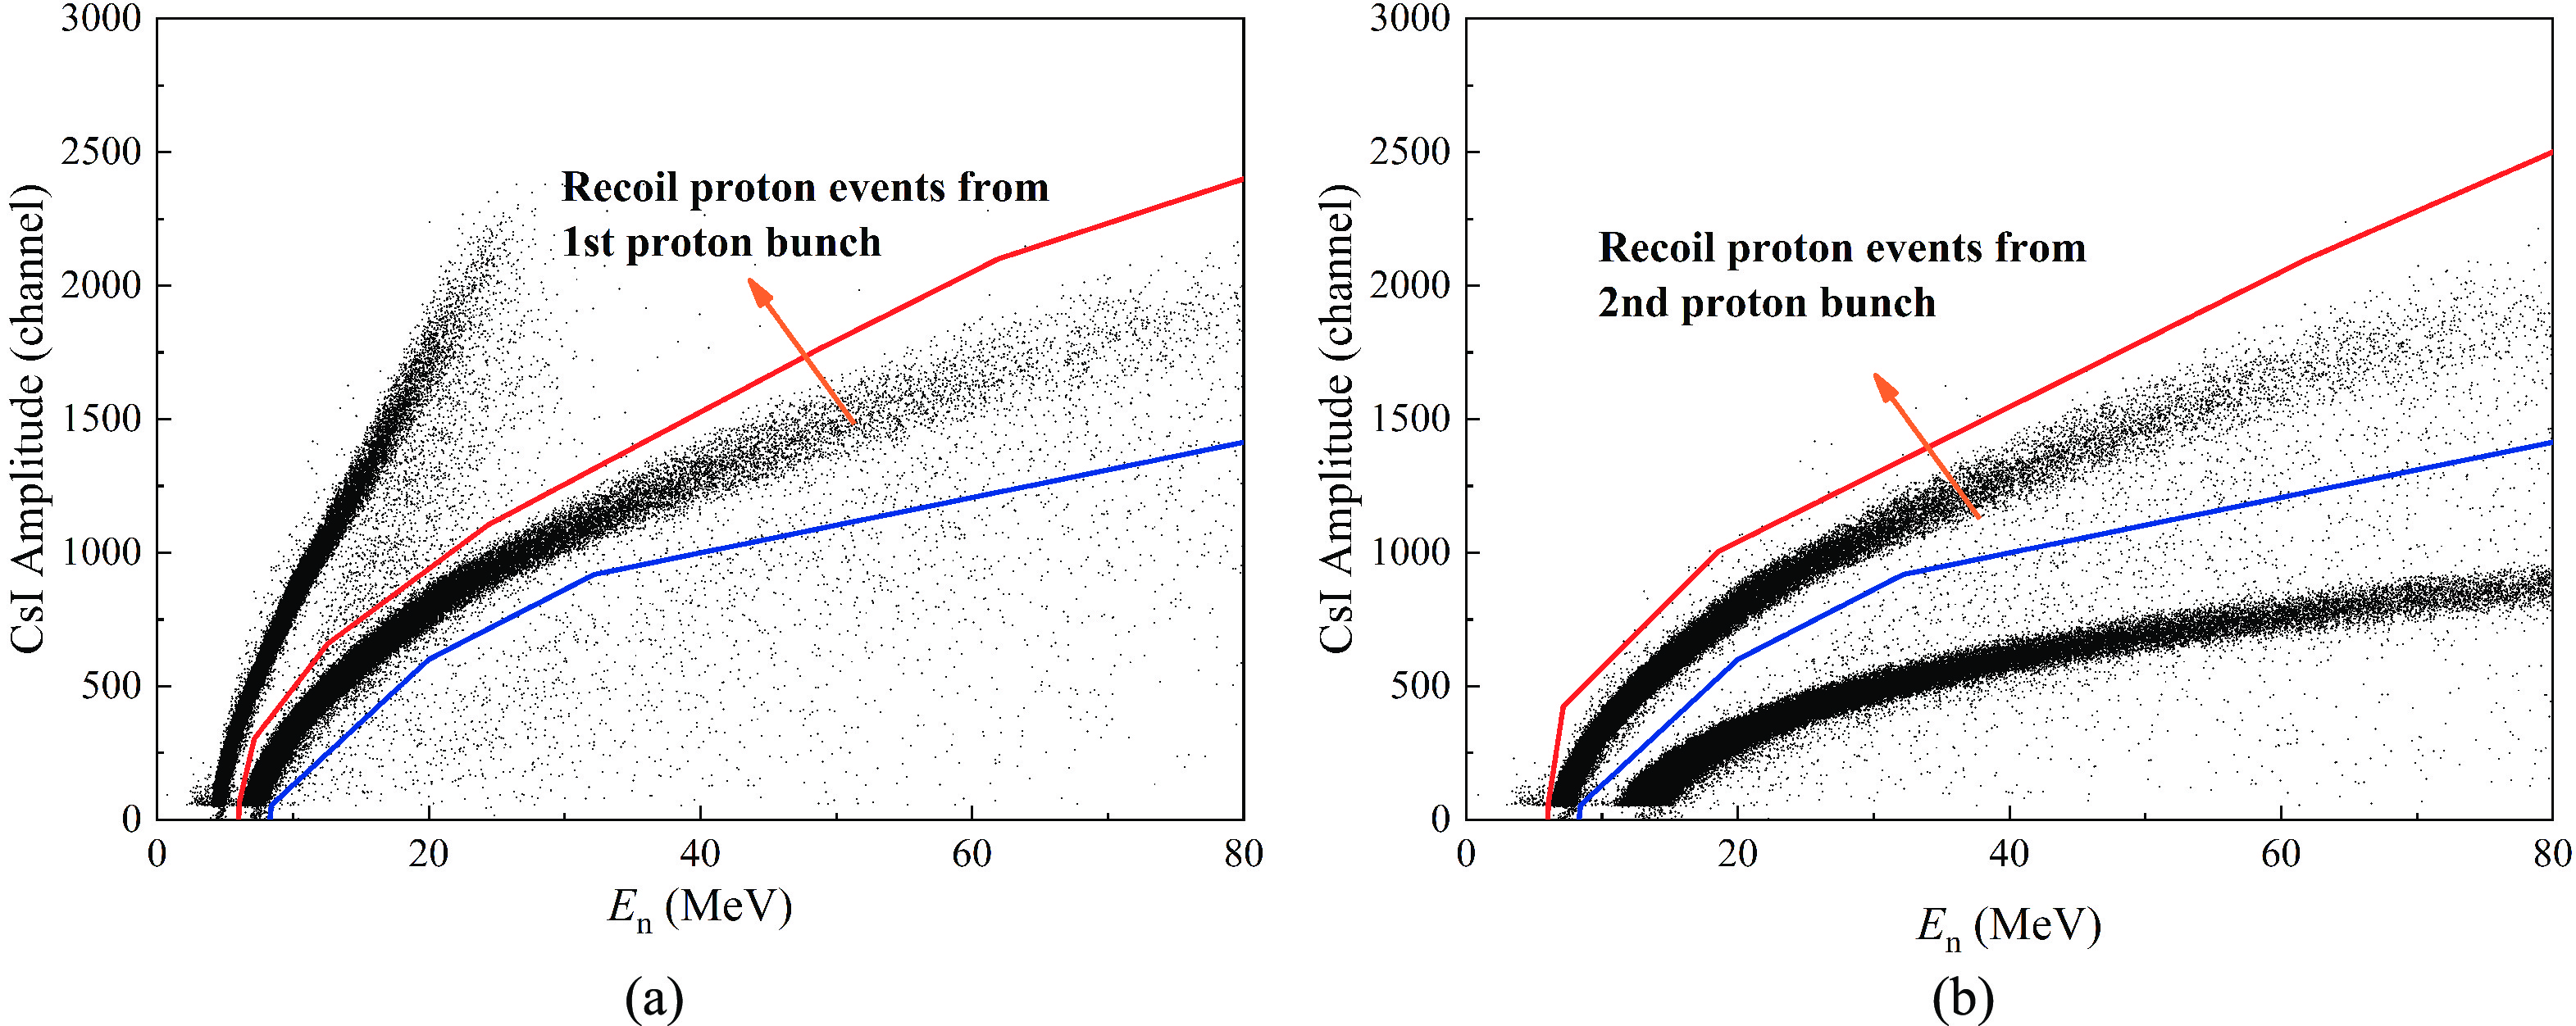
Figure 6.(color online) 2-D distribution of the signal amplitude of the CsI detector vs neutron energyEnatθL= 15.1° for protons from the CH2sample. The neutron energyEncorresponds to the first proton bunch in (a) and the second proton bunch in (b). The red line and the blue line are the upper and lower boundaries of the valid event area, respectively.
The identified deuterons using theΔE-Emethod from the carbon sample are plotted as the 2-D distribution of the signal amplitude of the CsI detectors signals vsEn.Fig. 7 (a)and(b)are the scatter plots of the detected deuteron distribution atθL= 15.1° corresponding to the first and second bunches, respectively.
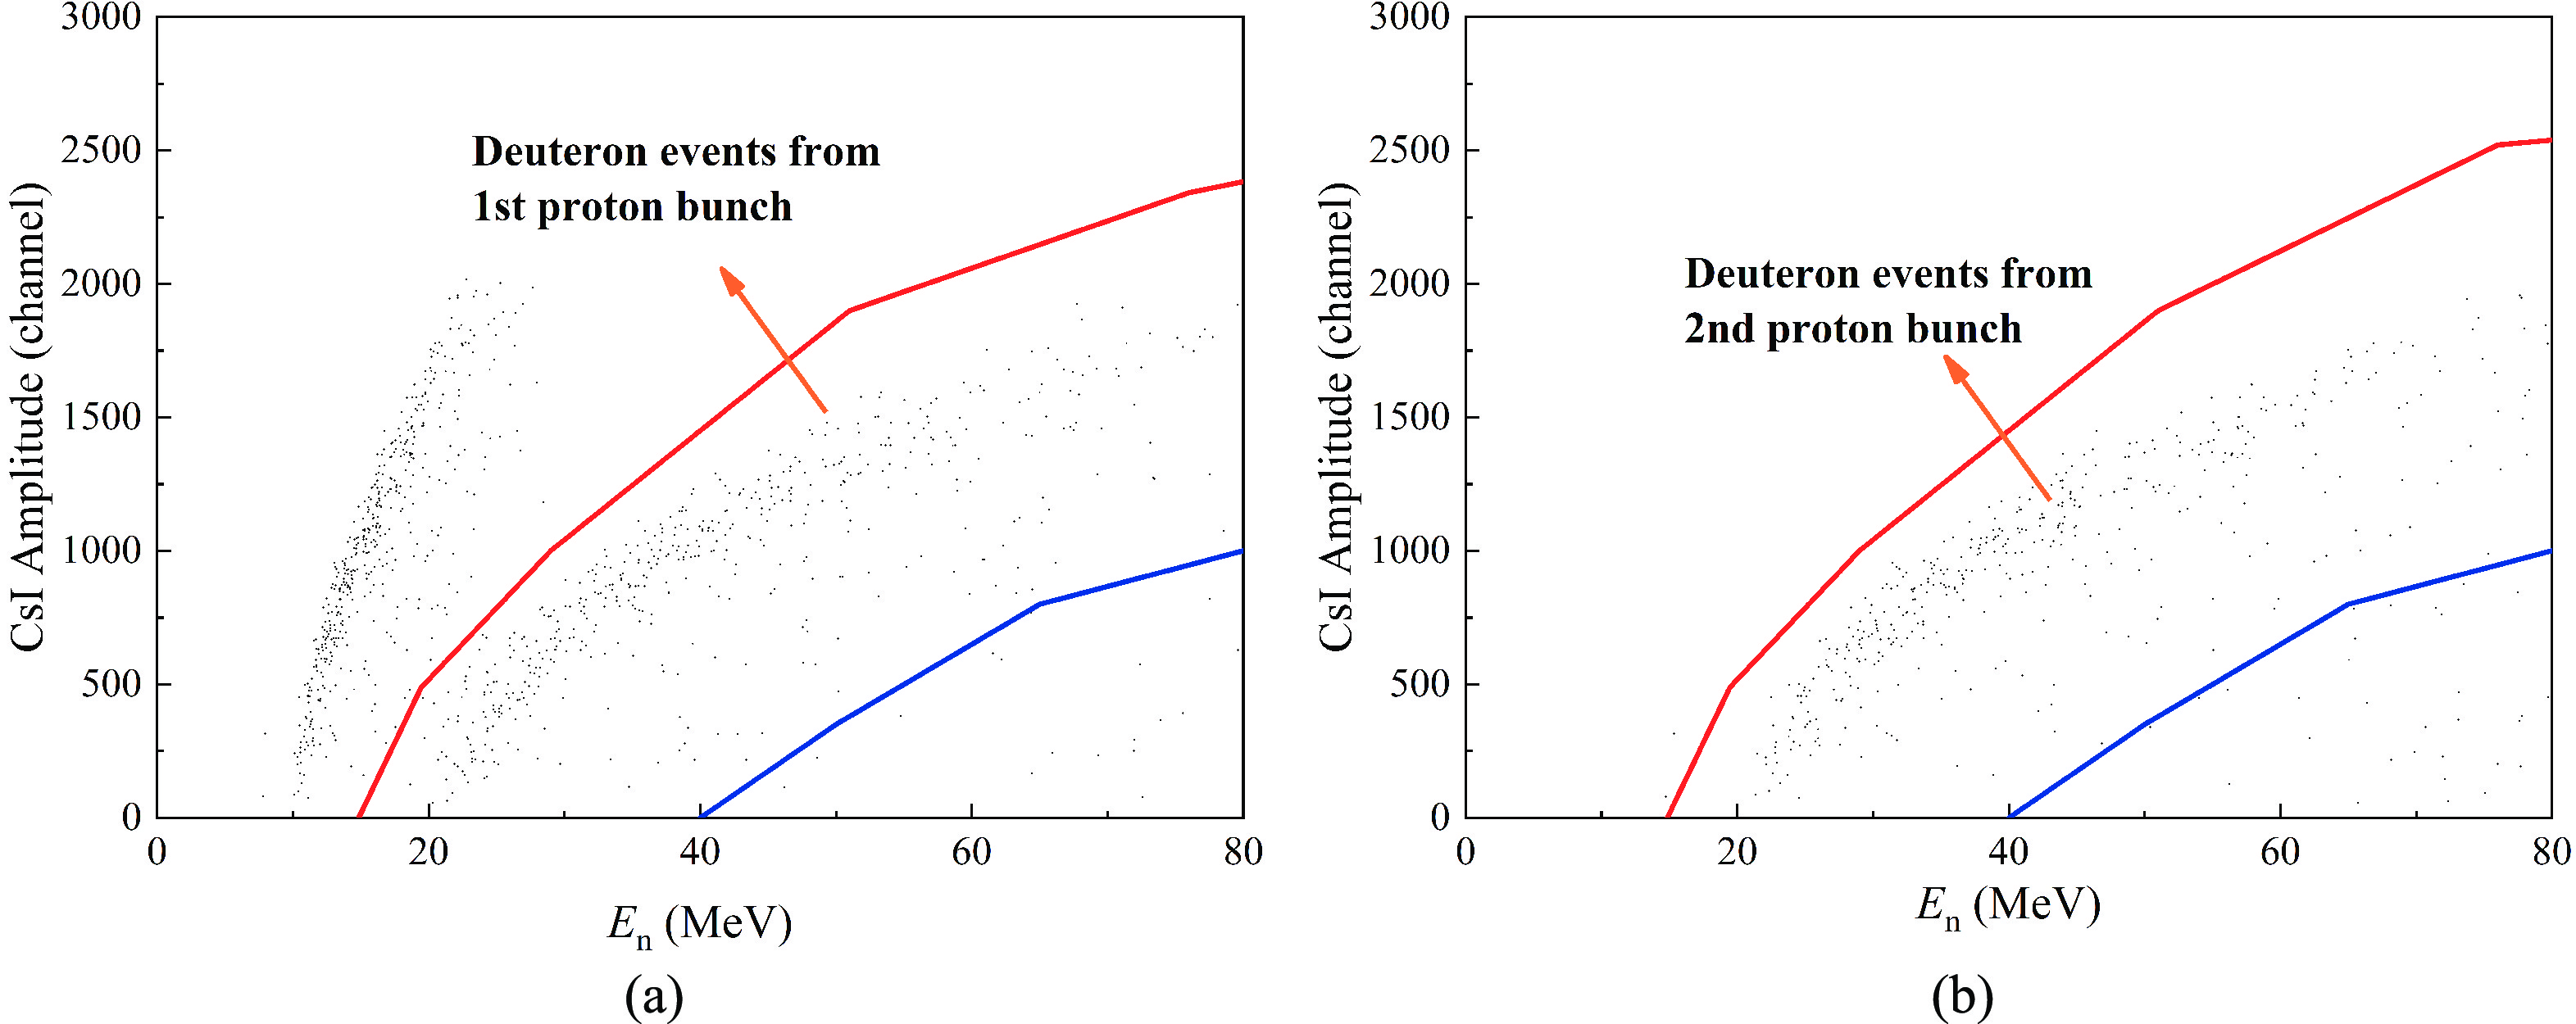
Figure 7.(color online) 2-D distribution of the signal amplitude of the CsI detector vs neutron energyEnatθL= 15.1° for deuterons using theΔE-Emethod from the carbon sample. The neutron energy,En, corresponds to the first proton bunch in (a) and the second proton bunch in (b). The red line and the blue line are the upper and lower boundaries of the valid event area.
As is shown inFig. 7, the area of the deuteron events is not clear for both the first and second bunches, which creates considerable difficulty in selecting the boundaries of the deuteron events and in determining the detection efficiency for the deuterons. Consequently, the selection of the boundaries is a vital source of uncertainty of the result. The experimental results of the12C(n,xd) reactions given in the present work include deuterons corresponding to different energy levels from multiple reactions such as11B (ground state, excited states of 2.12, 4.44, 5.02, 6.74, and 6.79 MeV) from the12C(n,d)11B reaction. As a result, the boundaries of the deuterons were drawn noticeably wider than those of the protons (as shown inFig. 6andFig. 7) to guarantee a high detection efficiency for deuterons,εd(θL,En), which was viewed as 100%. Although this approximation may introduce random events, it was reasonable and necessary. Furthermore, the boundaries were drawn narrower in the error analysis. The different counts between the narrow boundaries and the wide boundaries were counted as a source of uncertainty. The errors introduced by the random events and those by the approximation of viewingεd(θL,En) as 100% were thus included in the uncertainty of the boundaries. For the protons from then-pscattering, it was found thatεp(θL,En) > 98% by using the Monte Carlo simulation and comparing the experimental spectrum with that from the simulation. The method of the simulation is described in detail in Ref. [30]. The resultεp(θL,En) > 98% was first reported in Ref. [21].
-
The neutron energyEnfor the Back-n white neutron source is split into six bins in the present work with a TOF interval of 50 ns according to the ~25 ns standard deviation of the Gaussian distribution of theγ-flash events, as described in section IVB. TheEnvalues in the present work, 25.2 MeV, 28.6 MeV, 32.7 MeV, 37.8 MeV, 44.2 MeV, and 52.5 MeV, are midpoints of their corresponding intervals. The differences between each midpoint and the boundaries of their intervals are thus viewed as the uncertainties ofEn. TheQ-value of the12C(n,d)11B reaction is −13.732 MeV and the reaction threshold is 14.887 MeV [34]. The energies of the corresponding deuterons from the12C(n,d)11B reaction are 9.7 to 38.4 MeV for the ground state of11B according to binary reaction dynamics. Other channels, such as the12C(n,n+d), etc., haveQ-values lower than -13.732 MeV and therefore higher thresholds than 14.887 MeV. These higher thresholds, combined with the kinematics of the deuteron production reactions other than the12C(n,d)11B reaction, suggest that the emitting deuterons have lower energies than the deuterons from the12C(n,d)11B reaction for the ground state11B. The lower limit of the neutron energy for the present work is 25.2 MeV because of the negativeQ-value of the12C(n,d)11B reaction [34] and the energy loss in theΔElayer (Si-PIN detector) for particle identification. The upper limit of neutron energy is 52.5 MeV because the uncertainty ofEnincreases and the number of recoil protons from then-pscattering is not adequate due to the small cross sections of then-pscattering and the weak neutron beam flux forEn> 52.5 MeV [21]. The signal amplitudes caused by higher-energy protons are beyond the input voltage range of the DAQ system for the CsI detectors of the telescopes atθL= 10.1° andθL= 15.1°. As a result, there are no data for the12C(n,xd) reactionsθL= 10.1°, and the upper limit is 44.2 MeV atθL= 15.1° [21]. The numbers of protons from the CH2sample and those of the deuterons from the carbon sample within the boundaries drawn in section IVD,Cp(θL,En) andCd(θL,En) in Eq. (1), are counted into the corresponding neutron energy bin according to the neutron energy. The numbers of protons from the CH2sample and those of the deuterons from the carbon sample within the boundaries drawn in section IVD,Cp(θL,En) andCd(θL,En) in Eq. (1), are counted into the corresponding neutron energy bins according to the neutron energy.
Cd(θL,En) is the net count of the deuterons, which is the count for graphite foil measurement subtracted by the count for empty target measurement (normalized according to the beam of protons of the accelerator). However, there were no deuteron events in the empty target measurement run; therefore, the counts from the carbon sample measurement were the net counts. The net count of the protons from the CH2sample,Cp(θL,En), can be obtained after the background subtraction, which is described in detail in Ref. [21]. Because of the small cross sections and negativeQ-values (-12.59 MeV for the12C(n,p)12B reaction, for instance) [34] of the12C(n,xp) reactions, the proton background from the12C(n,xp) reactions is very weak compared to the protons from then-pscattering. The spectrum of signal amplitude vs. net counts of protons from the CH2sample and that of deuterons from the carbon sample within the boundaries of theEn= 44.2 MeV energy bin detected by the CsI detector atθL= 15.1° is presented inFig. 8as an example.
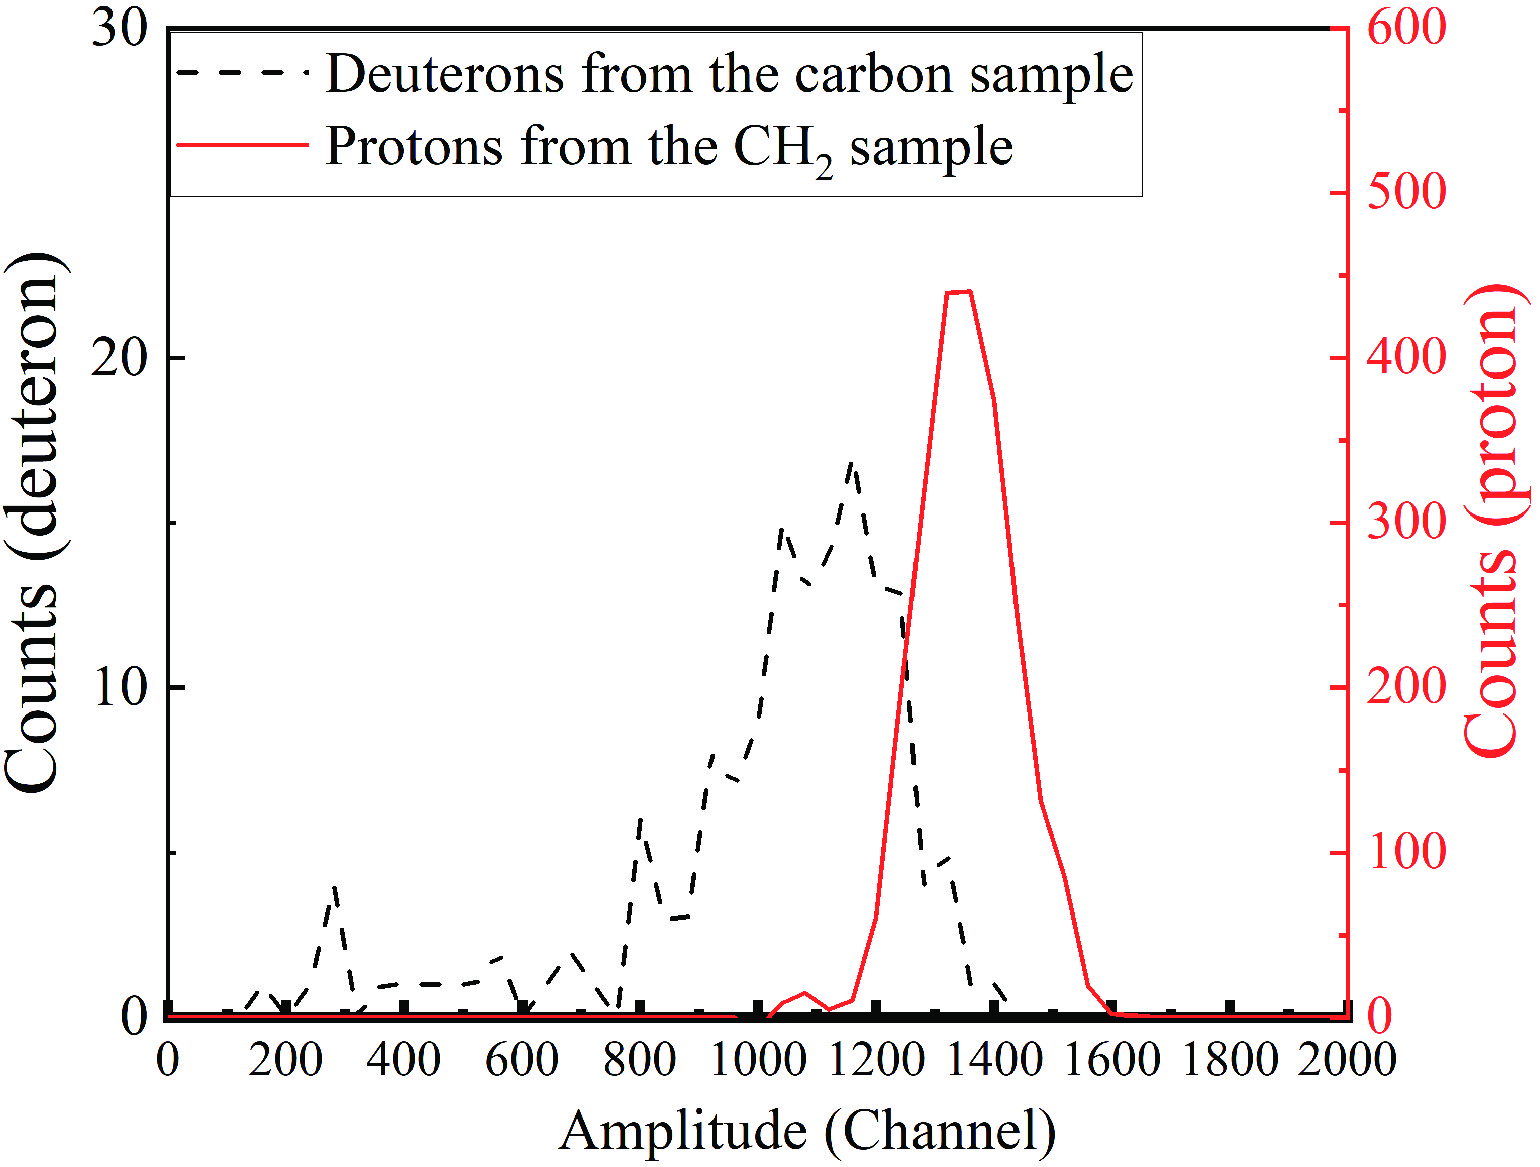
Figure 8.(color online) Counts vs amplitude of the CsI detector signal atθL= 15.1° for the net deuterons from the carbon sample and the net protons from the CH2sample in theEn= 44.2 MeV bin. Note that the scales for the deuteron counts (left blackY-axis) and the proton counts (right redY-axis) are different. Counts in every 40 channels are added up.
-
The ratios of the differential cross sections of the12C(n,xd) reactions to those of then-pscattering,R(θL,En), can be calculated according to Eq. (1). As the present work is a relative measurement,
${N_{\rm{H}}}/{N_{{}^{12}{\rm{C}}}}$ can be calculated using the following equations:$\frac{{{N_{\rm{H}}}}}{{{N_{{}^{12}{\rm{C}}}}}} = \frac{{{\rho _{{\rm{C}}{{\rm{H}}_{\rm{2}}}}} \cdot {d_{{\rm{C}}{{\rm{H}}_{\rm{2}}}}}/{M_{{\rm{C}}{{\rm{H}}_{\rm{2}}}}}}}{{2 \cdot {\rho _{{\rm{graphite}}}} \cdot {d_{{\rm{graphite}}}} \cdot {a_{{}^{12}{\rm{C}}}}/{M_{{}^{{\rm{Nat}}}{\rm{C}}}}}},$

(4) whereρgraphite= 1.80 g/cm3and
${\rho _{{\rm{C}}{{\rm{H}}_2}}} = 0.92\;{\rm{ g/c}}{{\rm{m}}^3}$ are the densities of the carbon sample and the CH2sample, respectively, as provided by the manufacturer.dgraphite= 0.049 mm is the thickness of the carbon sample and${d_{{\rm{C}}{{\rm{H}}_{\rm{2}}}}}$ = 0.103 mm is the thickness of the CH2sample, both of which were measured using a micrometer. The areas of both samples were eliminated because the incident neutron beam spot was well covered by the samples.${M_{{}^{{\rm{Nat}}}{\rm{C}}}} = 12.0\;{\rm{ g/mol}}$ is the molecular mass of natural carbon element, and${M_{{\rm{C}}{{\rm{H}}_{\rm{2}}}}} = 14.0\;{\rm{ g/mol}}$ is the molecular mass of CH2.${a_{{}^{12}{\rm{C}}}} = 98.93$ % is the abundance of12C [12]. -
To compare the results from the present work with the previous ones from the literature [9,13,16-18] and the data from theoretical calculations [19], differential cross sections of the12C(n,xd) reactions are obtained using the measured dataR(θL,En) and the evaluatedn-pscattering differential cross sections from the JENDL-4.0/HE-2015 library for normalization [22], as described in Eq. (2).
-
The measured differential cross sections in the laboratory system are presented inFig. 9and the tabulated data are given inTable 2. Brenner’s theoretical calculations using INCA code [16,19] are also included inFig. 9. The INCA code calculates the pre-equilibrium process using the intranuclear cascade model and describes the deexcitation of the compound nucleus based on the Fermi-breakup model [19,35]. In addition, the data using Talys-1.9 code with default parameters [36] were calculated in the present work, and the results are presented in each plot. The data from the JENDL-4.0/HE-2015 library [22,37] and the ENDF-B/VIII.0 library [38] are also included inFig. 9, all of which were calculated based on GNASH code [39]. Furthermore, the results from previous measurements are also presented for comparison. There are only nine previous measurements [1,2,9,13,16-18,40,41] recorded in the EXFOR library, seven of which are in the several tens of MeV range [1,2,9,13,16-18] and five of which are within the neutron energy region of the present work. Those five measurement results are included inFig. 9for comparison. Some of the previous measurements were for the double differential cross sections of the deuteron production reactions on carbon, and they were energy-integrated to obtain angle-differential cross sections for comparison. Young’s original results were given for three energy levels of11B in the12C(n,d)11B reaction (ground state, level 1, and level 2 of11B) [18], and the differential cross sections of the three levels are added up inFig. 9 (f)as “combined.”
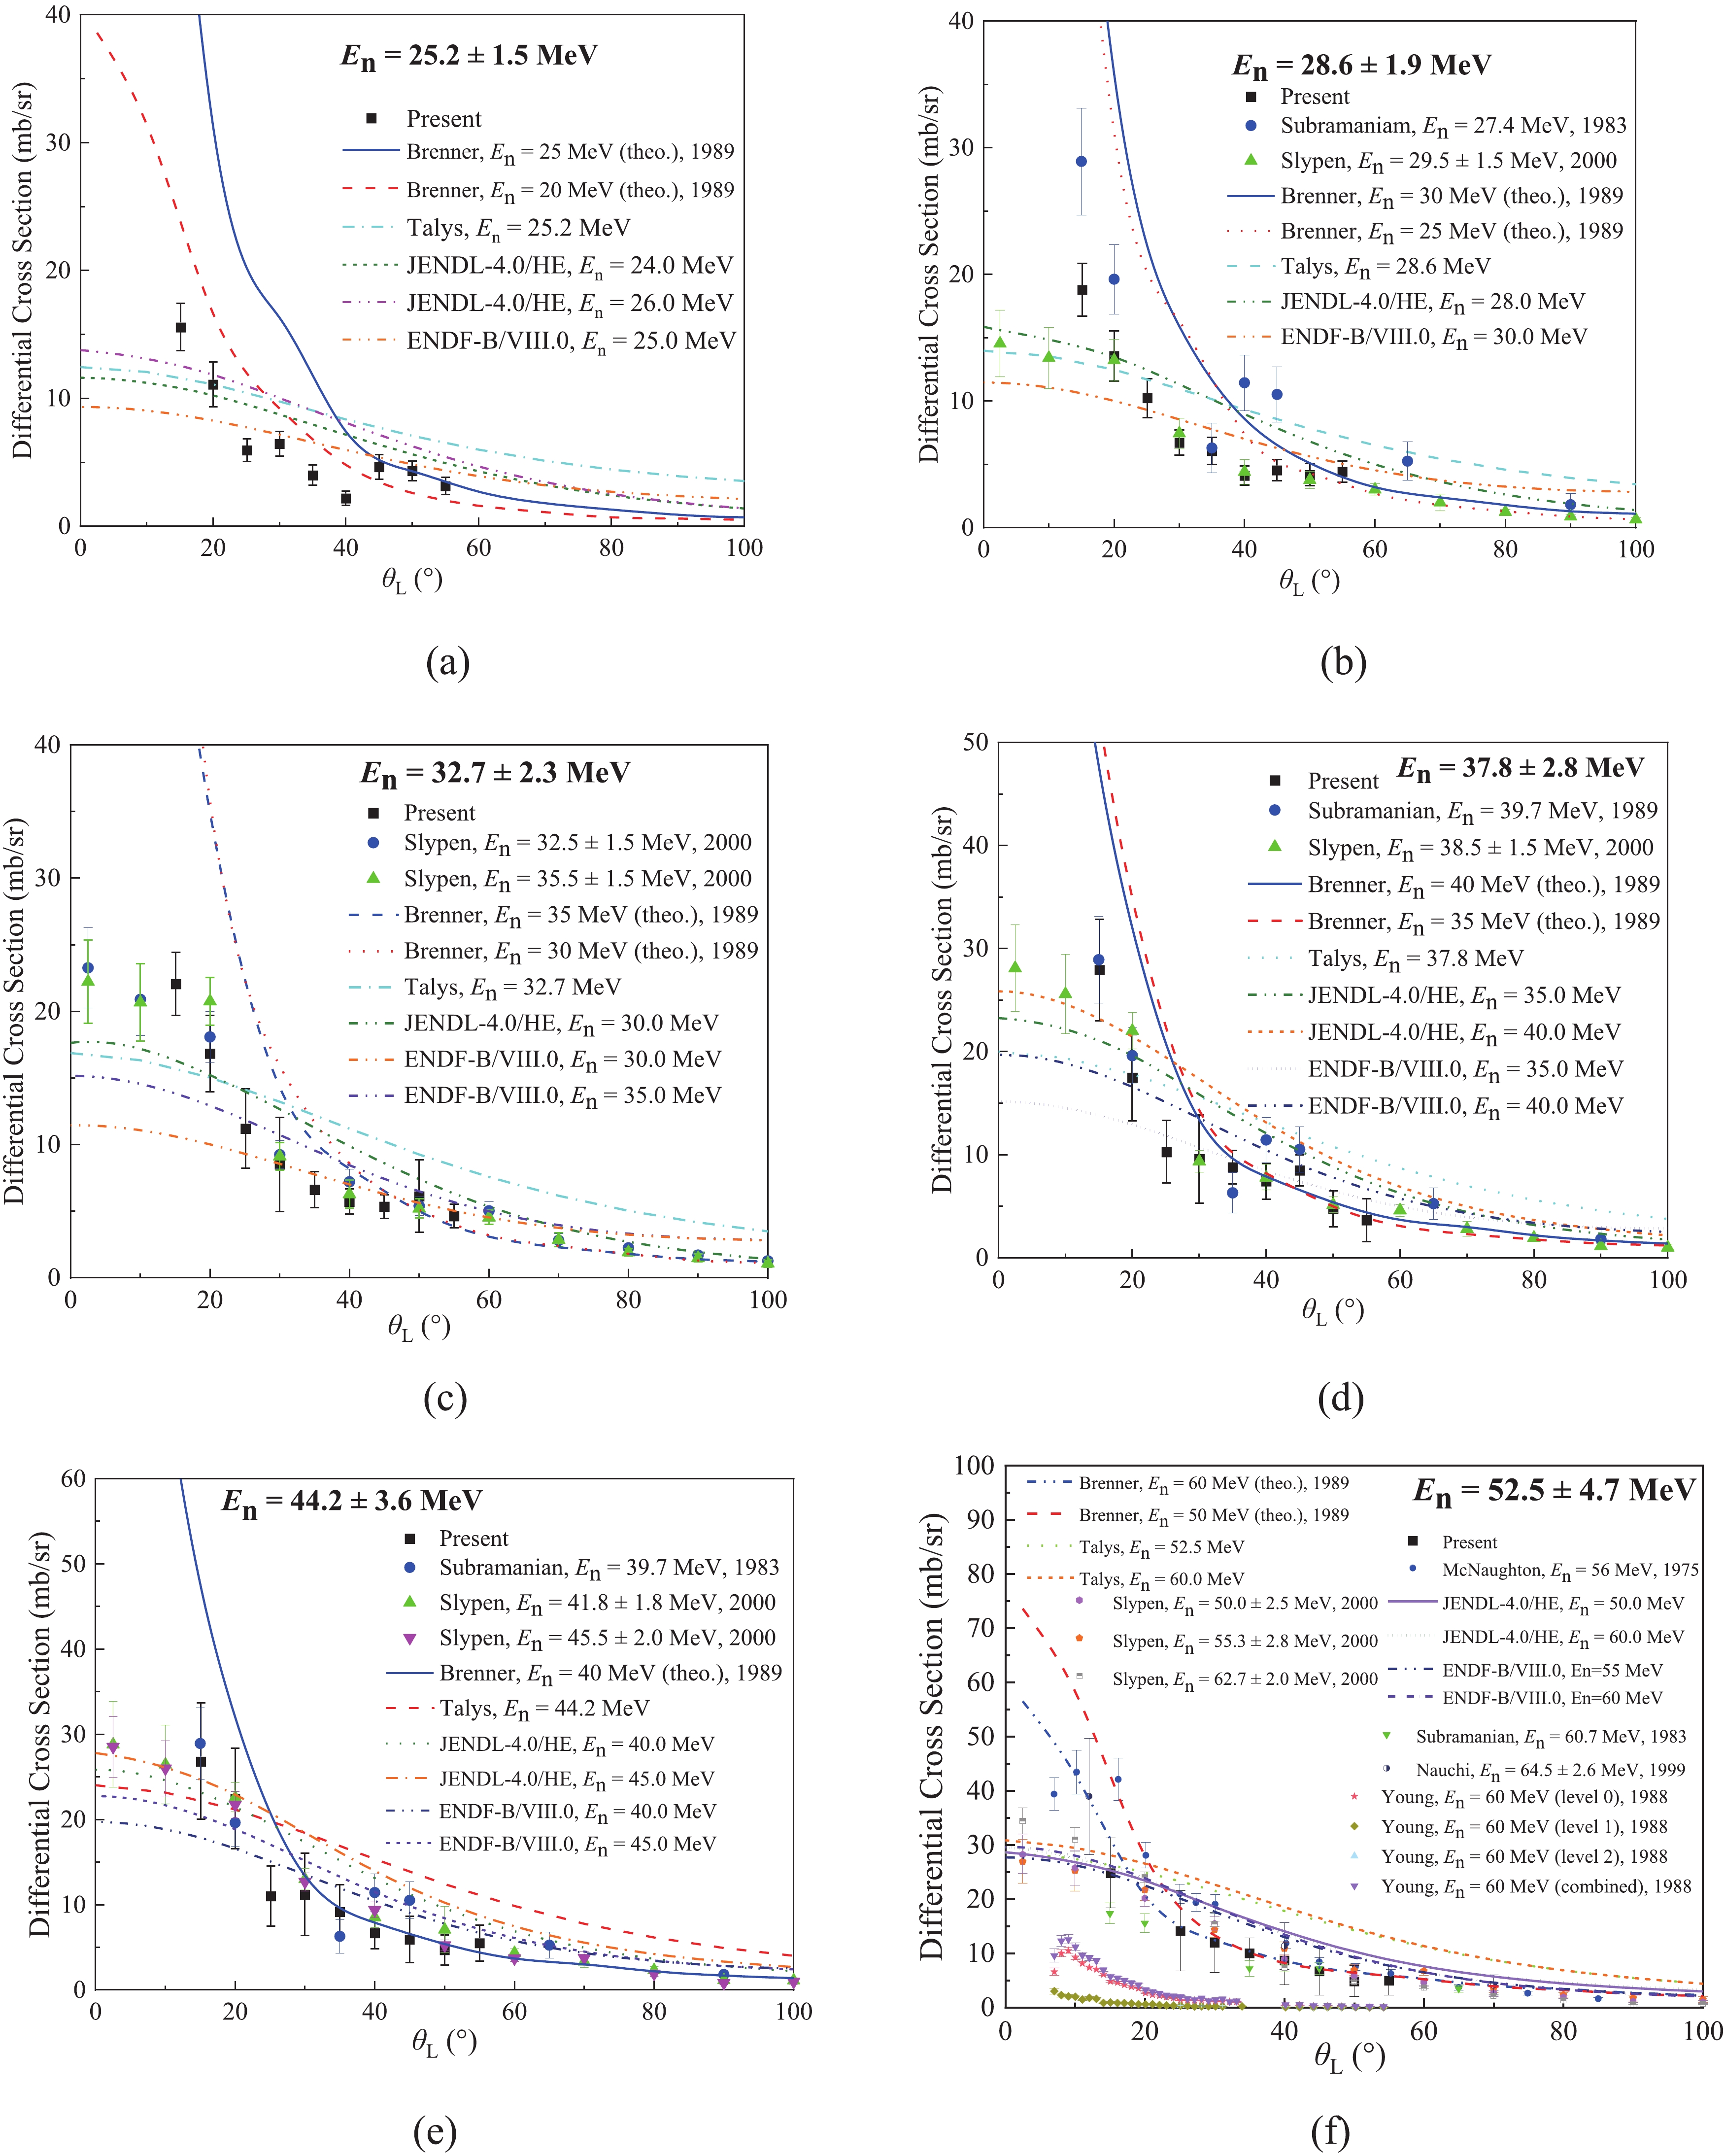
Figure 9.(color online) Differential cross sections of the12C(n,xd) reactions measured atEn= 25.2 MeV, 28.6 MeV, 32.7 MeV, 37.8 MeV, 44.2 MeV, and 52.5 MeV compared with results from previous measurements, the evaluated data, and the theoretical calculations. The previous experimental results were taken from the EXFOR library [14] and they include those of Subramanianet al. 1983 [16], Slypenet al. 2000, McNaughtonet al. 1975 [9], Nauchiet al. 1999 [17], and Younget al. 1988 [18]. The evaluated data were taken from the JENDL-4.0/HE-2015 library [22,37] and the ENDF-B/VIII.0 library [38], which were all calculated using GNASH code [39]. The theoretical calculations were carried out by Brenneret al. [19]. The calculations in the present work were based on the Talys-1.9 code [36]. The purple triangles in (f) are the combined data of Young (1988) atEn= 60.0 MeV [18] for level 0, level 1, and level 2 of11B.
θL(°) En= 25.2±1.5 MeV En= 28.6±1.9 MeV En= 32.7±2.3 MeV R(θL,En) $\frac{ {{\rm d}\sigma ({\theta _{\rm{L} } },{E_{\rm{n} } })} }{ {{\rm d}\Omega } }|_{ {}^{ {\rm{12} } }{\rm{C(} }n, xd{\rm{)} } }^{ {\rm{lab} } }$ 

R(θL,En) $\frac{ {{\rm d}\sigma ({\theta _{\rm{L} } },{E_{\rm{n} } })} }{ {{\rm d}\Omega } }|_{ {}^{ {\rm{12} } }{\rm{C(} }n, xd{\rm{)} } }^{ {\rm{lab} } }$ 

R(θL,En) $\frac{ {{\rm d}\sigma ({\theta _{\rm{L} } },{E_{\rm{n} } })} }{ {{\rm d}\Omega } }|_{ {}^{ {\rm{12} } }{\rm{C(} }n, xd{\rm{)} } }^{ {\rm{lab} } }$ 

15.1 0.122±0.015 15.6±1.8 0.168±0.019 18.8±2.1 0.228±0.024 22.1±2.4 20.0 0.092±0.015 11.1±1.7 0.129±0.019 13.6±2.0 0.186±0.032 16.8±2.9 25.1 0.052±0.008 5.94±0.89 0.104±0.016 10.2±1.5 0.133±0.035 11.2±3.0 30.0 0.061±0.009 6.45±0.98 0.073±0.011 6.7±1.0 0.110±0.045 8.5±3.5 35.0 0.041±0.008 3.99±0.79 0.072±0.013 6.1±1.1 0.092±0.019 6.6±1.3 40.0 0.024±0.006 2.18±0.55 0.053±0.010 4.12±0.76 0.089±0.014 5.72±0.93 45.0 0.057±0.012 4.62±0.97 0.065±0.012 4.54±0.82 0.091±0.015 5.35±0.88 50.0 0.059±0.010 4.33±0.77 0.066±0.014 4.18±0.88 0.115±0.051 6.1±2.7 55.0 0.047±0.010 3.14±0.67 0.077±0.014 4.43±0.83 0.095±0.018 4.63±0.88 θL(°) En= 37.8±2.8 MeV En= 44.2±3.6 MeV En= 52.5±4.7 MeV R(θL,En) $\frac{ {{\rm d}\sigma ({\theta _{\rm{L} } },{E_{\rm{n} } })} }{ {{\rm d}\Omega } }|_{ {}^{ {\rm{12} } }{\rm{C(} }n, xd{\rm{)} } }^{ {\rm{lab} } }$ 

R(θL,En) $\frac{ {{\rm d}\sigma ({\theta _{\rm{L} } },{E_{\rm{n} } })} }{ {{\rm d}\Omega } }|_{ {}^{ {\rm{12} } }{\rm{C(} }n, xd{\rm{)} } }^{ {\rm{lab} } }$ 

R(θL,En) $\frac{ {{\rm d}\sigma ({\theta _{\rm{L} } },{E_{\rm{n} } })} }{ {{\rm d}\Omega } }|_{ {}^{ {\rm{12} } }{\rm{C(} }n, xd{\rm{)} } }^{ {\rm{lab} } }$ 

15.1 0.339±0.060 27.9±4.9 0.390±0.099 26.8±6.8 0.43±0.11 24.8±6.5 20.0 0.228±0.055 17.5±4.2 0.356±0.093 22.5±5.9 − − 25.1 0.146±0.043 10.3±3.0 0.190±0.061 11.0±3.5 0.30±0.15 14.1±7.4 30.0 0.149±0.066 9.6±4.3 0.213±0.092 11.2±4.8 0.28±0.13 12.0±5.6 35.0 0.150±0.028 8.8±1.6 0.195±0.067 9.2±3.2 0.268±0.075 10.0±2.8 40.0 0.141±0.033 7.4±1.8 0.159±0.044 6.7±1.8 0.27±0.14 8.7±4.5 45.0 0.179±0.033 8.5±1.5 0.158±0.073 5.9±2.7 0.23±0.15 6.7±4.5 50.0 0.110±0.041 4.8±1.8 0.136±0.051 4.7±1.8 0.18±0.11 4.9±2.8 55.0 0.090±0.051 3.7±2.1 0.170±0.065 5.5±2.1 0.19±0.11 5.0±2.7 Table 2.Measured results of the12C(n,xd) reactions.R
$ ({\theta _{\rm{L}}},{E_{n}}) $ are the ratios of the differential cross sections of the12C(n,xd) reactions to those of then-pscattering.$\frac{{{\rm d}\sigma ({\theta _{\rm{L}}},{E_{n}})}}{{{\rm d}\Omega }}|_{{}^{12}{\rm{C(}}n, xd{\rm{)}}}^{{\rm{lab}}}$ are the differential cross sections of the12C(n,xd) reactions normalized by the JENDL-4.0/HE-2015 [22] data of then-pscattering.The sources of uncertainties and their magnitudes for the present work are listed inTable 3. Note that the uncertainties of the counts of then-pscattering are included in the present work because the proton counts were used for the relative measurement [33].
Sources of the uncertainty Magnitude (%) Statistical error of deuteron counts (Cd(θL,En)) 8.3 − 25.0 ΔE-Eidentification of deuterons (Cd(θL,En)) 1.1 − 39.7 Deuteron event selection in the 2-D spectra of the CsI vsEnplots (Cd(θL,En)) 1.4 − 53.4 Uncertainty from the measurement of proton counts from the CH2sample (Cp(θL,En)) [21] 2.7 − 5.3 Uncertainty fromNH 2.0 Uncertainty fromNC 2.0 En(horizontal error) 6.0 − 9.0 Overall uncertainty 10.3 − 66.8 Table 3.Sources of uncertainties and their magnitudes.
The relatively short beam duration did not help obtain sufficiently good statistics and made it difficult to determine the valid area of the deuteron events in the 2-D spectrum scatter plots, including theΔE-Espectra and theEn-CsI spectra, as presented inFig. 7andFig. 5 (a). This consequently brought about a rather large overall uncertainty. In addition, the uncertainty ofEn, i.e., the horizontal error shown inTable 3, is half the value of the width of theEninterval, as explained in section IVE. The horizontal error increases asEnincreases.
As shown inFig. 9, for all six energy regions, 25.3 ± 1.5, 28.6 ± 1.9, 32.7 ± 2.3, 37.8 ± 2.8, 44.2 ± 3.6, and 52.5 ± 4.7 MeV, the differential cross sections measured in the present work monotonically decline asθLincreases. ForEn= 28.6 ± 1.9 MeV, the present results favor the data of Slypen et al. atEn= 29.5 MeV [13], while the data by Subramanian et al. atEn= 27.4 MeV [16] are noticeably larger with fluctuations in magnitude. From 32.7 MeV to 37.8 MeV, the present results agree well with the data of Slypenet al. [13] and Subramanianet al.[16]. The present results show a strong forward-peaked nature and fall drastically with the increase ofθL, which is supported by all the results from the previous measurements. This effect is better characterized by the INCA code theoretical calculations by Brenneret al. [19], although the calculations predict results higher than the present ones and the previous measurement data at forward angles [13]. In addition, the decrease in the results asθLincreases from the Talys-1.9 code, the JENDL-4.0/HE-2015 library, and the ENDF-B/VIII.0 is much milder.
The present data generally agree with the previous measurements except for the data of McNaughton atEn= 56.0 MeV [9]. As shown inFig. 9 (f), McNaughton’s data are larger than most of the other results, especially forθL
$\leqslant $ 40°, while the present results are in better agreement with the data of Slypenet al. [13]. In contrast, Young’s data for the12C(n,d)11B reaction at 60.0 MeV [18] are significantly smaller than the rest, including the experimental data and all the theoretical calculations, which gives a scope of the contribution of the12C(n,d)11B reaction to the deuteron production from carbon. The data from the INCA code theoretical calculations at 40 MeV are larger than the present data and the previous measurements at the forward angles; however, they are in good accordance with the present results and the previous ones forθL$\geqslant $ 25°.In general, despite the relatively large uncertainties, the present results agree with most of the previous experimental data relatively well considering the error bars in the whole energy region. The present results also agree with those of the theoretical calculations by Brenneret al. [19] at large emission angles and in higher neutron energy regions (θL> 30° andEn> 40 MeV).
-
In the present paper, the angle-differential cross sections of the12C(n,xd) reactions relative to those of then-pscattering at six neutron energies from 25 MeV to 52 MeV are measured at the CSNS back-n white neutron source. Moreover, the present work includes theoretical calculations using the Talys-1.9 code with default parameters. Both the measured and the calculated results are compared with the data from the previous measurements, the evaluated data from the JENDL-4.0/HE-2015 library and the ENDF-B/VIII.0 library using GNASH code, and those from theoretical calculations based on INCA code. The measured results agree with most of the previous measurements in terms of the trend and magnitude (except for Young’s dedicated data for the12C(n,d)11B reaction) in the neutron energy region of the present work and are in accordance with the theoretical calculations by Brenneret al. atEn= 50 and 60 MeV. The present work is the first white-neutron-source-based measurement of angular-differential cross sections of12C(n,xd) reactions in the several tens of MeV range. The present results provide relative differential cross section data at a wider neutron energy range from 25 MeV to 52 MeV than the previous ones, all of which are obtained using mono-energetic neutrons.
-
The authors are grateful to the operating crew of the CSNS white neutron source. Senior Engineer Yongli Jin from the China Institute of Atomic Energy is appreciated for the support in data reading from the ENDF-B/VIII.0 library. The authors would also like to thank Prof. Zhenpeng Chen from Tsinghua University for valuable discussions.
Measurement of differential cross sections of neutron-induced deuteron production reactions on carbon from 25 to 52 MeV
- Received Date:2021-01-29
- Available Online:2021-06-15
Abstract:The angle-differential cross sections of neutron-induced deuteron production from carbon were measured at six neutron energies from 25 to 52 MeV relative to those ofn-pelastic scattering at the China Spallation Neutron Source (CSNS) Back-n white neutron source. By employing theΔE-Etelescopes of the Light-charged Particle Detector Array (LPDA) system at 15.1° to 55.0° in the laboratory system, ratios of the angle-differential cross sections of the12C(n,xd) reactions to those of then-pscattering were measured, and then, the angle-differential cross sections of the12C(n,xd) reactions were obtained using the angle-differential cross sections of then-pelastic scattering from the JENDL-4.0/HE-2015 library as the standard. The obtained results are compared with data from previous measurements, all of which are based on mono-energic neutrons, the evaluated data from the JENDL-4.0/ HE-2015 library and the ENDF-B/VIII.0 library, and those from theoretical calculations based on INCA code and Talys-1.9 code. Being the first white-neutron-source-based systematic measurement of the angle-differential cross sections of neutron-induced deuteron production reactions on carbon in several tens of MeV, the present work can provide a reference to the data library considering the lack of experimental data.


 DownLoad: