


 Abstract
 HTML
HTML Reference
 Related
 PDF
PDF


-
The study of neutron deficient nuclei in the mass regionA~130 has been an interesting subject in the nuclear structure physics [1], as this region provides an opportunity to test nuclear models. For the neutron deficient nuclei in this mass region, it is known that the proton Fermi surface lies in lower part of theh11/2sub-shell which suggests aT=0 driving force for the onset of collective prolate shape. Wadsworth et al. [2] have presented the first evidence for the occurrence ofνi13/2[660]1/2+neutron band in133Sm isotope. This was in fact the first observation of the occupation of this orbital in a nucleus withN<73. Later Regan et al. [3] have investigated the low lying rotational band structures of133Sm using the40Ca+96Ru reaction at a beam energy of approximately 180 MeV and observed five new bands in133Sm, out of which two are strongly coupled bands predicted to be built upon Nilsson configurationsνh11/2[523]7/2−andνd5/2[402]5/2+. They also have found evidence for a second decoupled band built upon a singleh9/2[541]1/2−orbital, in addition to the previously reportedνi13/2intruder band [2]. Parry et al. [4] have studied high spin states of133Sm via the96Ru (40Ca, 2pn) reaction and studied rotational structures and their characteristics. They discovered new coupled band in133Sm that leads to the reassignment of the configuration of one of the previously [2,3] identified bands. The calculations of Parry et al. [4] predict strong polarization effects for different configurations which result in quadrupole deformations that vary fromβ2~ 0.28 to ≥ 0.38. In addition, Parry et al. [4] have identified a new band which appears to be the signature partner to previously [3] assigned decoupled band based on configurationνi13/2[600]1/2+.
Mullins et al. [5] was the first to propose the low level scheme of135Sm. They have identified the yrast band composed ofα=−1/2 andα=+1/2 signatures of the 1νg7/2band. They have also proposed the possibility for the band head spin of this yrast band atIπ= 7/2+. Furthermore, they proposed the negative parity band to be based on a neutron in theh11/2orbital. Theα=−1/2 component of this negative parity band comes lower in energy. Theα=+1/2 signature component of this band has been identified as much weaker signature. The authors of Ref. [5] have proposed the band head spin of this negative parity band atIπ=9/2−.
In case of137Sm, the yrast band is based on a coupled neutron orbital from the upperh11/2mid-shell [6], and built on the [514]9/2−Nilsson orbital. Both signature components of this orbital were observed in this nucleus. Paul et al. [7] have predicted deformation for this singleh11/2quasi-neutron state asε2~0.20 andε4~0.026. Later on Alvarez et al. [8] have identified a positive parity band based on Nilsson configuration [400]1/2+in137Sm.
After analyzing the literature, it is found that no single theoretical framework has been used in the past to study the band spectra in all the odd mass133,135,137Sm. Moreover, it is desired that odd mass Sm nuclei can be consistently described alongside even even Sm isotopes [9,10], which is a strict test for microscopic models. In the present work, an attempt has been made to study spectroscopic properties of133-137Sm isotopes by using projected shell model and to reproduce the ground state band, excited bands, their relative band head energies, transition energies between two angular momentum states and electromagnetic transition strengths. Further, it is of interest to determine the extent to which the present calculation can account for the ground state and excited state deformations of133-137Sm isotopes by using projected shell model. In this model, both pairing and deformation are treated self consistently. The pairing interaction is extended to incorporate both monopole and quadrupole terms. Therefore, it is necessary to test this model in a wider context within this mass regionA~130-140 and also to investigate the role of proton configurations at higher spins.
The structure of the paper is as follows. In Section 2, a brief outline of the projected shell model is given. Results for calculated energy level schemes, transition energies between two angular momentum states, kinetic moment of inertia and discussion on band diagrams are presented in Section 3. Section 4 deals with the electromagnetic transition strength ratios for the yrast bands of133-137Sm isotopes. In Section 5, the work is summarized and the conclusions are presented.
-
Projected Shell Model [11] is basically a shell model developed for medium and heavy nuclear systems. It was designed to overcome the difficulties of the spherical shell model. In medium and heavy deformed nuclei, applying spherical shell model becomes unfeasible because of large dimensionality and its related problems. For such systems Hara and Sun [11] used deformed basis and the projected technique. A Fortran Code of projected shell model [12] was also developed later for carrying out calculations even on any modern PC, without any difficulties. In recent past, Sun [13] in his review article of PSM demonstrated how heavy deformed nuclei can be effectively explained with different truncation schemes.
-
In this section, a brief introduction of the theory is presented. The complete description of the theory is given in the Refs. [11-18]. The projected shell model builds its model basis by using deformed quasiparticle-basis (qp), but selection of deformed basis involves violation of rotational symmetry of wave functions. The broken rotational symmetry in the wavefunction is restored by angular momentum projection technique [19]. The PSM, wavefunction can be written as
$\left. {|\sigma ,IM} \right\rangle = \sum\limits_{K\kappa } {f_{IK\kappa }^\sigma \hat P_{MK}^I\left. {|{\varphi _\kappa }} \right\rangle }, $

(1) where
$\left. {|{\varphi _\kappa }} \right\rangle $ denotes the qp-basis, the indexσlabels the states with the same angular momentum andκlabels the basis states. For the present calculations, the qp configurations for odd neutron nuclei are taken to be$\left. {|{\varphi _\kappa }} \right\rangle = a_\nu ^{\rm{\dagger }}|0\rangle ,a_\nu ^{\rm{\dagger }}a_{\pi 1}^{\rm{\dagger }}a_{\pi 2}^{\rm{\dagger }}|0\rangle. $

(2) The chosen energy window around the Fermi surface gives rise to a basis space,
$\left. {|{\varphi _\kappa }} \right\rangle $ in Eq. (2) of the order of 37. In the Eq. (1),$\hat P_{MK}^I$ is the angular momentum projection operator [19], which projects out from the intrinsic configuration$\left. {|{\varphi _\kappa }} \right\rangle $ states with good angular momentum and$f_{IK\kappa }^\sigma $ are the weights of the basis states. The weights$f_{IK\kappa }^\sigma $ are determined by the diagonalization of the HamiltonianHI, in the space spanned by the states of Eq. (1). This leads to the eigen value equation$ \mathop \sum \limits_{K'\kappa '} \left( {H_{K\kappa ,K'\kappa '}^I - E_I^\sigma N_{K\kappa ,K'\kappa '}^I} \right)f_{IK'\kappa '}^\sigma = 0 $

(3) with a normalization condition
$ \mathop \sum \limits_{K\kappa K'\kappa '} f_{IK\kappa }^\sigma N_{K\kappa ,K'\kappa '}^If_{IK'\kappa '}^{\sigma '}{\rm{ = }}{\delta _{\sigma \sigma '}}, $

(4) where
$ H_{K\kappa,K'\kappa'}^I $ and$ N_{K\kappa,K'\kappa'}^I $ are, respectively the matrix elements of the Hamiltonian and the norm. The projection of an intrinsic state$\left. {|{\varphi _\kappa }} \right\rangle $ onto a good angular momentum generates a rotational energy given by${E_\kappa }(I) = \frac{{\left\langle {{\varphi _\kappa }\left| {\hat H\hat P_{KK}^I} \right|{\varphi _\kappa }} \right\rangle }}{{\left\langle {{\varphi _\kappa }\left| {\hat P_{KK}^I} \right|{\varphi _\kappa }} \right\rangle }} = \frac{{H_{K\kappa K'\kappa '}^I}}{{N_{K\kappa K'\kappa '}^I}}. $

(5) The above equation represents expectation value of the Hamiltonian with respect to a projected multi-qp stateκ.
The total Hamiltonian in the present study is of the form
$\hat H = {\hat H_0} - \frac{1}{2}\chi \sum\limits_\mu {\hat Q_{2\mu }^{\rm{\dagger }}{{\hat Q}_{2\mu }}} - {G_M}{\hat P^{\rm{\dagger }}}\hat P - {G_Q}\sum\limits_\mu {\hat P_{2\mu }^{\rm{\dagger }}{{\hat P}_{2\mu }}}. $

(6) In the above equation
${\hat H_0}$ is spherical single particle Hamiltonian. The strengthχof the quadrupole-quadrupole (QQ) interaction is related to the quadrupole deformation [11] and is adjusted such that the measured quadrupole deformation parameter (ε2) is obtained [20] as a result of the HFB self-consistent method [11,21,22]. In the present case, the valence space of the PSM includes three major harmonic oscillator shells withN= 3,4,5 for protons and 4,5,6 for neutrons. The Nilsson parametersκandμfor these major harmonic oscillator shells are taken from the Ref. [23] for133,135,137Sm isotopes.Table 1, represents the quadrupole (ε2) and hexadecapole (ε4) deformation parameters [24,25] used for both positive as well as negative parity bands of133-137Sm.Nuclei 133Sm 135Sm 137Sm ε2 0.330 0.275 0.20 ε4 0.035 0.070 0.04 Table 1.Deformation parameters used for both positive and negative parity bands of133−137Sm.
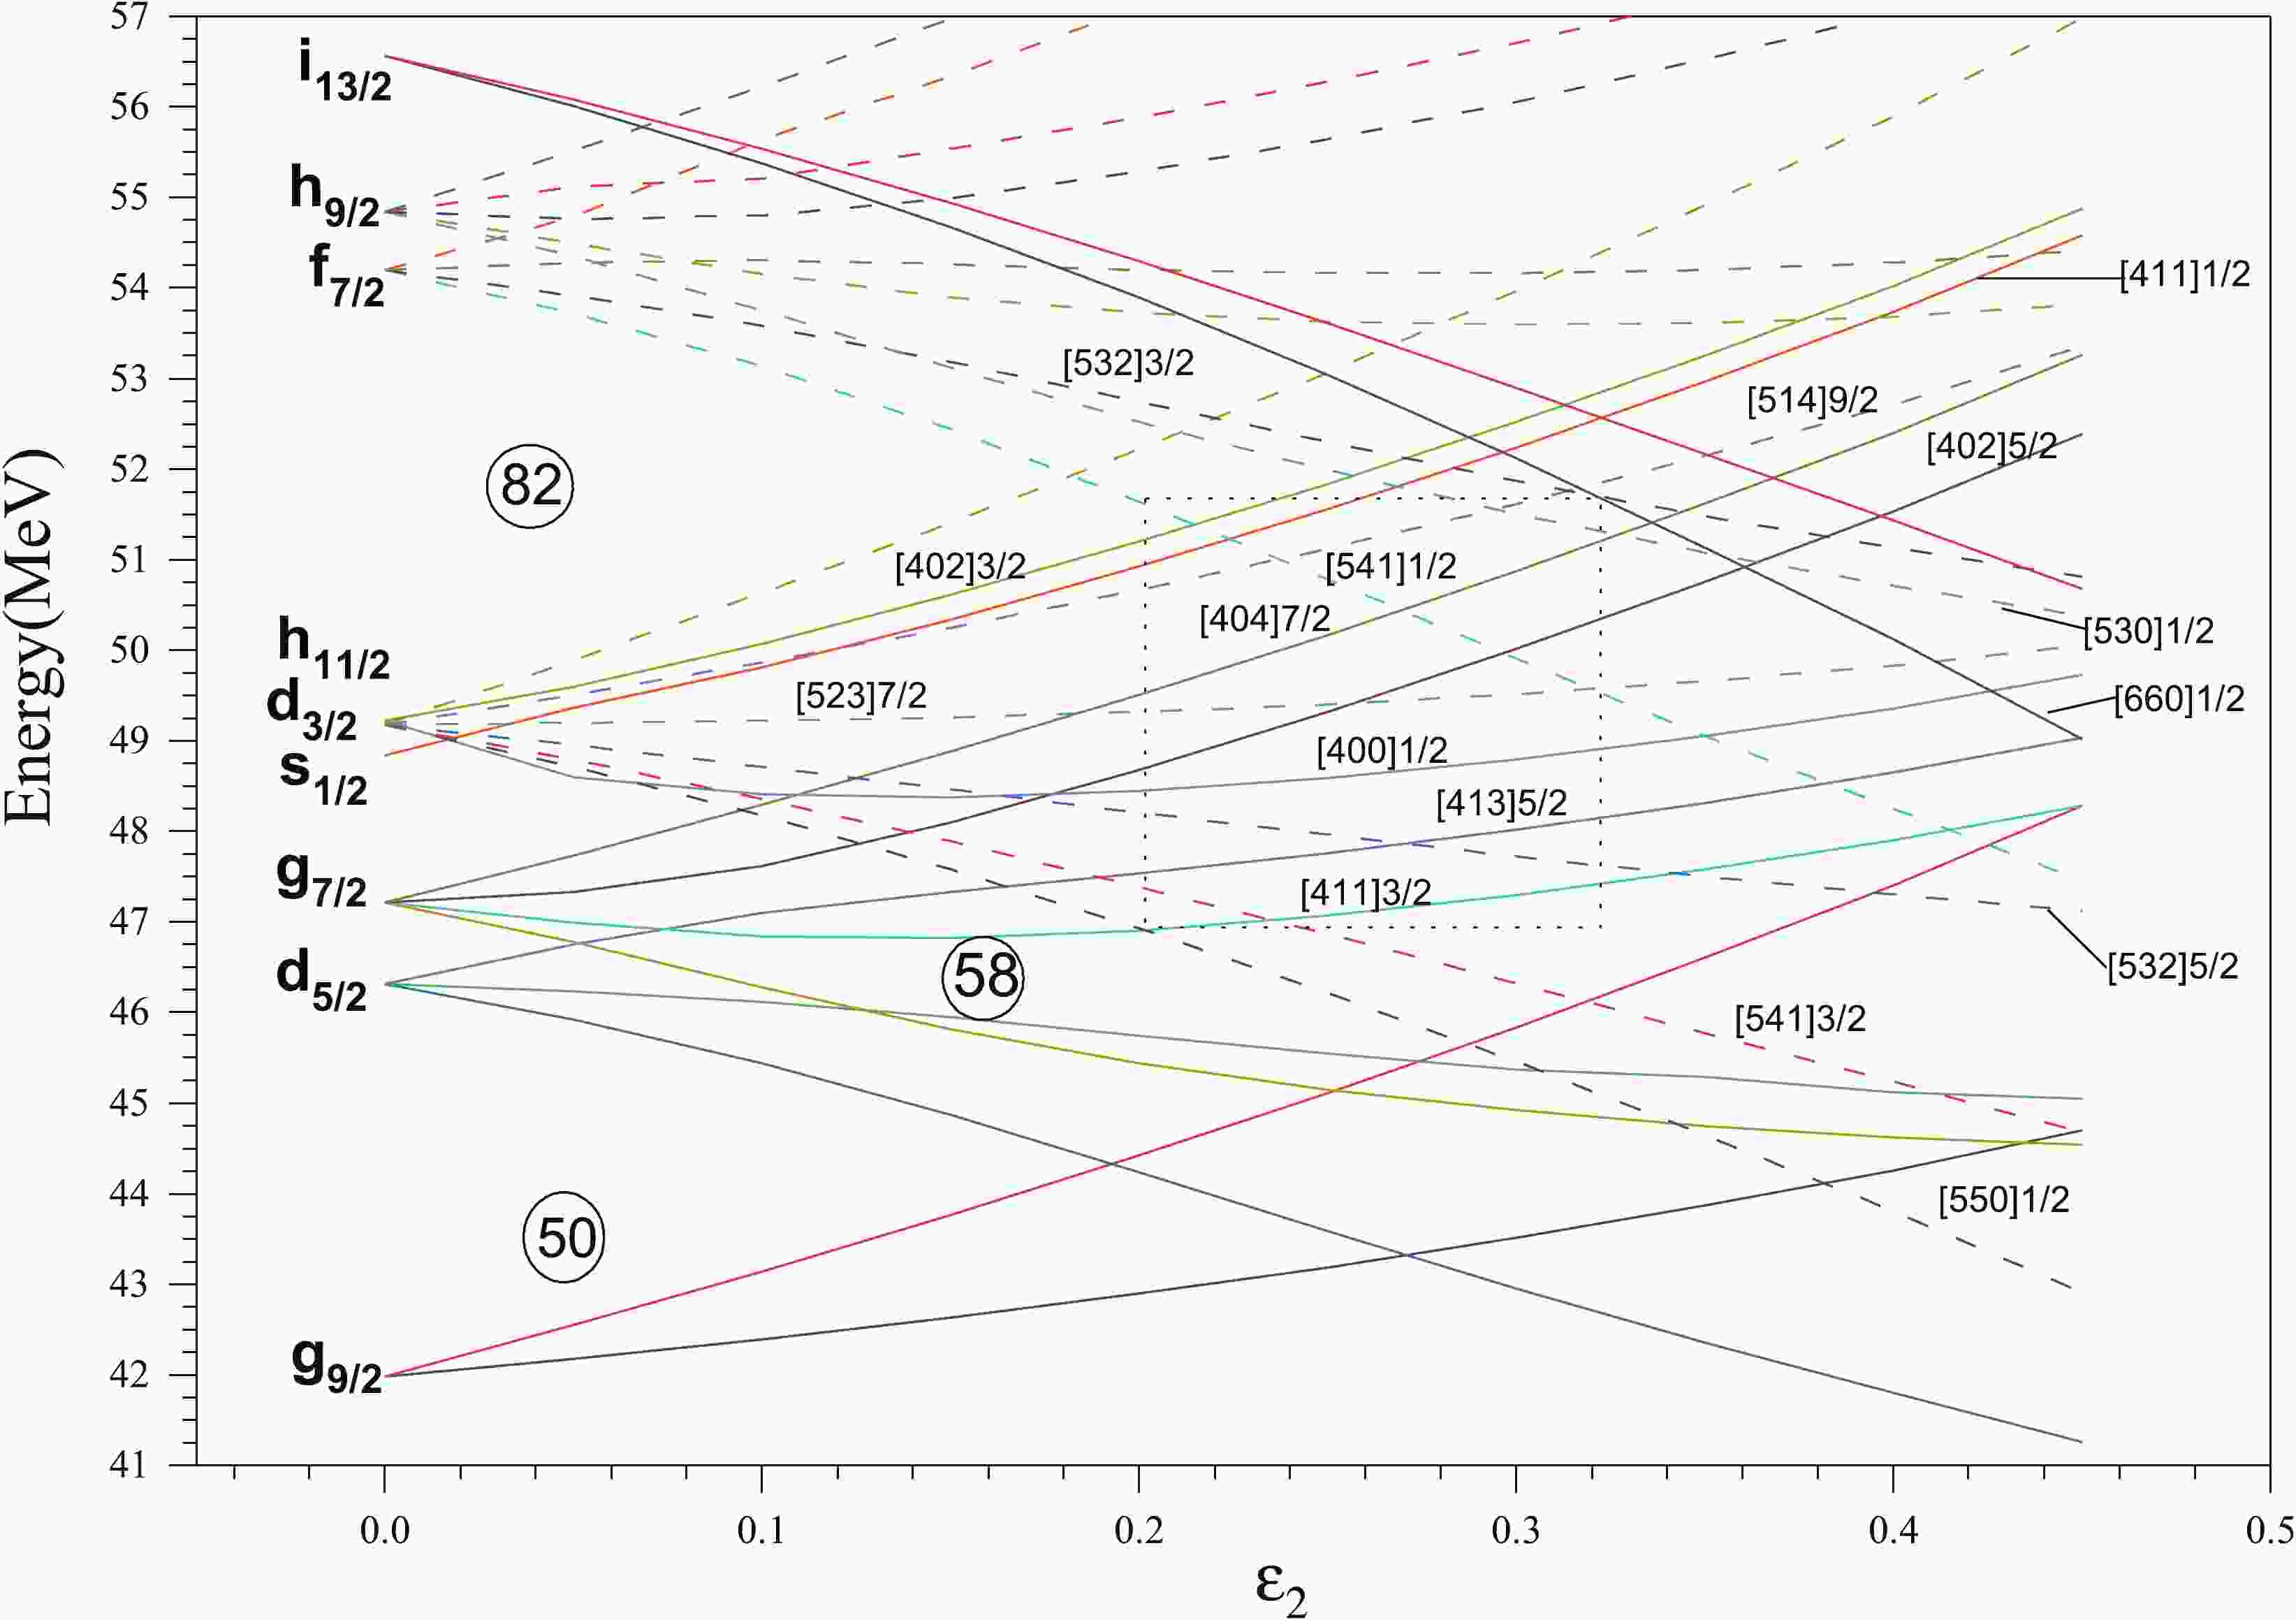
The Nilsson diagram obtained for neutrons by taking Nilsson parameters of [23] for quadrupole deformations (ε2) is displayed inFig. 1. In this Fig., the positive parity and negative parity states are represented by solid and dotted lines, respectively. The states in the dotted rectangle represent the range of Nilsson states near the fermi surface and range of deformationε2=0.20−0.33 within which the133-137Sm isotopes lie. It can be seen fromFig.1, that the positive parityK=5/2 from 2d5/2;K=3/2,5/2,7/2 from 1g7/2;K=1/2,3/2 from 2d3/2;K=1/2 from 3s1/2, orbitals and negative parity,K=3/2,5/2,7/2/,9/2 from 1h11/2;K=1/2 from 2f7/2,1h9/2orbitals lie inside the rectangle in the deformation range 0.20−0.33 for normally deformed bands of133−137Sm. However, beyondε2=0.36,K=1/2 fromi13/2orbital crosses theK=5/2,7/2 from the 1g7/2orbital. In the present work, the normally deformed bands from theN=4 and 5 oscillator shells, that lie in the rangeε2=0.20-0.33 of deformation in133−137Sm are discussed. The highly deformed (HD) and super deformed (SD) neutron [660]1/2+(νi13/2) bands [4,5,8,26,27] appear at enhanced quadrupole deformations and are not studied here due to the limitation of present calculations.
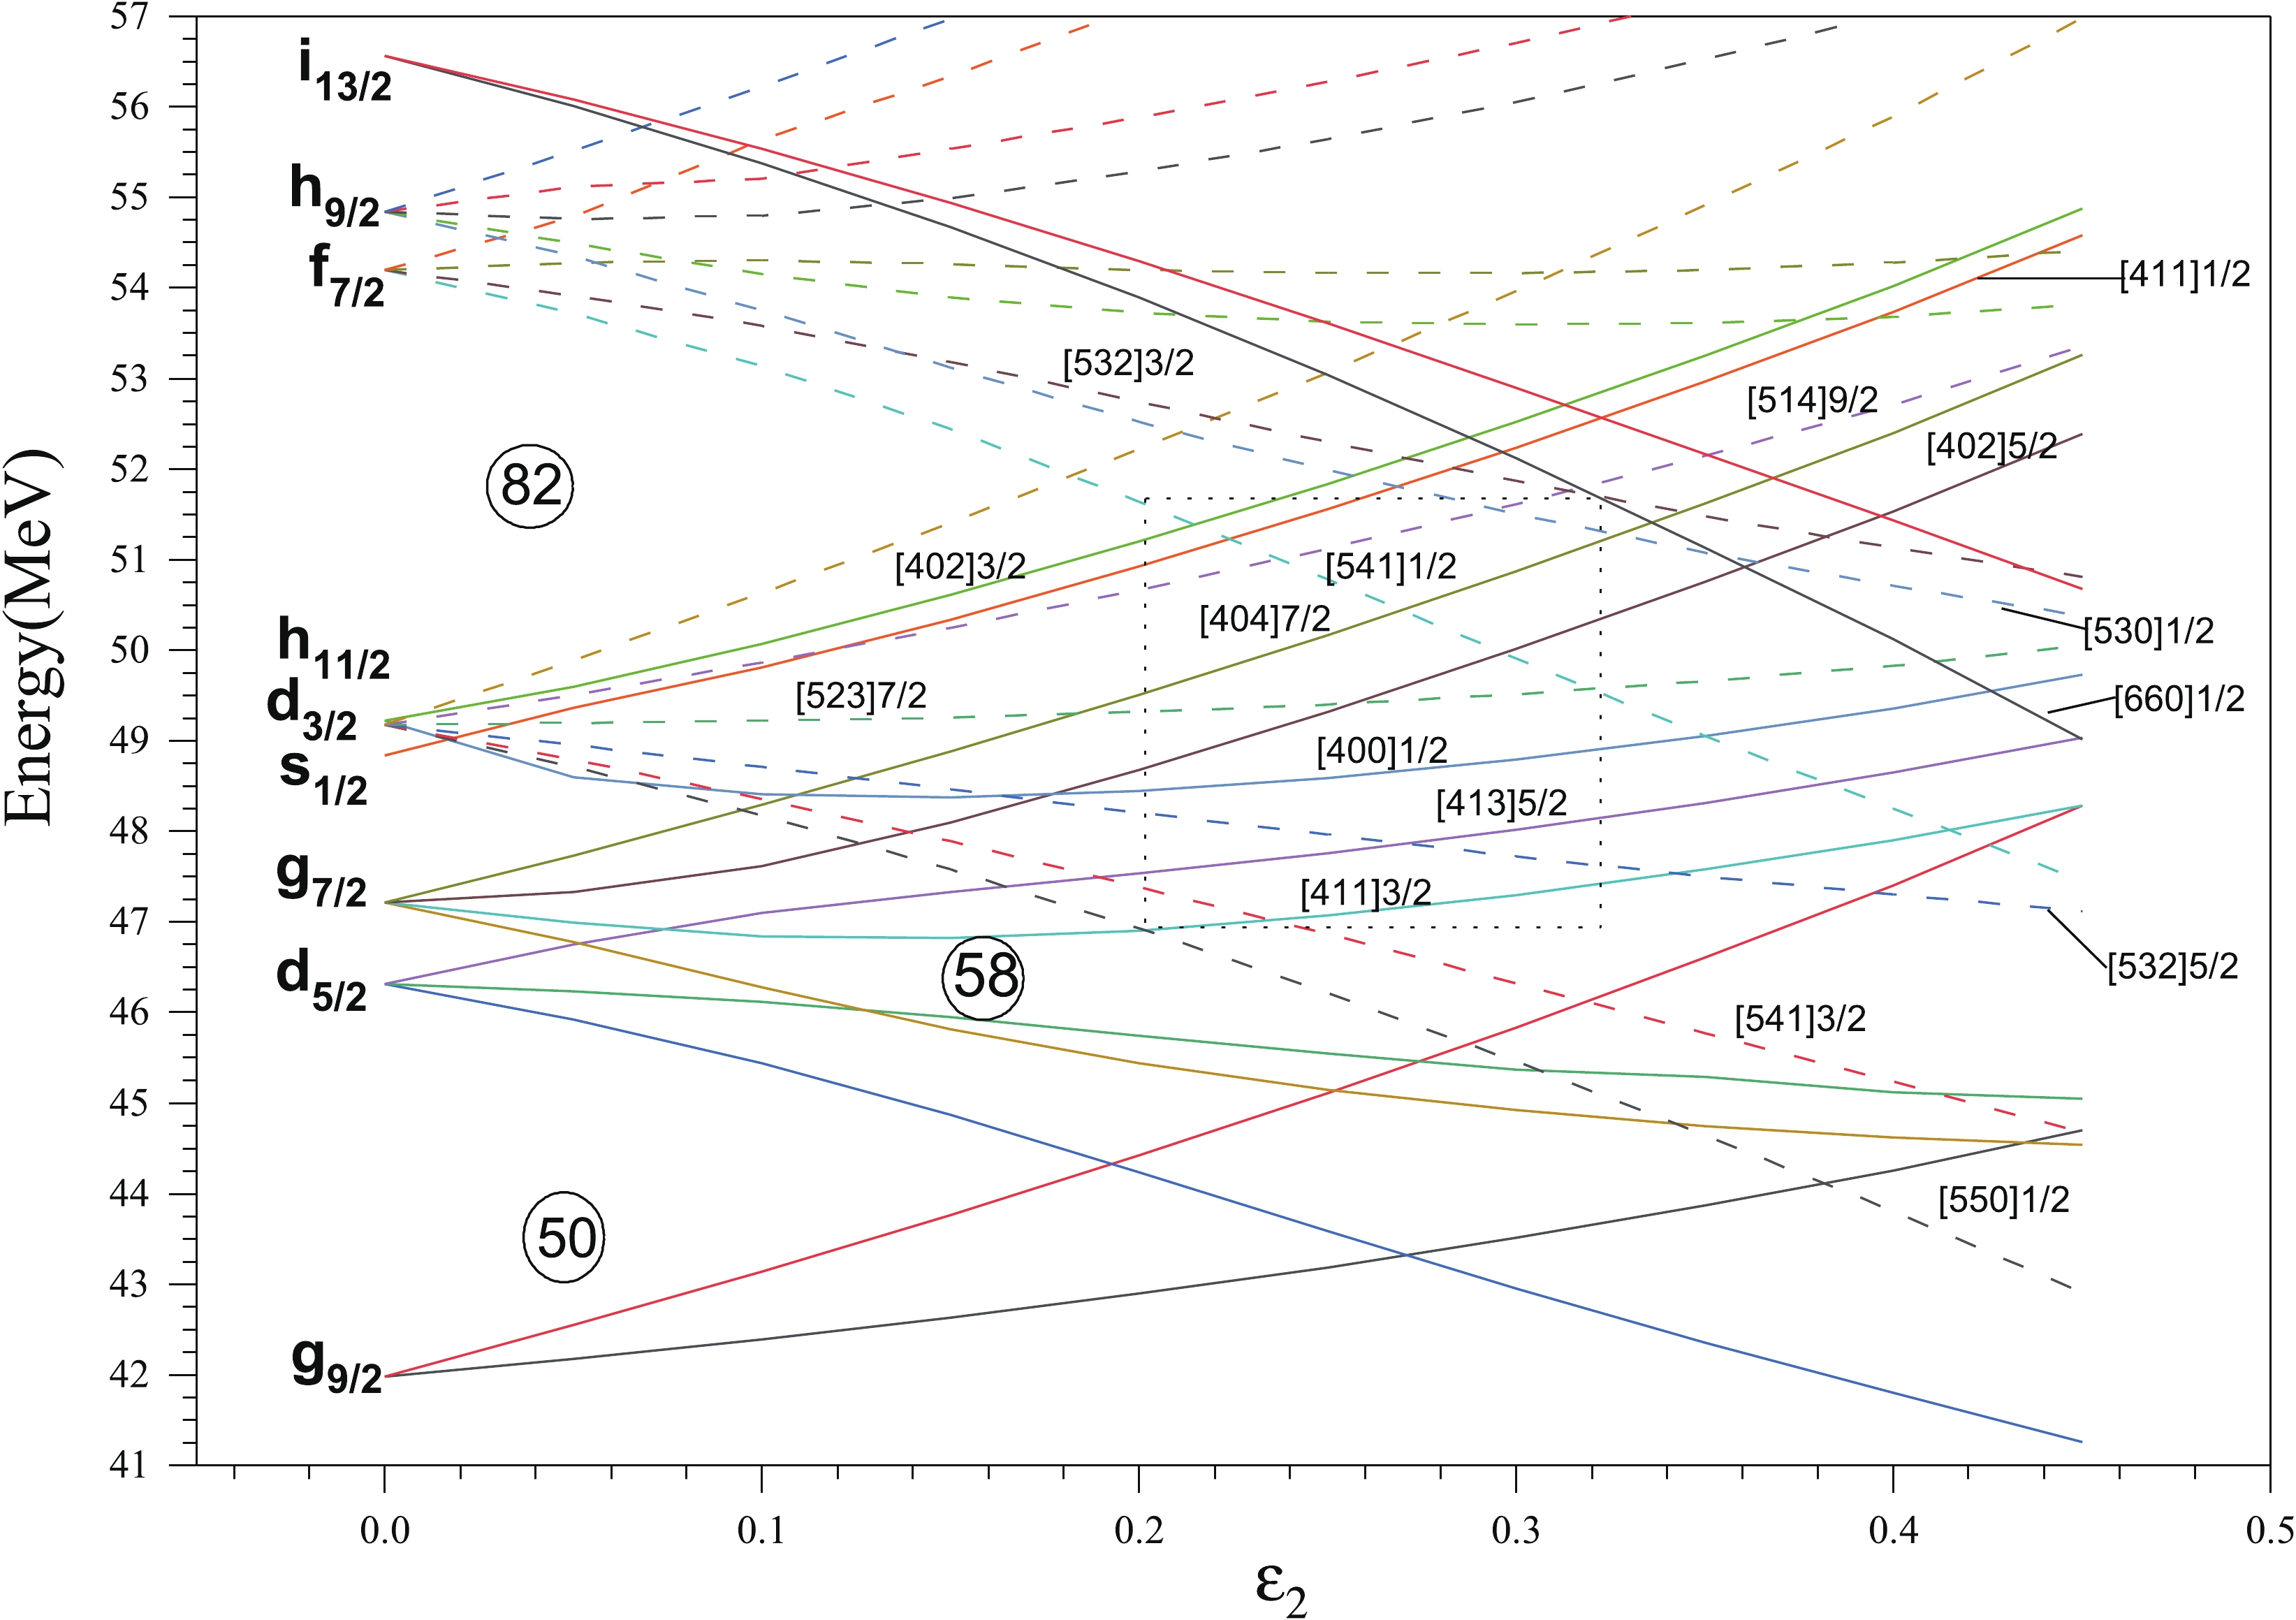
Figure 1.(color online) The Nilsson diagram for neutrons, obtained by using Nilsson parameters of Ref. [23].
The monopole pairing interaction constantGMis taken as
${G_M} = \left( {{G_1} \mp {G_2}\frac{{N - Z}}{A}} \right)\frac{1}{A}\;{\rm{MeV}},$

(7) where minus (plus) sign is for neutrons (protons). TheGMis adjusted viaG1andG2and their values are taken as 19.60 and 13.60, for the calculation of133-137Sm isotopes. The quadrupole pairing strengthGQis proportional toGMwith a proportionality constant (γ) taken as 0.16 (positive parity) and 0.28 (negative parity) for133Sm, 0.28 (positive parity) and 0.20 (negative parity) for135Sm, and 0.24 for137Sm. The odd mass nuclei are more sensitive to single particle states as compared to even-even nuclei due to the occupation of different single particle orbitals. For example, the ground state of133Sm arises from 5/2+[413] neutron configuration but with the addition of four neutrons the ground state of137Sm arises from 9/2−[514] neutron configuration. Therefore, γ parameter has been adjusted to reproduce the band head spin, energies and crossings of 1-qp band by 3-qp bands [22]. In case of133Sm, the positive parity band is the ground state band and the relative band head energy of negative parity yrast band is not known experimentally, therefore, to get the positive value of band head energy of negative parity bands, γ has been fixed as 0.28. For135Sm, the experimental band head energies of yrast positive and negative parity bands are not known. In this nucleus for delaying the crossing of 1-qp (quasiparticle) bands by 3-qp bands, the value of γ has been fixed as 0.28 for positive parity bands and 0.20 for negative parity bands.
-
Experimentally seven energy bands have been identified in this nucleus, out of which six are coupled bands designated as bands 1,2; 3,4; 5,6 and a decoupled band 7 [4]. Two bands are said to be coupled if they are linked with each other by dipole transitionsM1. In case of133Sm, band 7 is isolated and is not connected with any other neighboring band and therefore is called a decoupled band. The two pairs of bands 1,2 and 5,6 are strongly coupled bands, as indicated by large experimentalB(M1)/B(E2) ratios [4] for the low spin transitions in the two pairs of bands. In the case of decoupled bands,M1/E2 transitions are either absent or weak, depending on the amount of decoupling. Two pairs of bands 1,2 and 3,4 are of positive parity and three bands 5,6 and 7 are of negative parity.
-
The band spectra for133Sm nucleus have been obtained with quadrupole and hexadecapole deformation parametersε2=0.330 andε4=0.035 for all the bands of133Sm. These values of deformation parameters are close to the values of 0.31 and 0.040, predicted for this nucleus by the authors of Ref. [24]. The calculations of Ref. [4] suggest a quadrupole deformation of 0.33 for the decoupled band 7 of133Sm. Therefore, to obtain all the bands 1-7 of133Sm, the value ofε2is chosen as 0.33. In a band diagram [11], rotational behavior of each configuration as well as its relative energy compared to other configurations is easily visualized. In these band diagrams, only low-lying projected bands are shown as the essence of physics of interest is satisfactorily reflected from these low-lying bands.
InFig. 2, we plot the relevant low lying 1-qp and 3-qp positive parity bands in133Sm, along with their configurations. From theFig. 2, it is seen that 1-qp neutron band built onK=5/2 and having configuration 1ν5/2+[413] (2d5/2), is lowest in energy up to the spin (I) = 31/2+.
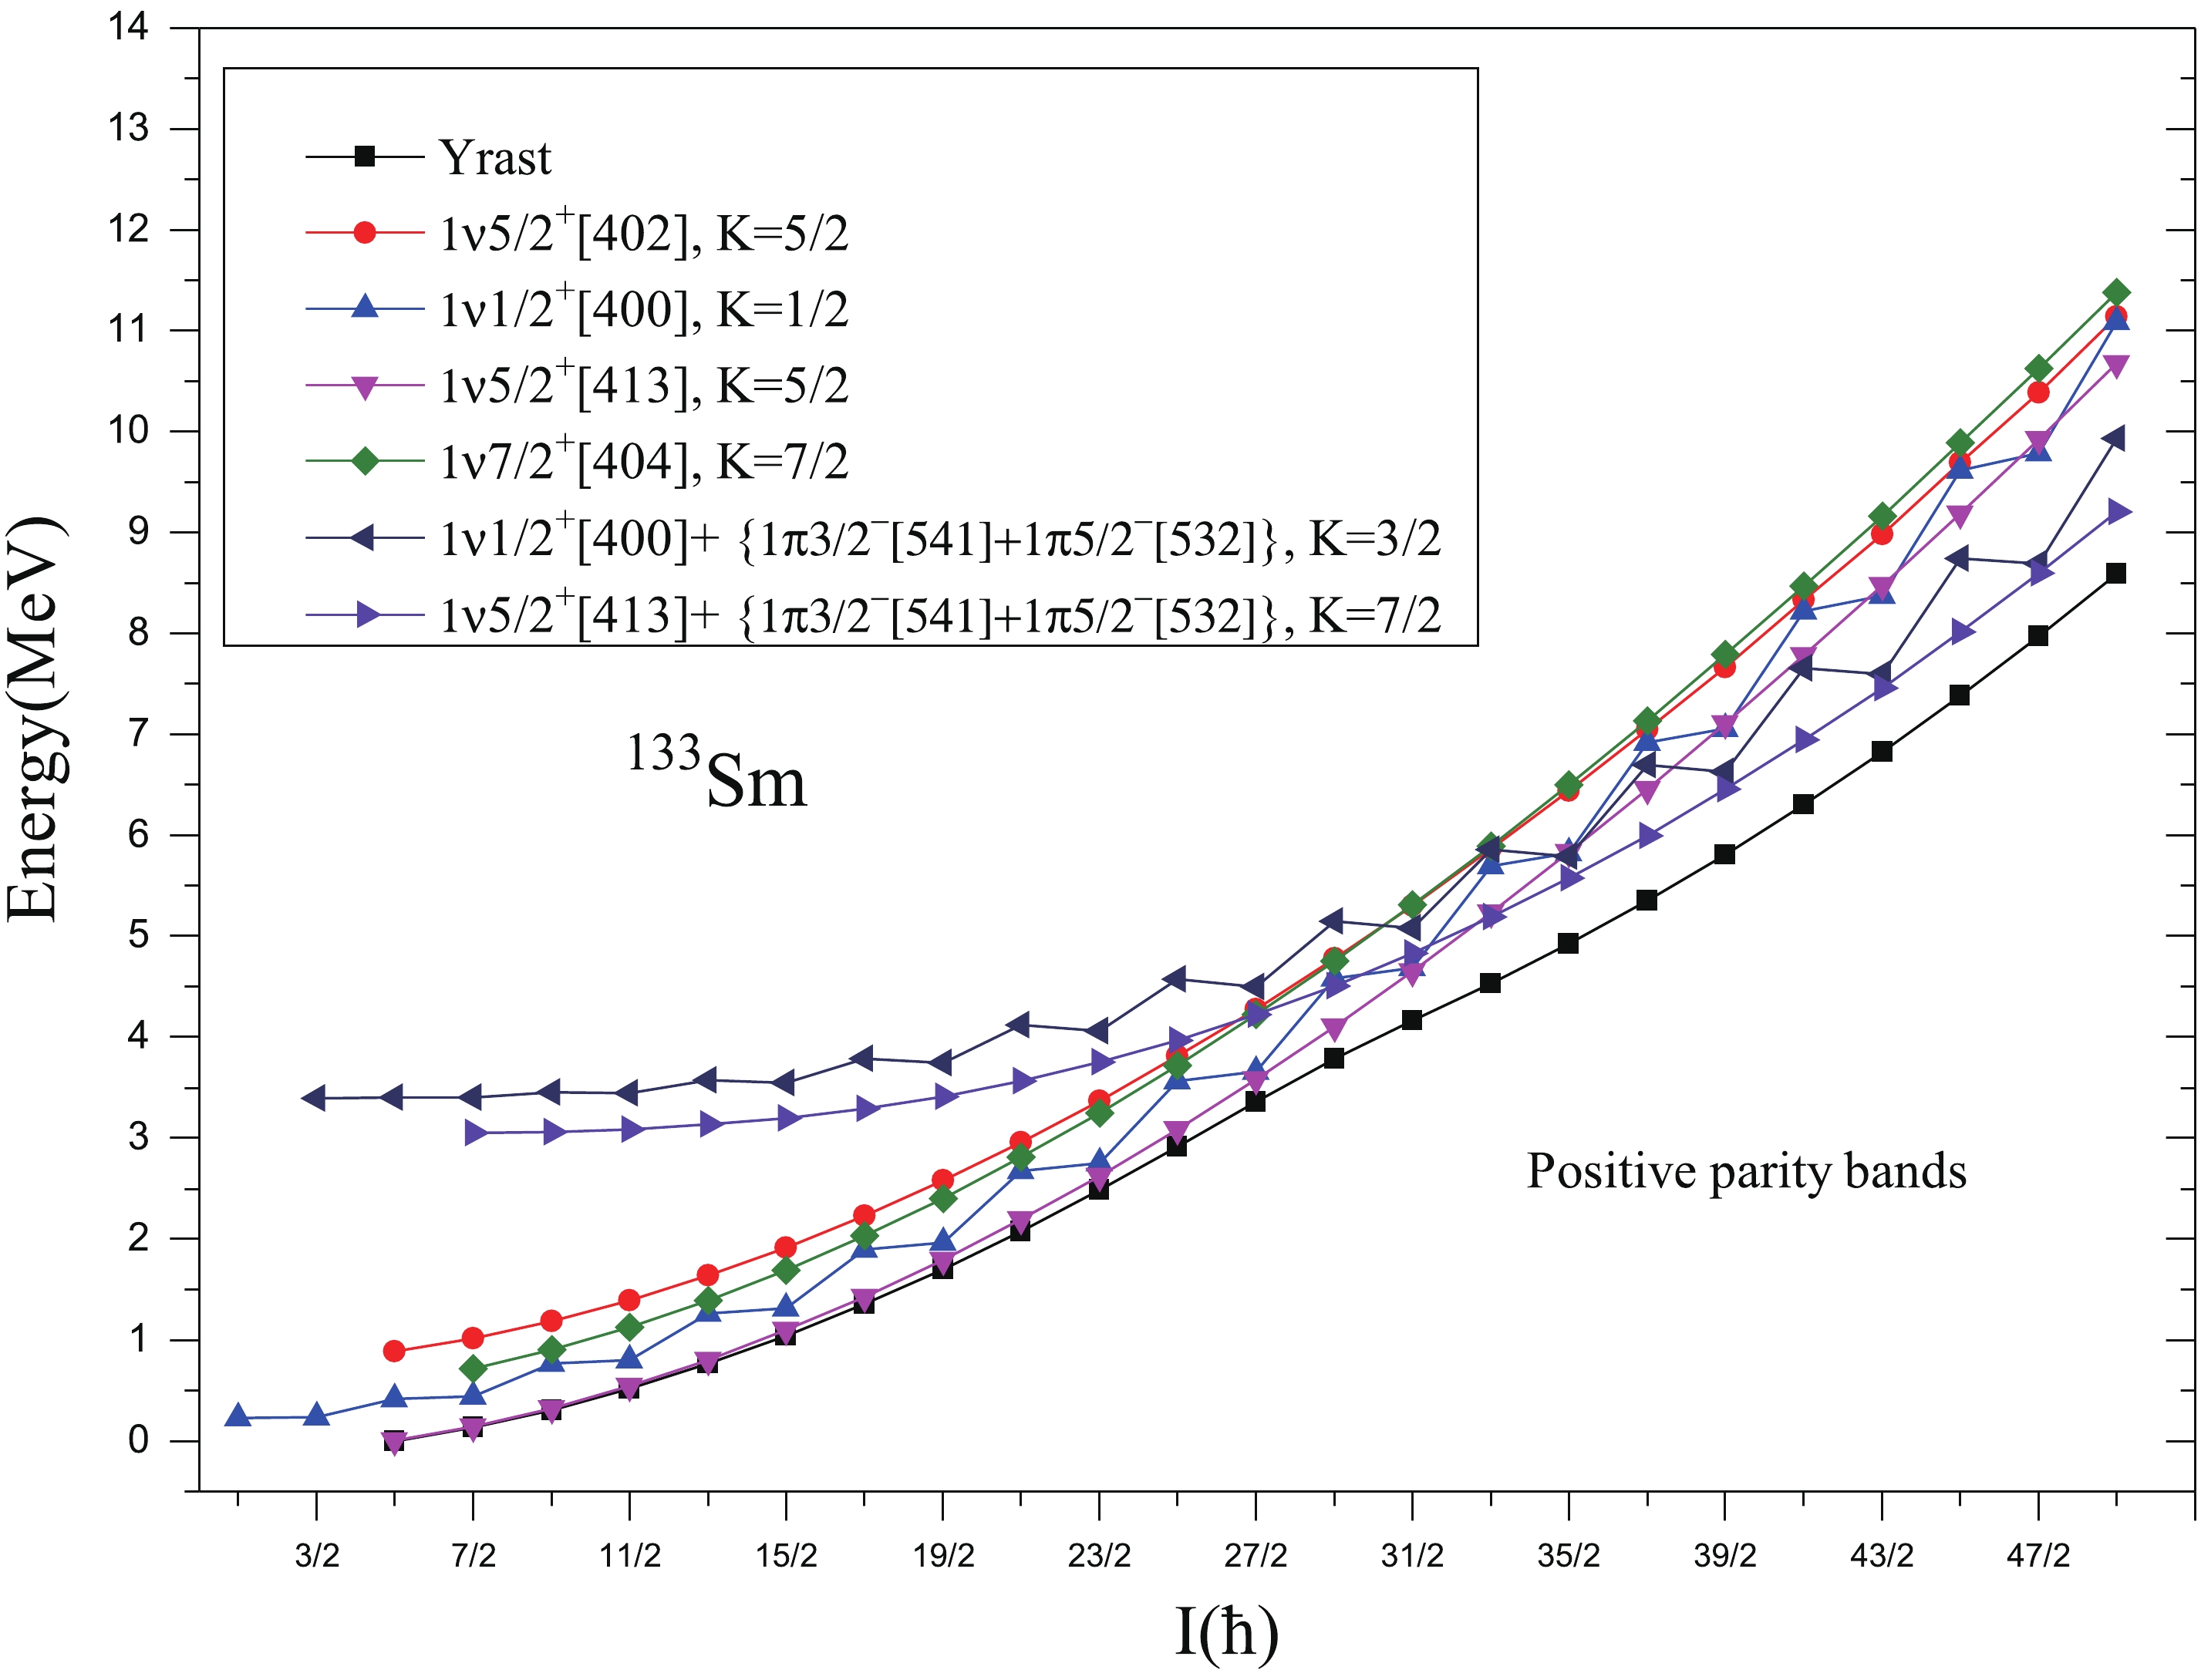
Figure 2.(color online) Band diagram for positive parity bands for133Sm. Only low-lying and significant bands are taken.
Experimentally, bands 1 and 2 shown inFig. 3are lowest positive parity energy bands available for comparison with theoretical results. We can, therefore, identify them with the bands obtained by us theoretically. The calculated results also support and are consistent with the band head spin and configuration assigned to the lowest positive parity band built onK=5/2 by the authors of Refs. [3,4]. Also, from the comparison of calculated and experimental energy spectra given inFig. 3, it is clear that the agreement between calculated and experimental spectra [4,28] of band 1 and 2 (α=±1/2) is reasonably good. The difference between calculated and experimental values at the highest known spinI=29/2+(α=+1/2) of band 1 is 0.261 MeV and the difference at the highest known spinI=27/2+(α=−1/2) of band 2 is 0.293 MeV. At spin 33/2+, this ground state band is crossed by two 3-qp bands (as shown in the band diagram ofFig.2). This crossing by 3-qp bands causes a significant change in the yrast structure from 33/2+onwards. The yrast states from 33/2+onwards are predicted to arise from the superposition of two 3-qp bands having configurations 1ν5/2+[413]+{1π3/2−[541]+1π5/2−[532]},K=7/2 and 1ν1/2+[400]+ {1π3/2−[541]+1π5/2−[532]},K=3/2.
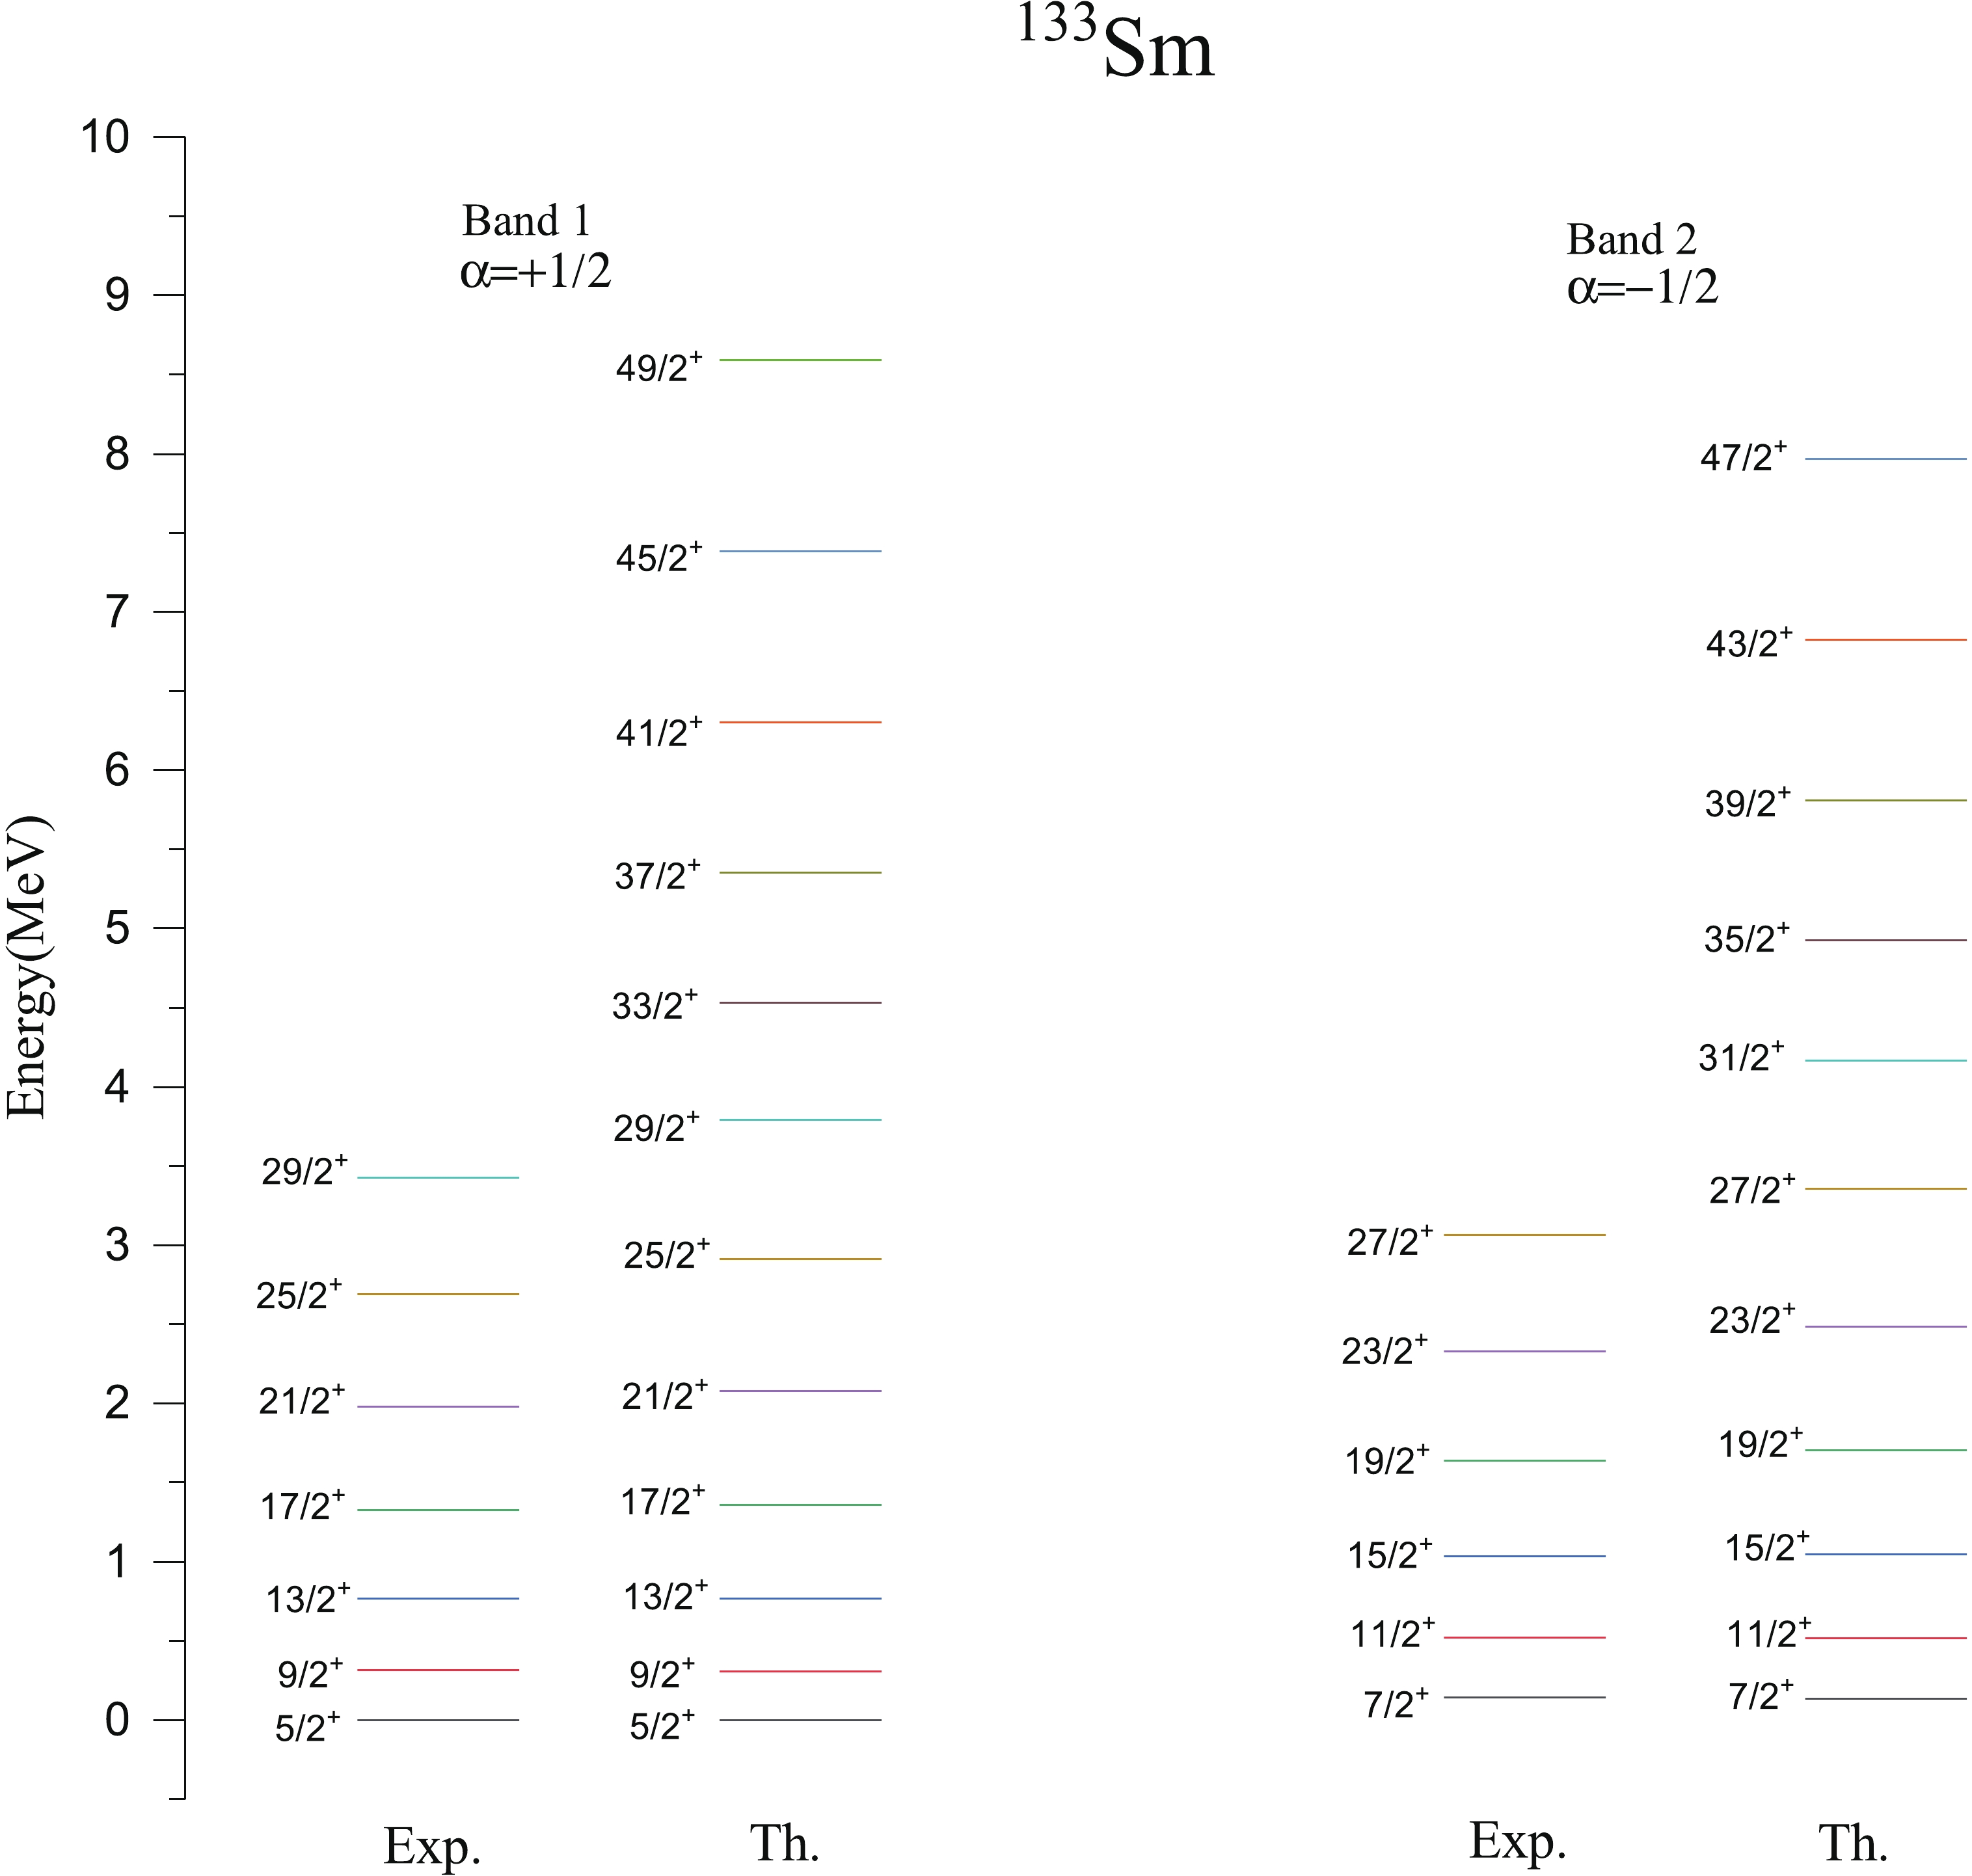
Figure 3.(color online) Comparison of theoretical (Th.) energy levels with the available experimental (Exp.) data [28] for positive parity bands of133Sm.
-
Rotational spectra in deformed nuclei can be better discussed in terms of moment of inertia. It is well known that the moment of inertia is sensitive to nuclear properties, like the pairing strength and the specific orbitals active at the Fermi surface. As moment of inertia depends upon the angular momentum, therefore its variation can impart some valuable information about the change in nuclear structure. Back-bending in moment of inertia can be calculated by using the formulae given in Ref. [29] and is a well-known phenomenon in understanding the nuclear structure at high-spins, which is expected to occur in rotating nuclei.
Calculated results on kinetic moment of inertia of bands 1-7 of133Sm are displayed inFig. 4.
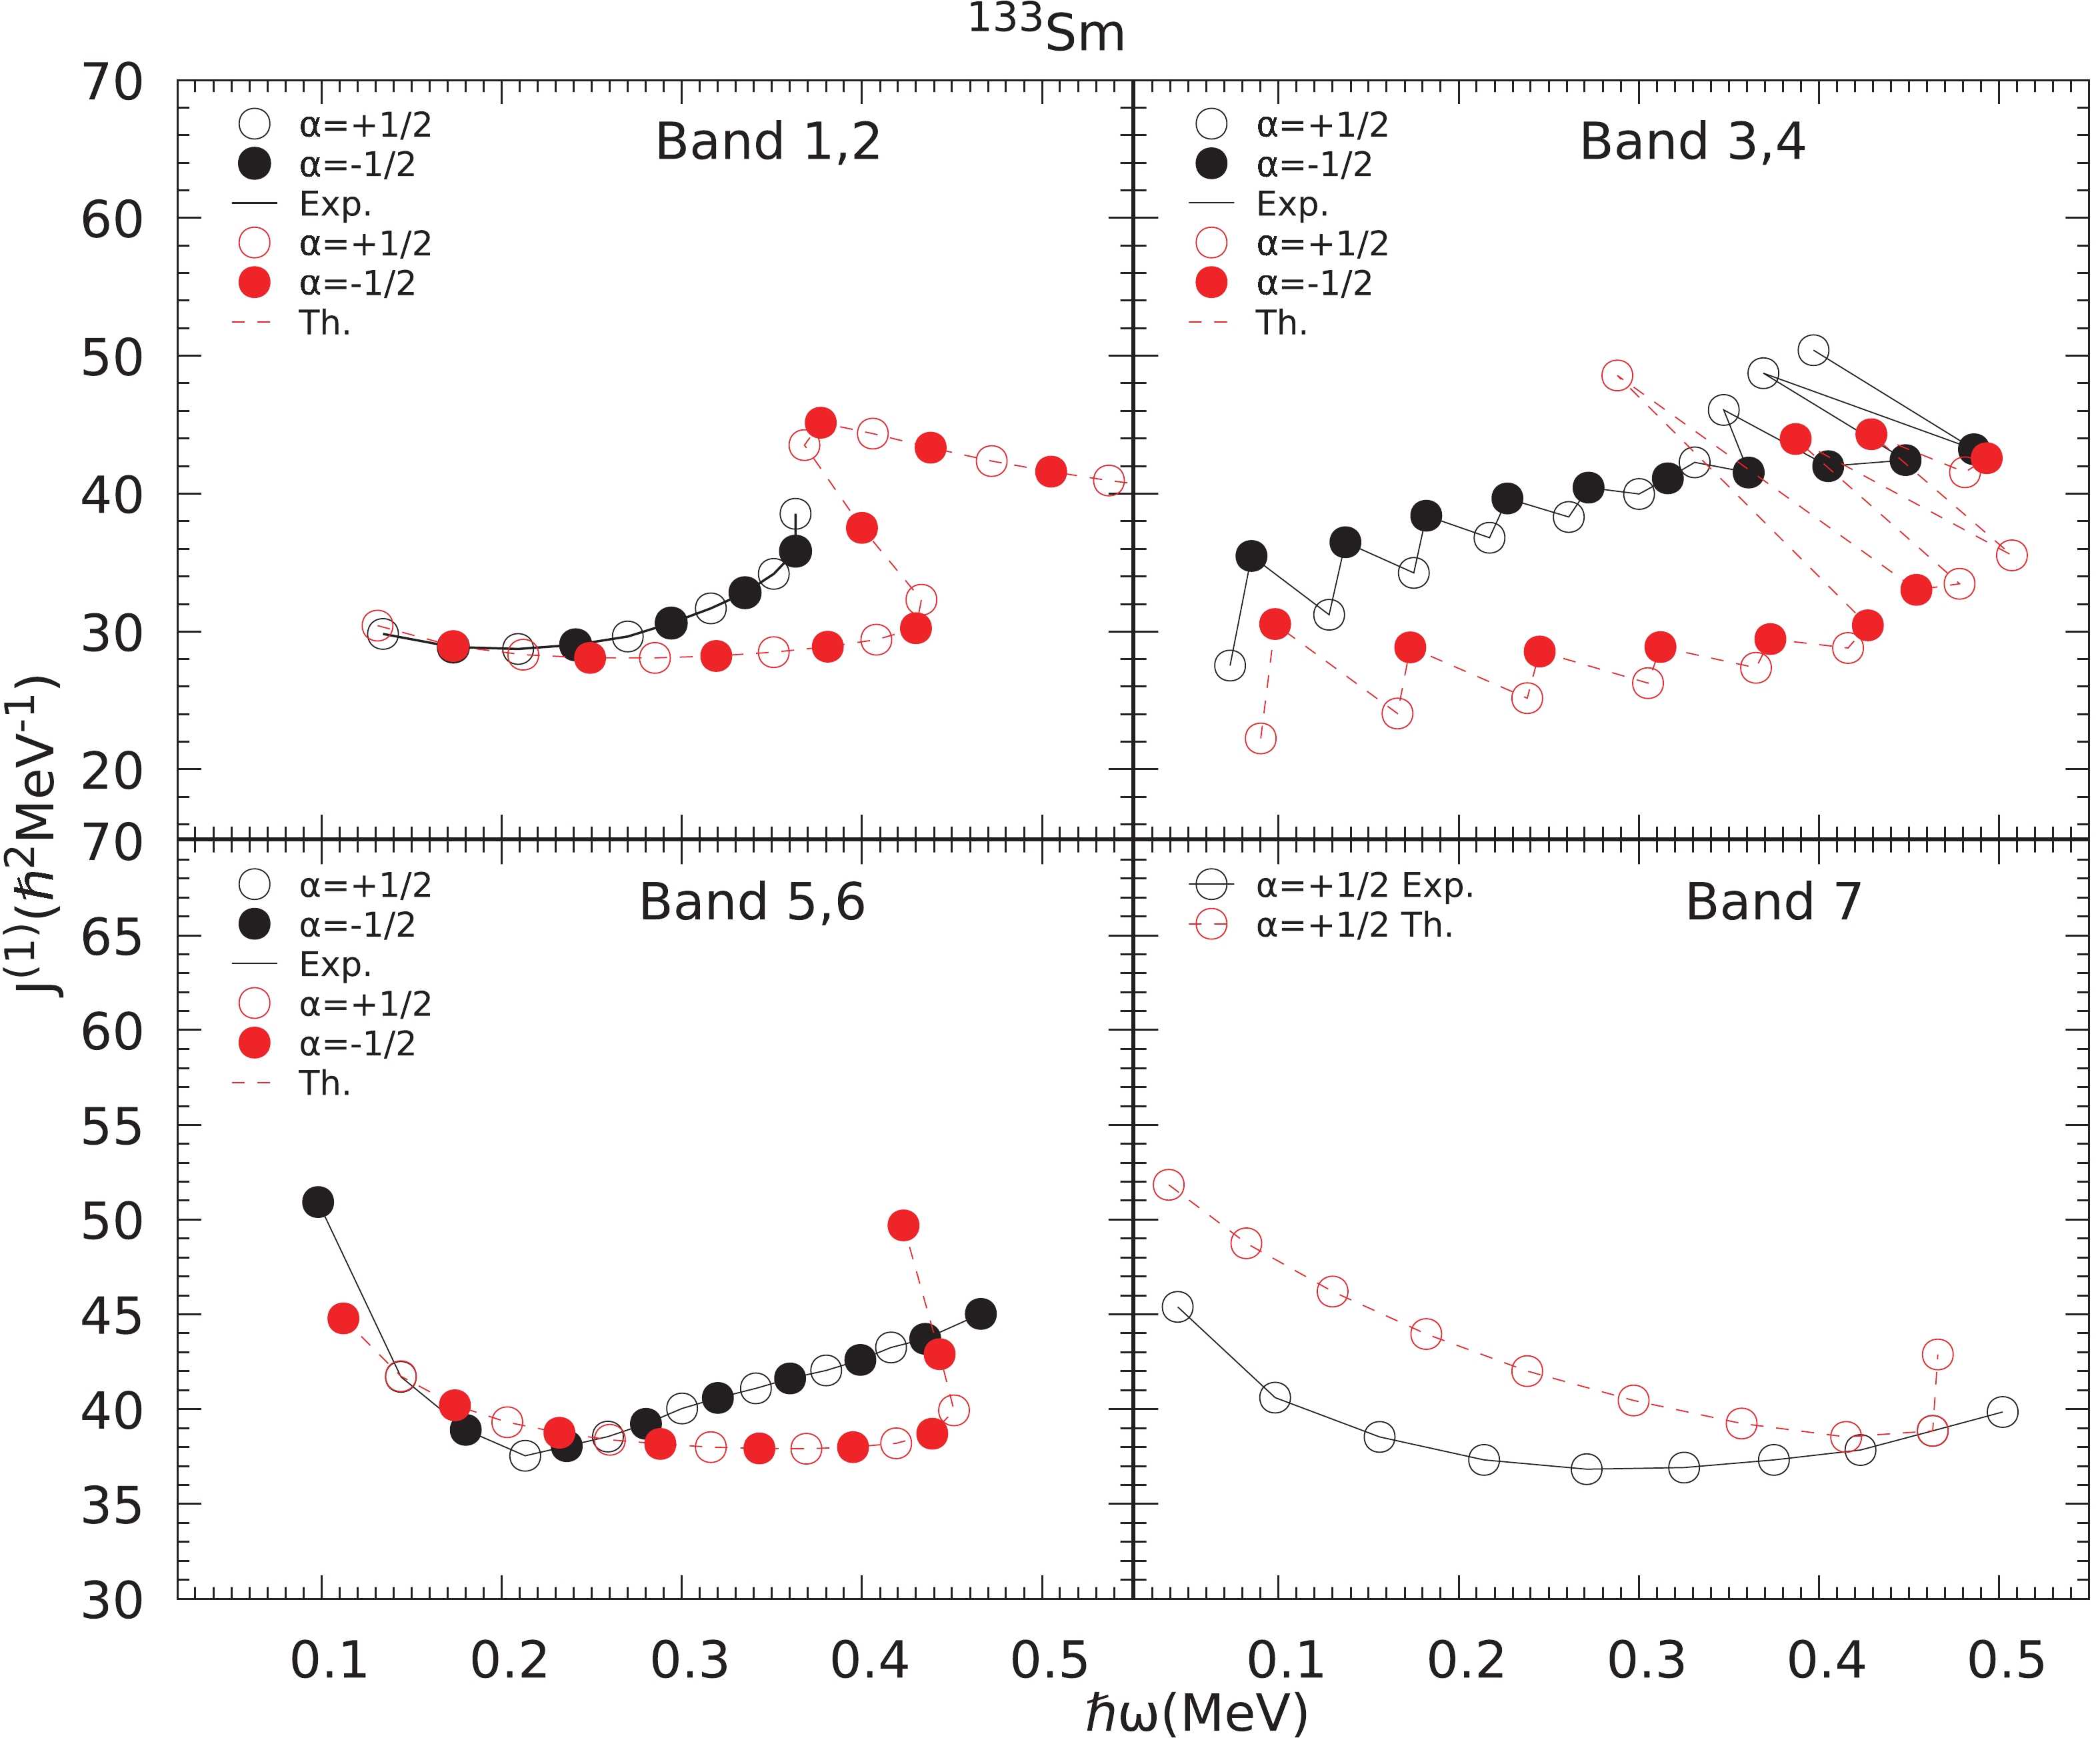
Figure 4.(color online) Comparison of calculated and experimental kinetic moment of inertiaJ(1), for bands 1-7 as a function of rotational frequency (ω) in133Sm.
The calculated results on back-bending phenomenon in bands 1 and 2, based on the calculation of the kinematic moment of inertiaJ(1)and the rotational frequency (ω) are compared with the available experimental data inFig. 4. The calculatedJ
(1)values show back bending aroundI=29/2, 31/2 at rotational frequencies 0.430 and 0.400 MeV for bands 1 and 2, respectively. It is understood that in the spin range where the onset of back-bending takes place, it should be marked by the crossing of ground state band by the other bands and from the band diagram (Fig. 2), it can be seen that around spin 31/2+, (h11/2)2proton crossing takes place. Experimentally, it is also observed [4] that there is tentative evidence for the (h11/2)2proton crossing at a frequency ( $\hbar \omega $ )~0.35 MeV in bands 1 and 2, which is close to the calculated backbending inJ(1)values around$\hbar \omega $ ~0.400-0.430 MeV, thereby predicting alignment of a pair of protons in (h11/2)2orbital. Thus, back-bending in moment of inertia, observed in the rotational spectra of deformed nuclei, carries important information on the interplay between the ground band and bands with alignment of a pair of quasiparticles. -
From theFig. 2, it is seen that 1-qp neutron band built onK=1/2 and having configuration 1ν1/2+[400] (2d3/2) is the first excited positive parity band. Experimentally, first excited positive parity band is observed to be built upon Nilsson orbital [411]1/2+(d3/2) [4,28]. The present calculations have well reproduced the band head spin and configuration of this band. The present calculations show proximity of this excited band built onK=1/2 with the ground state band built onK=5/2 and both these bands are taken over by 3-qp bands having one neutron coupled to twoh11/2protons at spin 33/2+as can be seen in theFig. 2. After band crossing, the first excited positive parity states are predicted to arise from the superposition of two 1-qp neutron bands having configurations 1ν5/2+[413](2d5/2) and 1ν1/2+[400](2d3/2). The band head energy of excited positive parity bands is not confirmed experimentally. However, the present calculations predict the band head energy of band 3 as 0.226 MeV with respect to positive parity yrast band 1. As the band head energies of these bands are not confirmed experimentally, the band spectra of these bands are not plotted for comparison. For comparison with experimental data [4,28], the transition energiesE(I)-E(I-2) andE(I)-E(I-1) of bands 3 and 4 are plotted inFig. 5. From this figure, it can be seen thatE2 transition energies are reasonably reproduced at the lower spins for both bands 3 and 4. However, there is decrease in calculatedE2 transitions around the spins 29/2+and 35/2+, while as experimental values show no decrease inE2 transitions. The decrease in calculatedE2 transitions at higher spins may be due to the crossing of 1-qp excited positive parity band by 3-qp bands. It is worthwhile to mention here that staggering in dipole transition energiesM1 connecting bands 3 and 4 is well reproduced by the present calculations as shown inFig. 5.
-
The comparison of calculated kinetic moment of inertiaJ(1)versusωwith the experimental ones for positive parity bands 3 and 4 is presented inFig. 4. The calculated and experimentalJ(1)values show the phenomenon of staggering in these bands due to the low value,K=1/2 of the band. The experimental band 3 (α=+1/2), shows an alignment around spinI=33/2 at
$\hbar \omega $ ~0.347 MeV (also mentioned in Ref. [4]), whereas band 4 shows no alignment). The calculated results onJ(1)andωshow the phenomenon of back bending in band 3, around spinI=29/2 at$\hbar \omega $ ~0.288 MeV. Thus, the present calculations predict the band crossing and change in structure of bands 3 and 4 above spinsI=29/2+and 35/2+, respectively. -
Bands 5 and 6 have been assigned as being 1-qp structure built upon the neutron [523]7/2−(h11/2) Nilsson orbital [4,28]. The experimental Routhians [4] show that both bands 5 and 6 have very little signature splitting up to the highest frequencies observed as would be expected from the highKassignments. The relative band head energies of negative parity bands 5,6 and 7 with respect to the ground state positive parity band are not confirmed experimentally. The present calculations predict the band head energy of band 5 as 0.179 MeV with respect to positive parity band 1. InFig. 6, we plot the relevant low lying 1-qp and 3-qp negative parity bands in133Sm, along with their configurations. From theFig. 6, it is seen that 1-qp neutron band built onK=7/2 and having configuration 1ν7/2−[523] (1h11/2) is lowest in energy out of all other negative parity bands, up to the spinI=39/2−. The calculated results are very much consistent with the experimentally observed band head spin and configuration assigned to this band by the authors of Refs. [4,28]. Around spin 41/2−, this pure 1-qp neutron band is crossed by one 3-qp band consisting of one neutronh11/2coupled to two protonh11/2orbitals with 1ν7/2−[523]+{1π3/2−[541]+1π5/2−[532]},K=5/2 as dominant configuration.Fig. 7representsE(I)-E(I-2) transitions of bands 5 and 6 and dipole transitionsE(I)-E(I-1), connecting these two bands. The calculated results show good agreement between theoretical and experimental transition energy values. There is decrease in calculatedE2 andM1 transition energies around the spin 39/2−which is due to the crossing of lowest negative parity band by the two 3-qp bands (as shown shown inFig. 6).
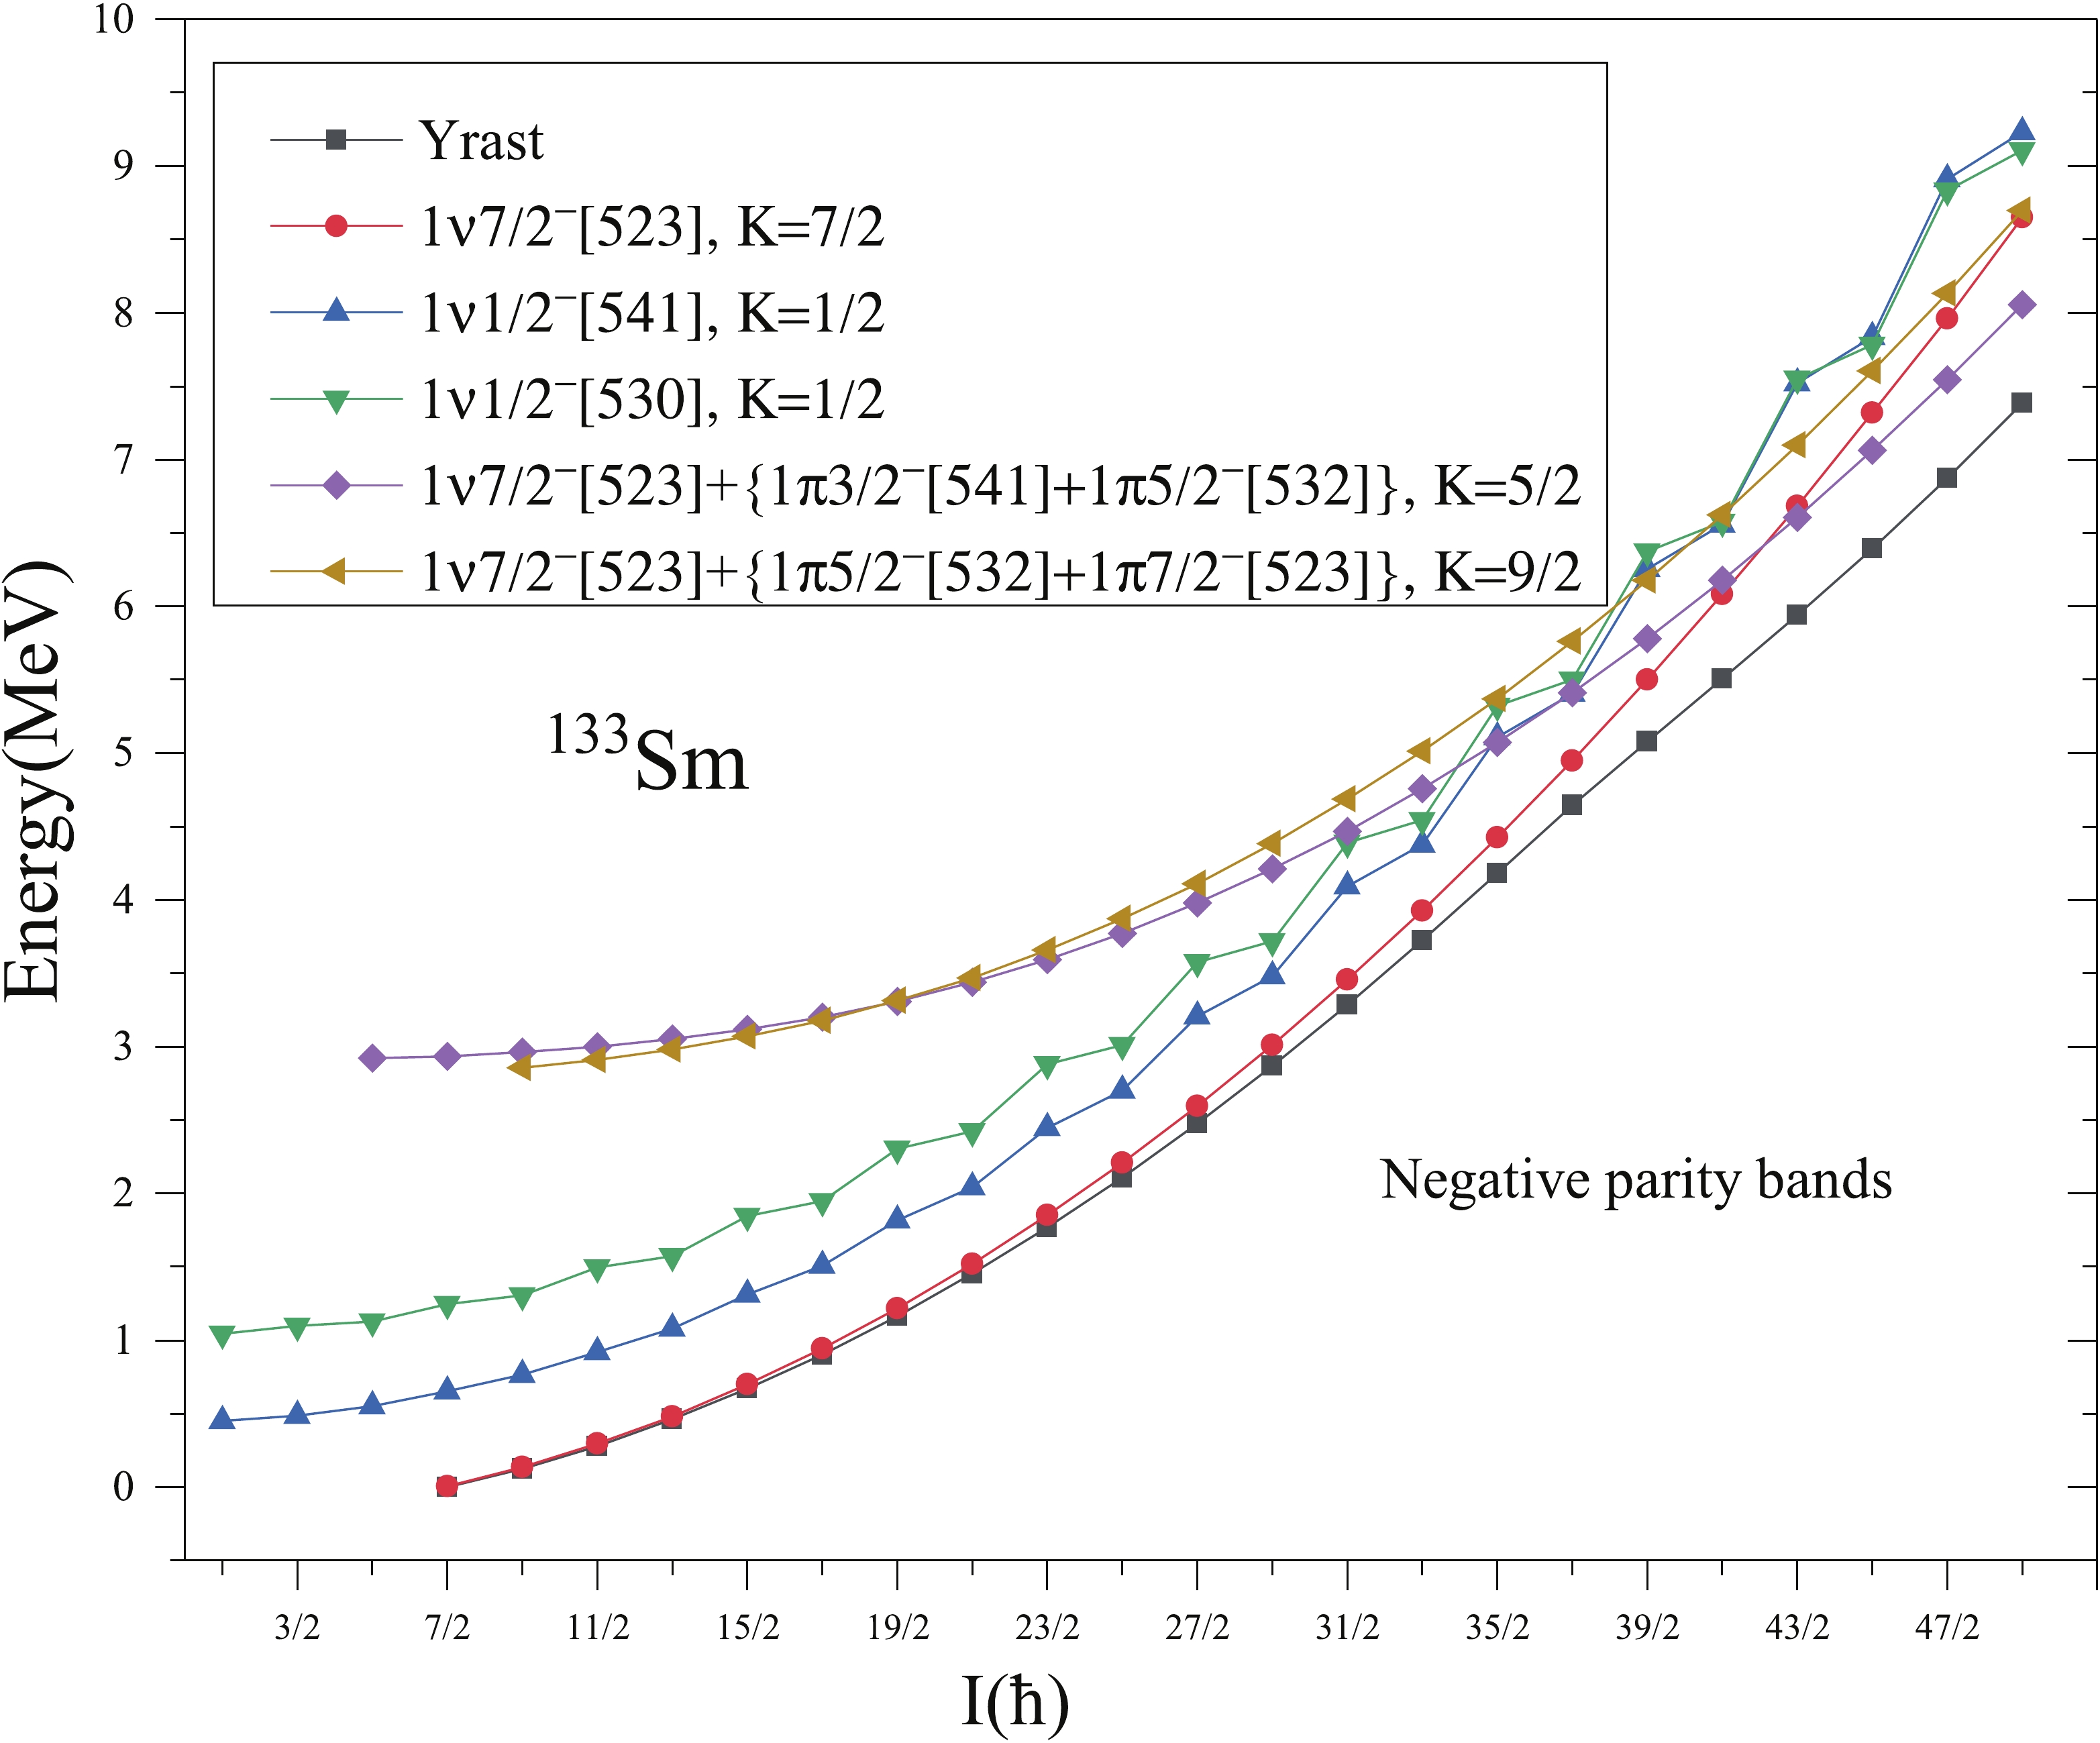
Figure 6.(color online) Band diagram for negative parity bands for133Sm. Only low-lying and significant bands are taken.
-
The comparison of calculated kinetic moment of inertiaJ(1)versusωwith the experimental ones for negative parity bands 5 and 6 is presented inFig. 4. The agreement between calculated and experimental curves at lower spins is good. The experimental curve ofJ(1)versus ω show an increase around spinI=25/2−at
$\hbar \omega $ ≈0.3 MeV. The calculated results show an increase inJ(1)around spinI=39/2−, due to the crossing of 1-qp bands by 3-qp bands. -
Experimentally, this band 7 has been observed and assigned [541]1/2-(h9/2) configuration by authors of Refs. [3,4,28]. The calculations of Ref. [4] suggest that this structure should have a quadrupole deformationβ2~0.33 which is nearly equal to the value ofε2=0.33 used in the present study of bands 1-7. From theFig. 6, the band built onK
=1/2−and having configuration 1ν1/2−[541] (2f7/2) is an excited negative parity band. This band is very much consistent with the band head spin of the experimentally observed decoupled band 7. The relative band head energy of this band with respect to yrast negative parity band 5 is 0.444 MeV, that is not confirmed experimentally. InFig. 8, the comparison of calculated and experimental [4,28]E(I)-E(I-2) transition energies is presented. From the figure, it can be seen thatE2 transitions are very well reproduced up toI=37/2−. The decrease in calculatedE2 transitions atI=41/2 may be due to crossing by 3-qp bands. -
The comparison of calculated kinetic moment of inertiaJ(1)versusωwith the experimental ones for negative parity band 7 is presented inFig. 4. The calculated values reproduce the decreasing trend of experimental data up toI=37/2. The experimental curve ofJ(1)versusωshow an increase around spinI=29/2−at
$\hbar \omega $ ~0.375 MeV. The calculated results show an increase inJ(1)around spinI=37/2−at rotational frequency 0.45 MeV, due to the crossing of 1-qp bands by 3-qp bands. -
The review of experimental literature [5,26] reveals that the energies of band spectra of yrast positive and negative parity bands of135Sm are not confirmed experimentally yet and are tentative. In the present work, the band spectra have been obtained for135Sm with deformation parametersε2=0.275 andε4=0.070. The value of quadrupole deformation parameterε2taken in the present calculation is consistent with the values of deformation parameters predicted for135Sm by the authors of Refs. [24,25]. However, the value ofε4has been increased from 0.033(0.020) to 0.070 to reproduce the experimental staggering in energies of yrast negative parity band 2.Fig. 9, shows the calculated energy levels for the positive parity 7/2+band represented by band 1 and negative parity 9/2−band represented by band 2, together with the experimental data [26]. As one can see, the data is reproduced rather well by the calculations up to the spinI= 19/2+. In conformation with the suggestion of authors of Ref. [5], the 1-qp pure neutron configuration withK=7/2 fromg7/2orbital is found to be lowest in energy defining the yrast sequence up toI=23/2+. The difference between calculated and experimental value at the highest known spinI=39/2+(α=−1/2) of this band 1 is 0.532 MeV. This difference at the highest known spinI=29/2+(α=+1/2) of this band 1 is 0.731 MeV.
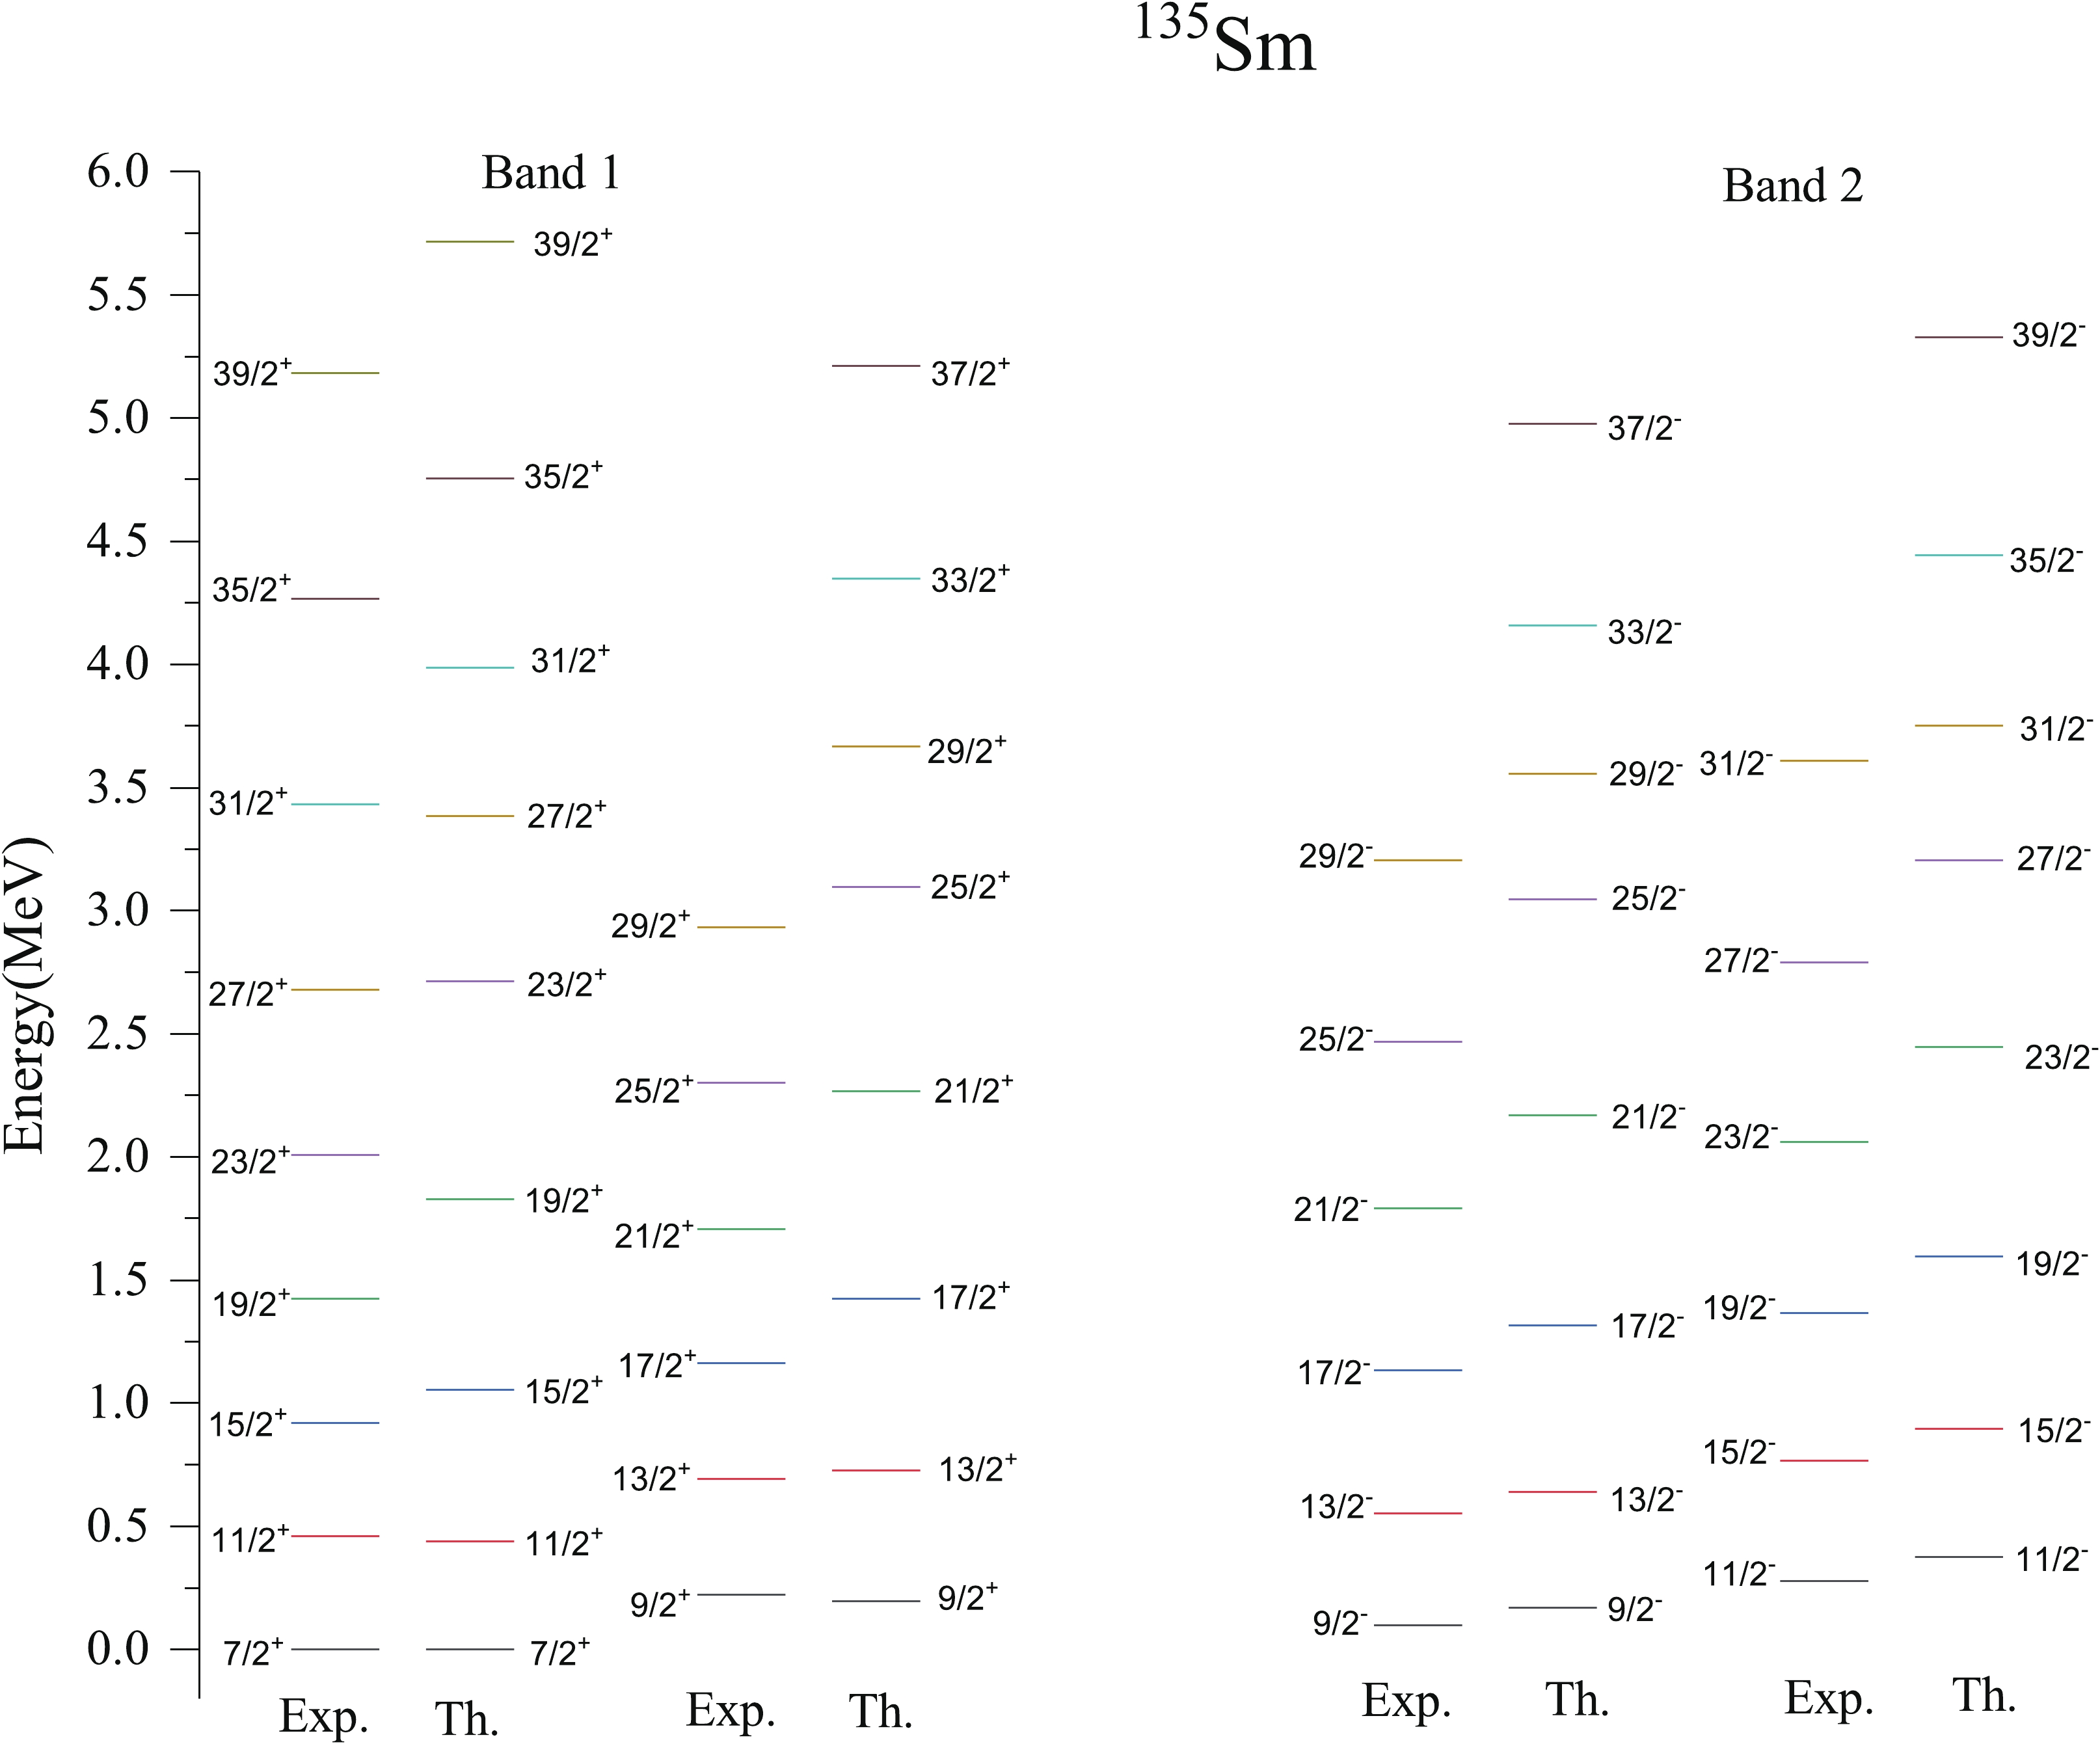
Figure 9.(color online) Comparison of theoretical (Th.) energy levels with the available experimental (Exp.) data [26] for positive parity band 1 and negative parity band 2 of135Sm.
Now coming to the discussion of negative parity band spectra of135Sm, the calculated band spectra of 1-qph11/2neutron orbital withK=9/2 represented as band 2 inFig. 9is a negative parity band of135Sm. The calculated energy levels corresponding to each angular momentum state of band 2 are in reasonable agreement with the tentative experimental data of Ref. [26]. The approximate band head energy of band 2 at band head spinI=9/2−is 0.10 MeV, whereas the present calculations predict it as 0.17 MeV. The difference between calculated and tentative experimental values at the band head spinI=9/2−is 0.07 MeV and this difference at the highest known spin 31/2−is 0.145 MeV. As mentioned in the preceding discussion, the level energies of these bands are tentative, therefore, one cannot comment on the level of agreement precisely. Further, the transition energies of bands 1 and 2 of135Sm are confirmed experimentally, therefore these energies are compared with experimental data inFigs. 10and11for positive and negative parity bands 1 and 2, respectively. From these figures, it is observed that,E(I)-E(I-2) transition energies show reasonably good agreement with the experimental data at low spins and show a decrease at spinsI=27/2 and 29/2 in positive and negative parity bands, respectively. However, theE(I)-E(I-1) transition energies show good agreement with the available experimental data of both bands 1 and 2.
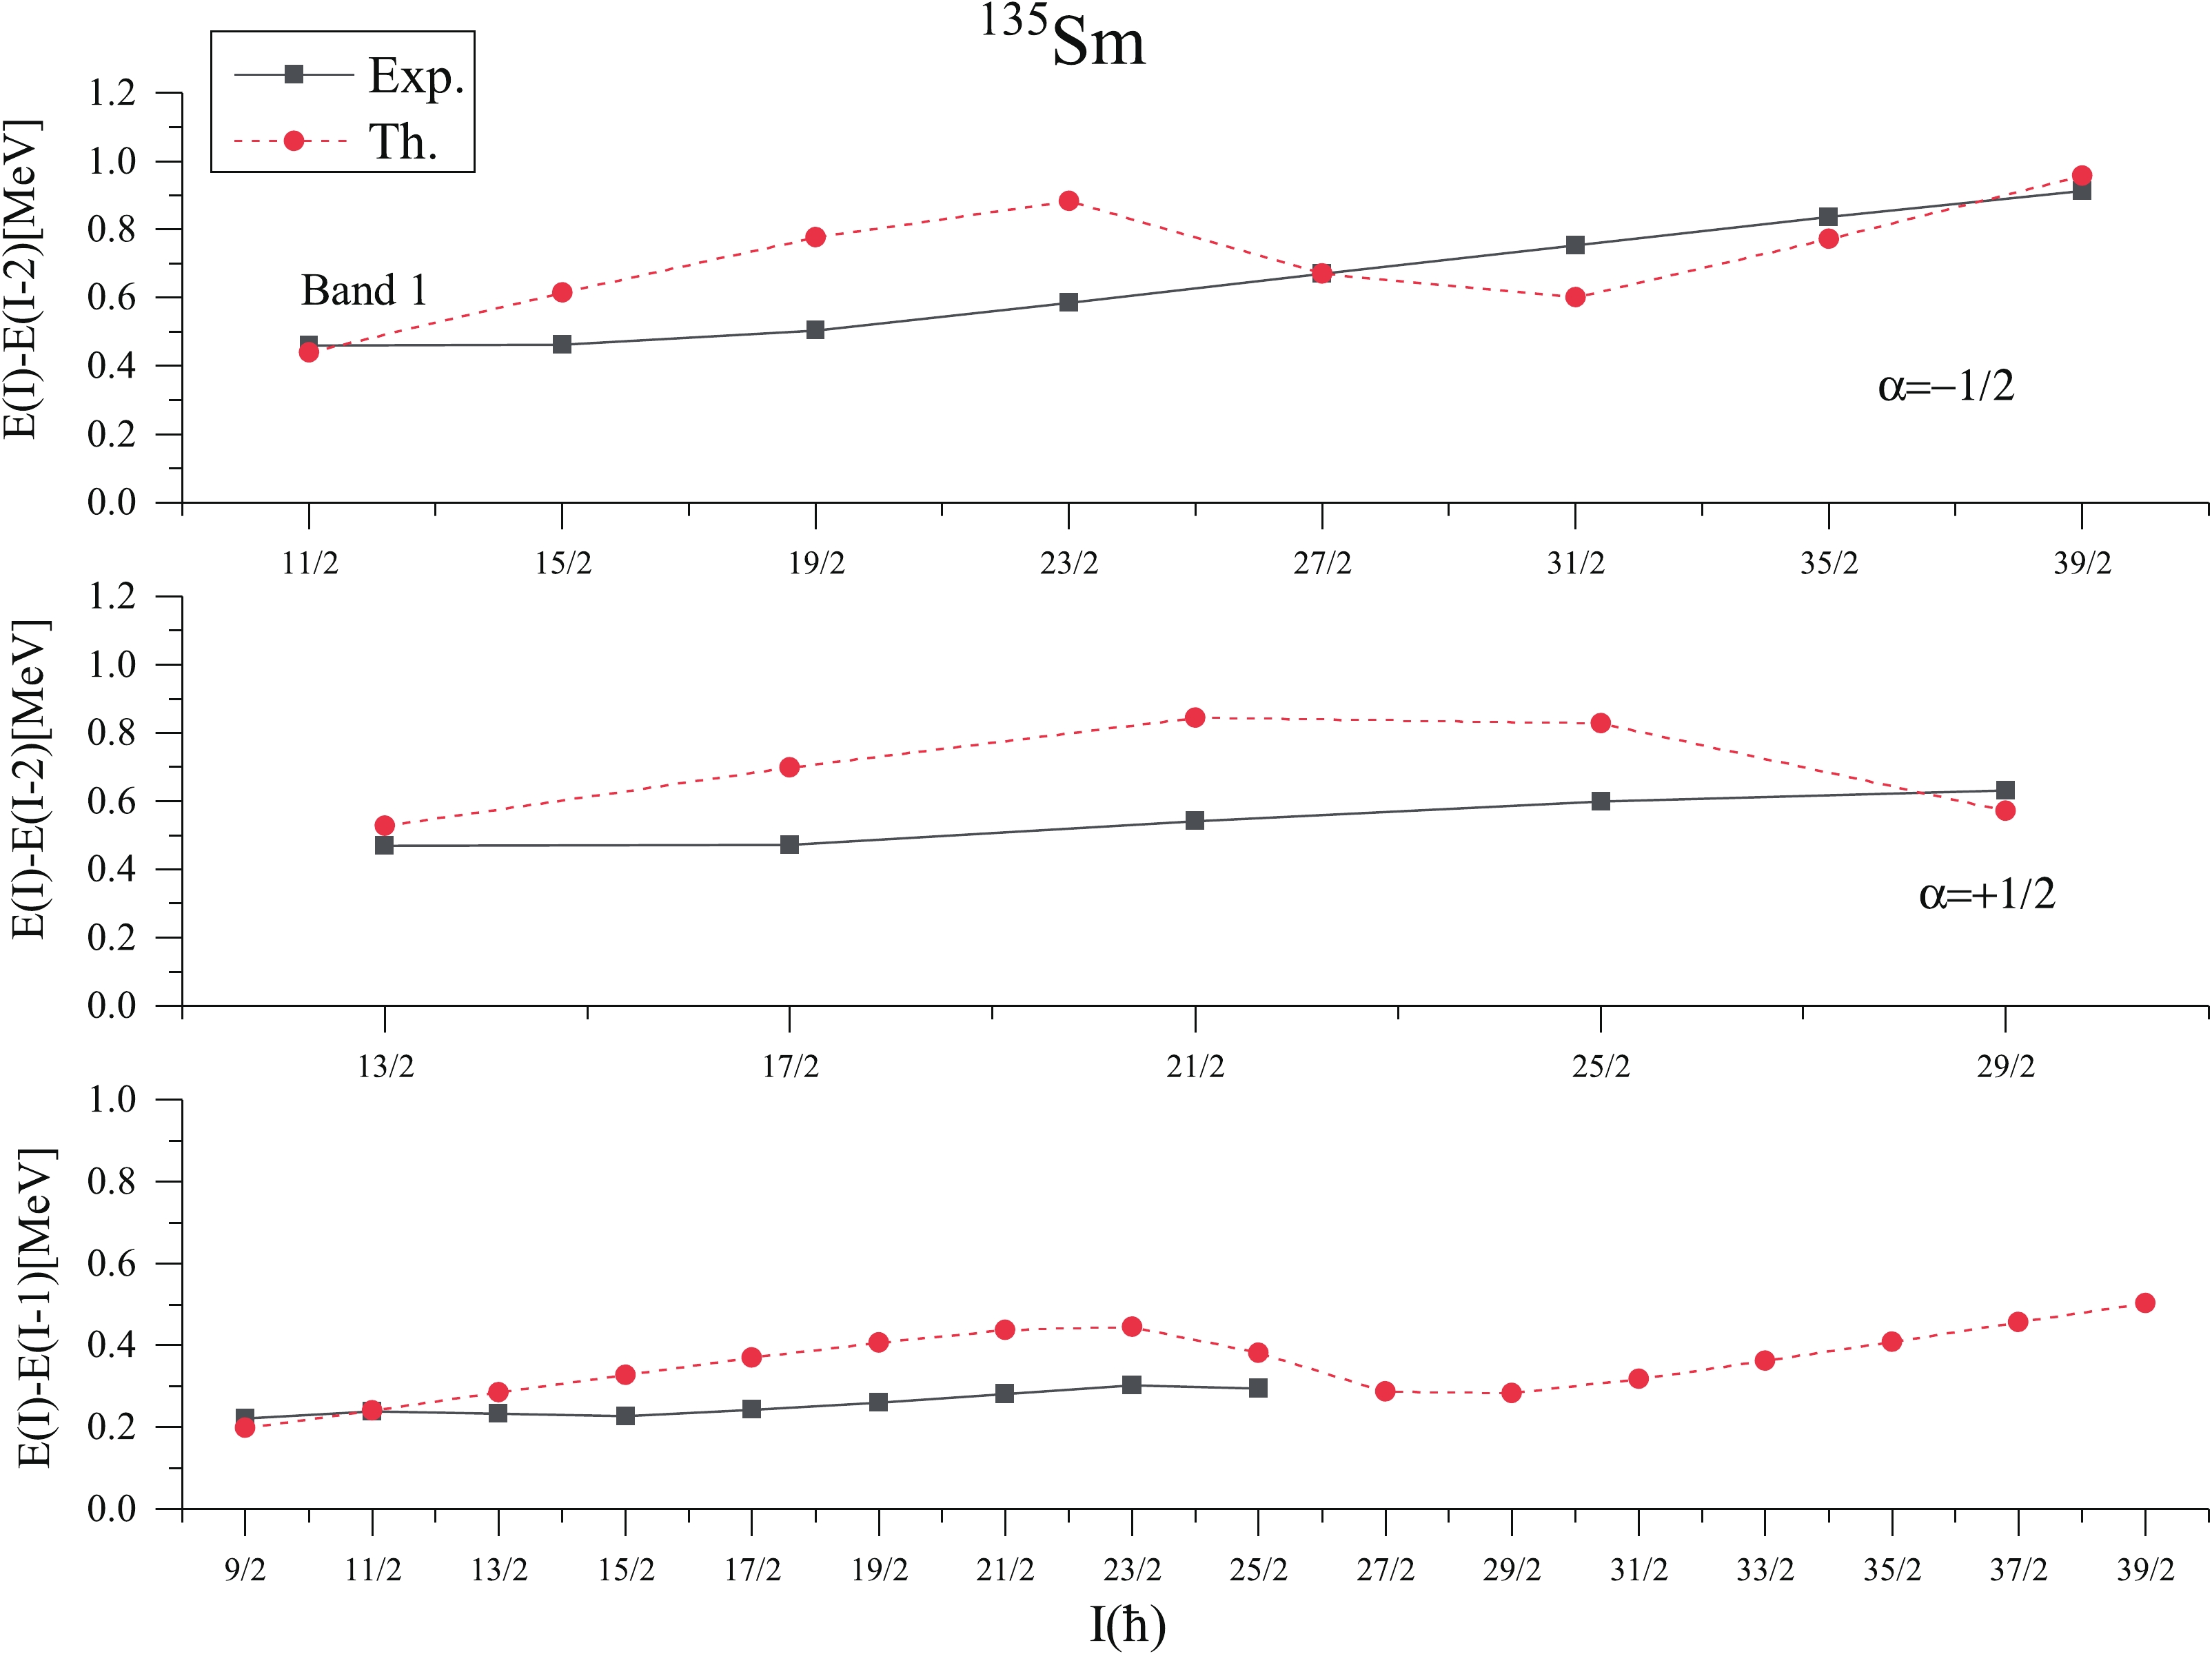
Figure 10.(color online) Comparison of theoretical (Th.) and experimental (Exp.) [26] transition energyE(I)-E(I-2) andE(I)-E(I-1) of band 1 versus spin angular momentum (I) of135Sm.
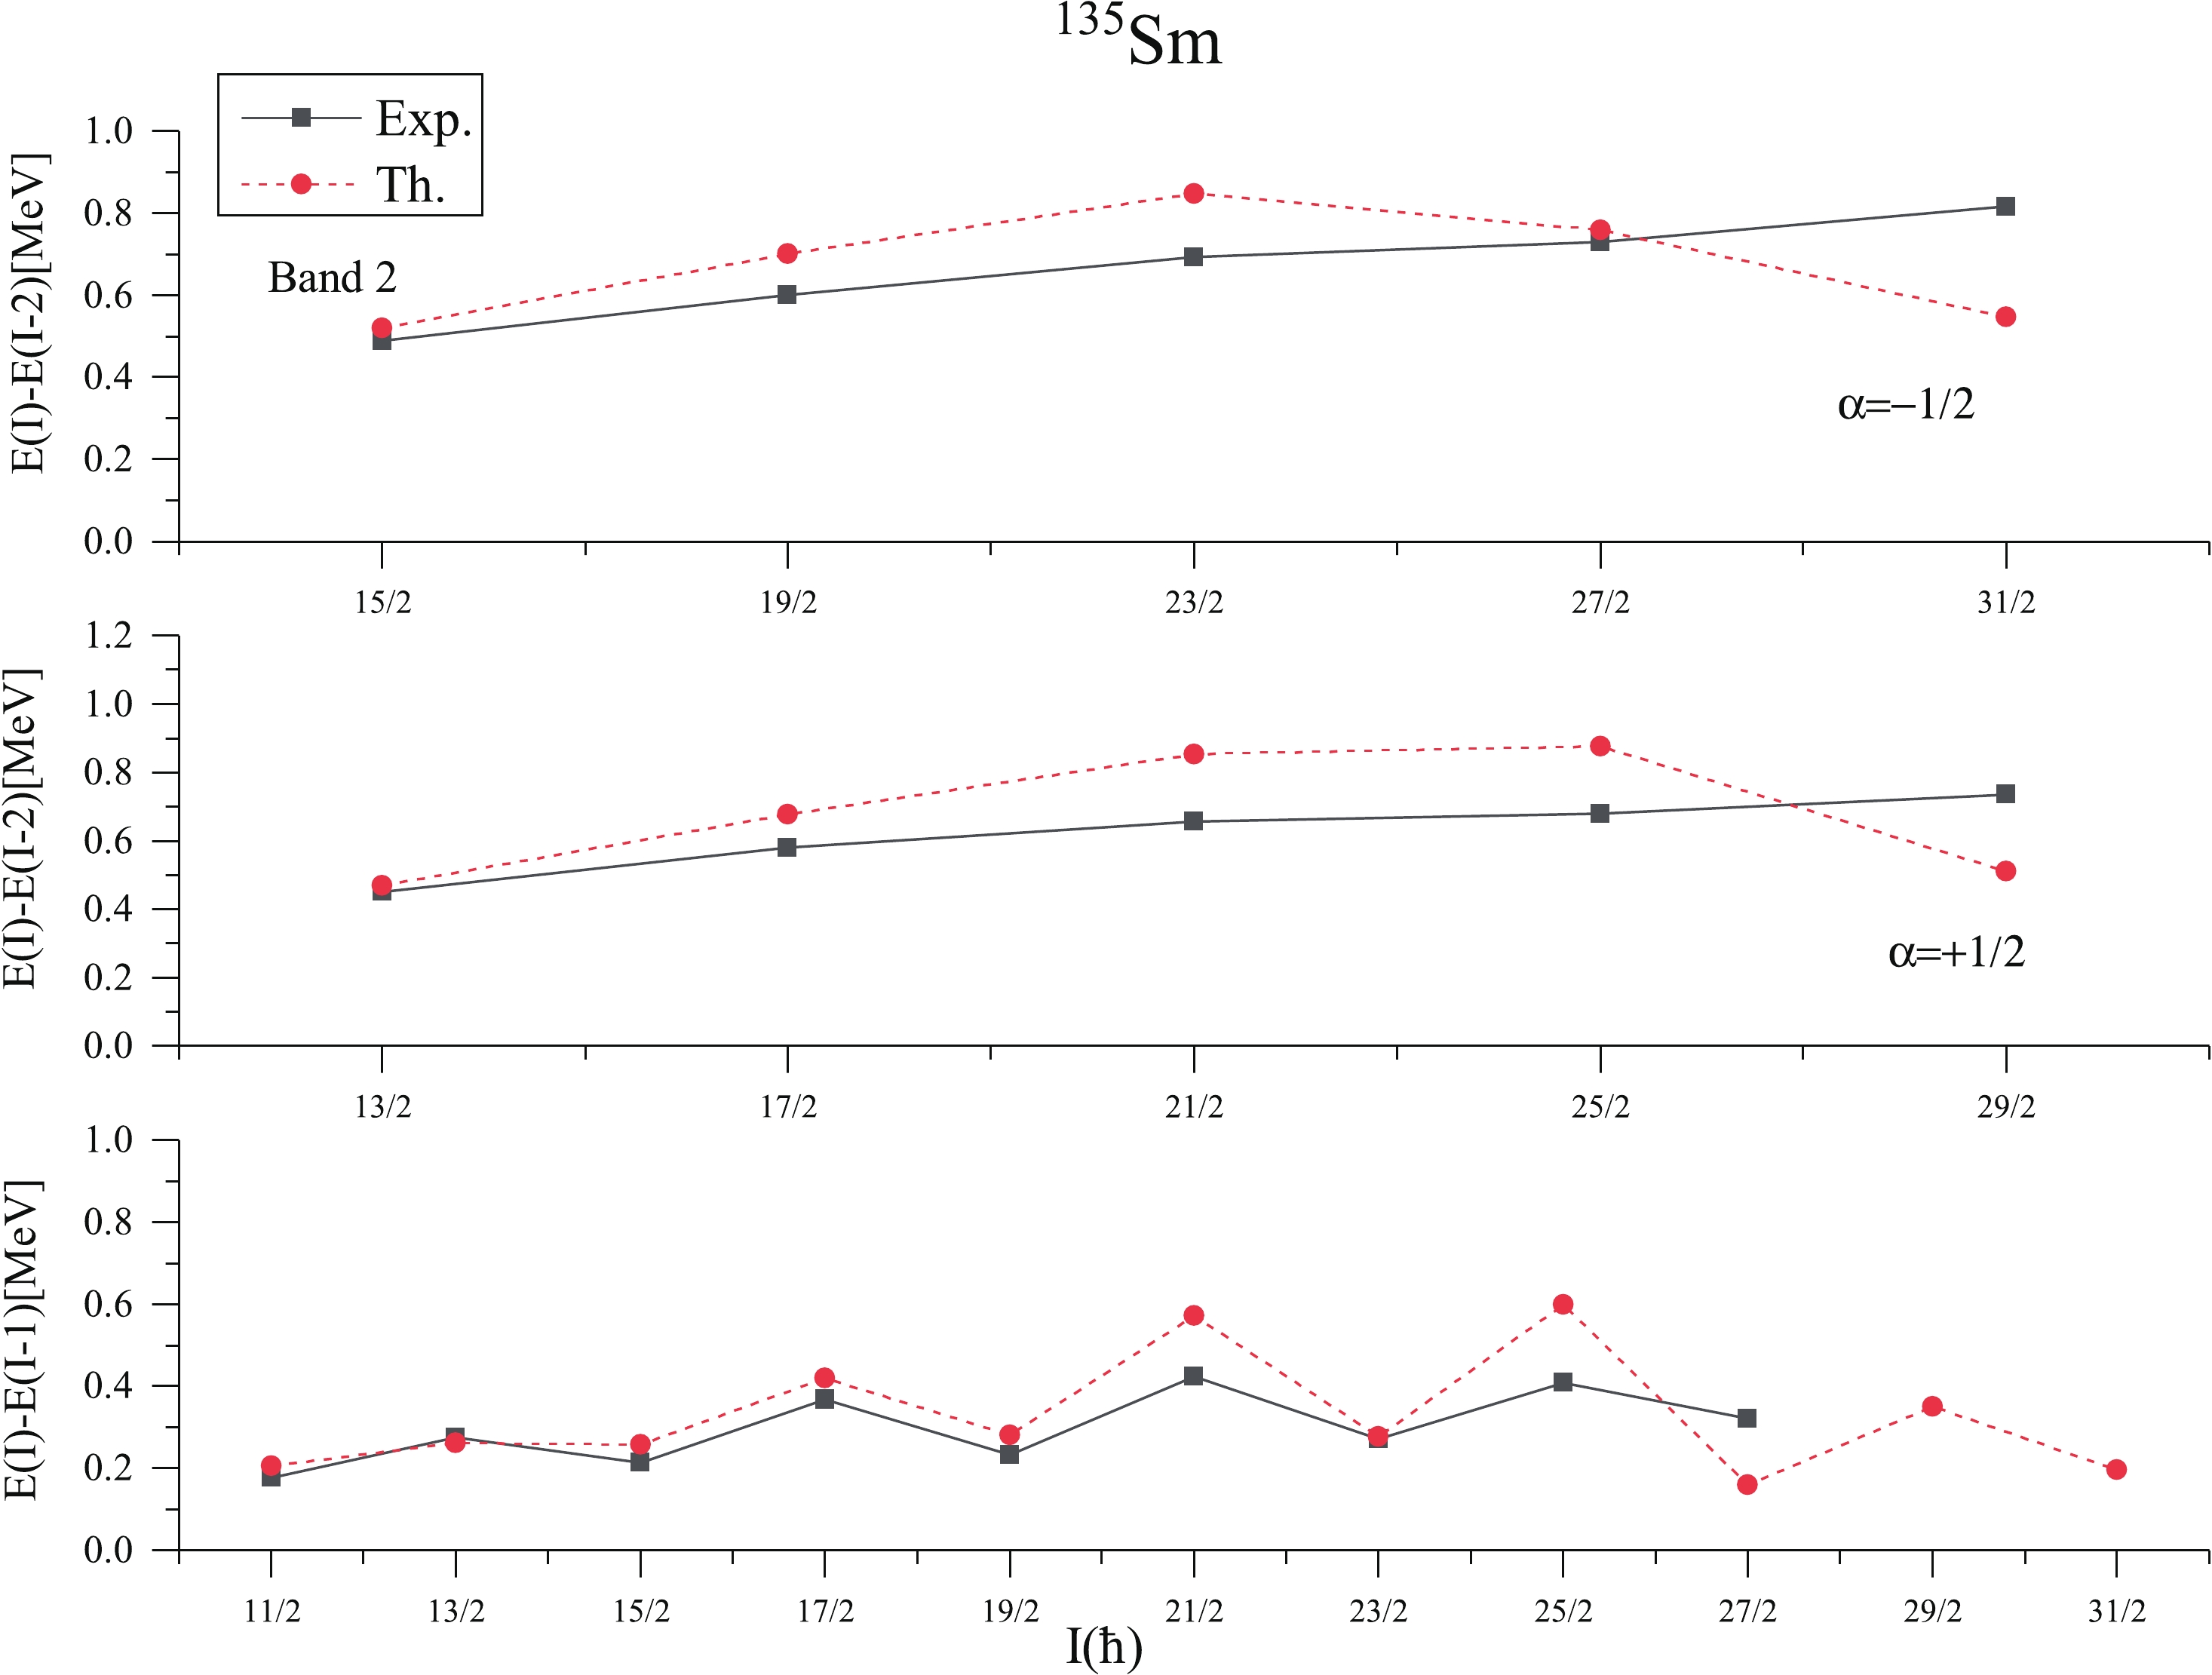
Figure 11.(color online) Comparison of theoretical (Th.) and experimental (Exp.) [26] transition energyE(I)-E(I-2) andE(I)-E(I-1) versus spin angular momentum (I) for band 2 (
${\rm{\alpha = }} \mp 1/2$ ). -
InFig. 12, we plot the relevant 1-qp and 3-qp positive parity bands in135Sm, along with their configurations. From theFig. 12, it is seen that 1-qp neutron band built onK=7/2 and having configuration 1ν7/2+[404](1g7/2) is lowest in energy up to the spinI=25/2+. This observation is consistent with the band head spin and configuration assigned to it by the authors of Ref. [5]. The yrast states of this band arise from 1ν7/2+[404](1g7/2) configuration up toI=23/2. However, at the spin 27/2+band crossing occurs and 3-qp bands consisting of one neutron coupled to a pair of protons and having configurations 1ν7/2+[404]+{1π1/2−[550]+1π5/2−[532]},K=13/2; 1ν7/2+[404]+{1π3/2−[541]+1π5/2−[532]},K=9/2 and 1ν5/2+[413]+{1π3/2−[541]+1π5/2−[532]},K=7/2, crosses the 1-qp,K=7/2 band. This band crossing causes a significant change in the yrast structure of135Sm.
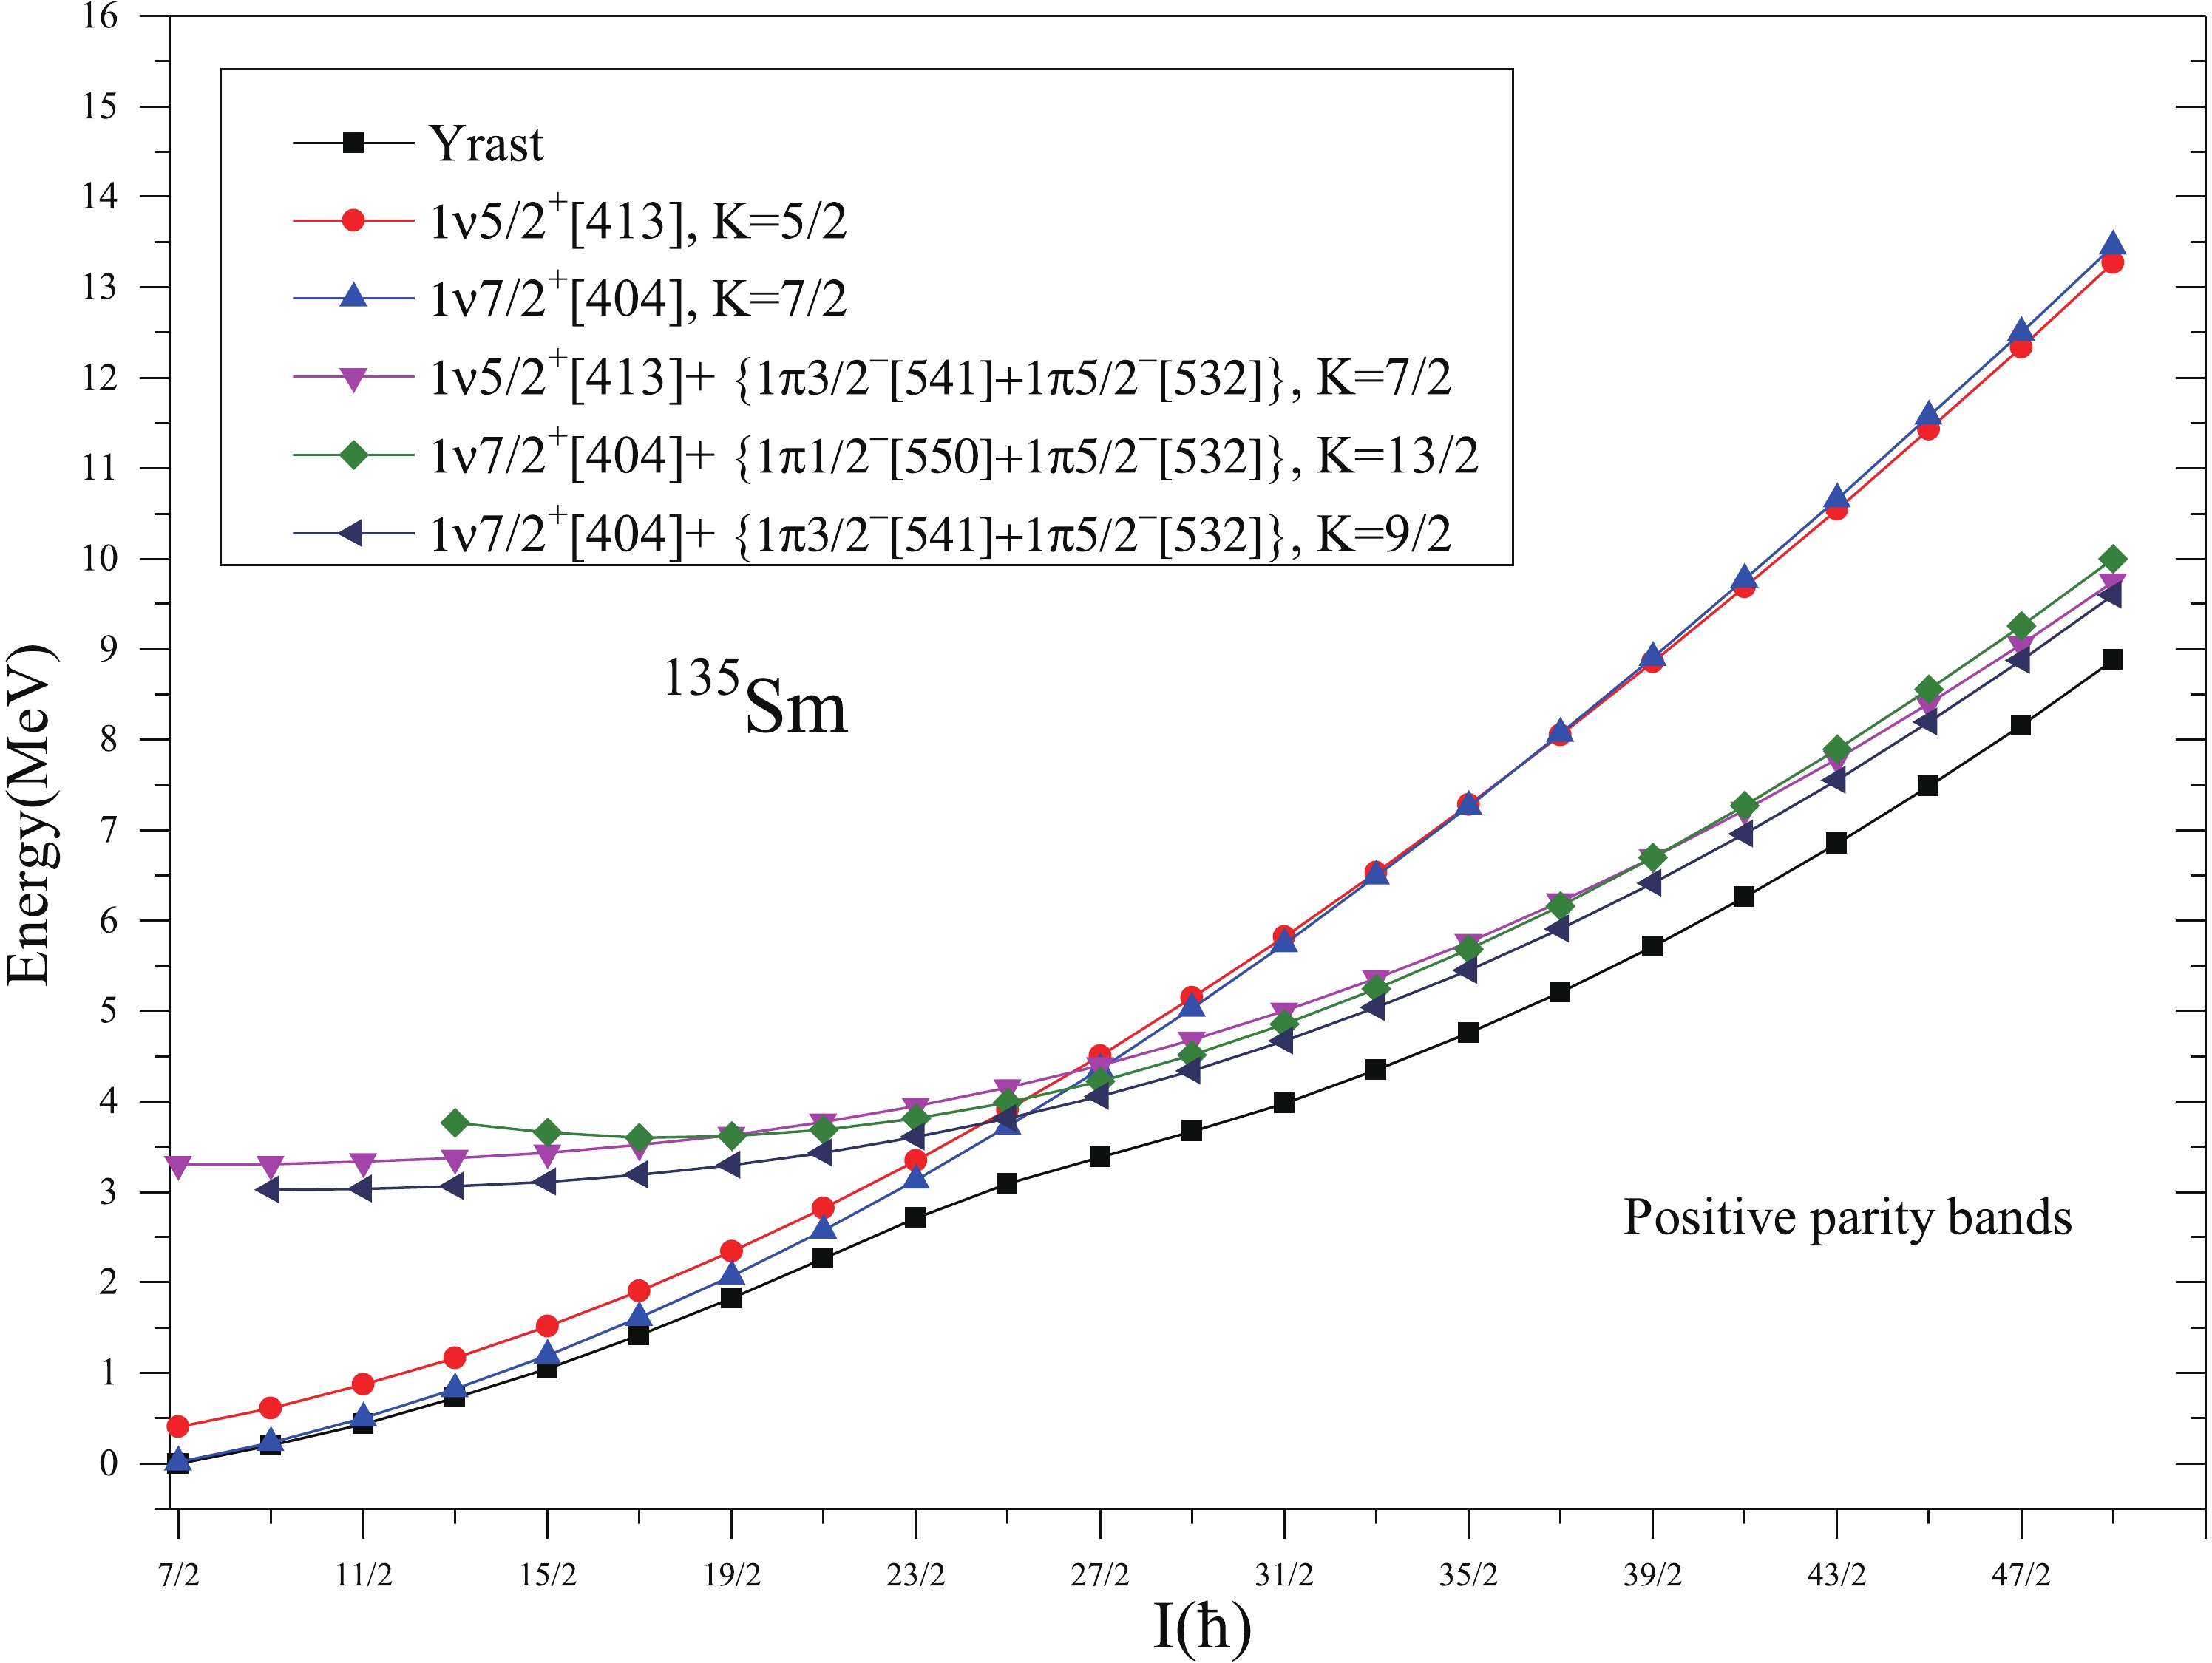
Figure 12.(color online) Band diagram for positive parity bands for135Sm. Only low-lying and significant bands are taken.
The band diagram for negative parity states is shown inFig. 13, in which only important 1-qp and 3-qp bands along with their configurations are shown. The dominant structure of the lowest negative parity band isK=9/2 state of the neutron 1h11/2orbital up to the spin 13/2−. This is consistent with the band head spin and configuration assigned to this band by the authors of Ref. [26]. From the spin 15/2−to 23/2−, the lowest energy states are formed due to the contribution of different 1-qp bands having configurations 1ν7/2−[523](1h11/2), 1ν9/2−[514](1h11/2) and 1ν1/2−[541](2f7/2). It may be because of this configuration mixing at low spins, the calculated results show staggering in energies, which increases in magnitude with increase in spin up to the spinI=25/2−. This staggering in calculated ΔI=1 transition energies are well supported by the experimentally observed staggering in ΔI=1 transition energies (shown inFig. 11). The staggering pattern is more clear from the plots of kinetic moment of inertiaJ(1)versusω, presented inFig. 14for band 2.
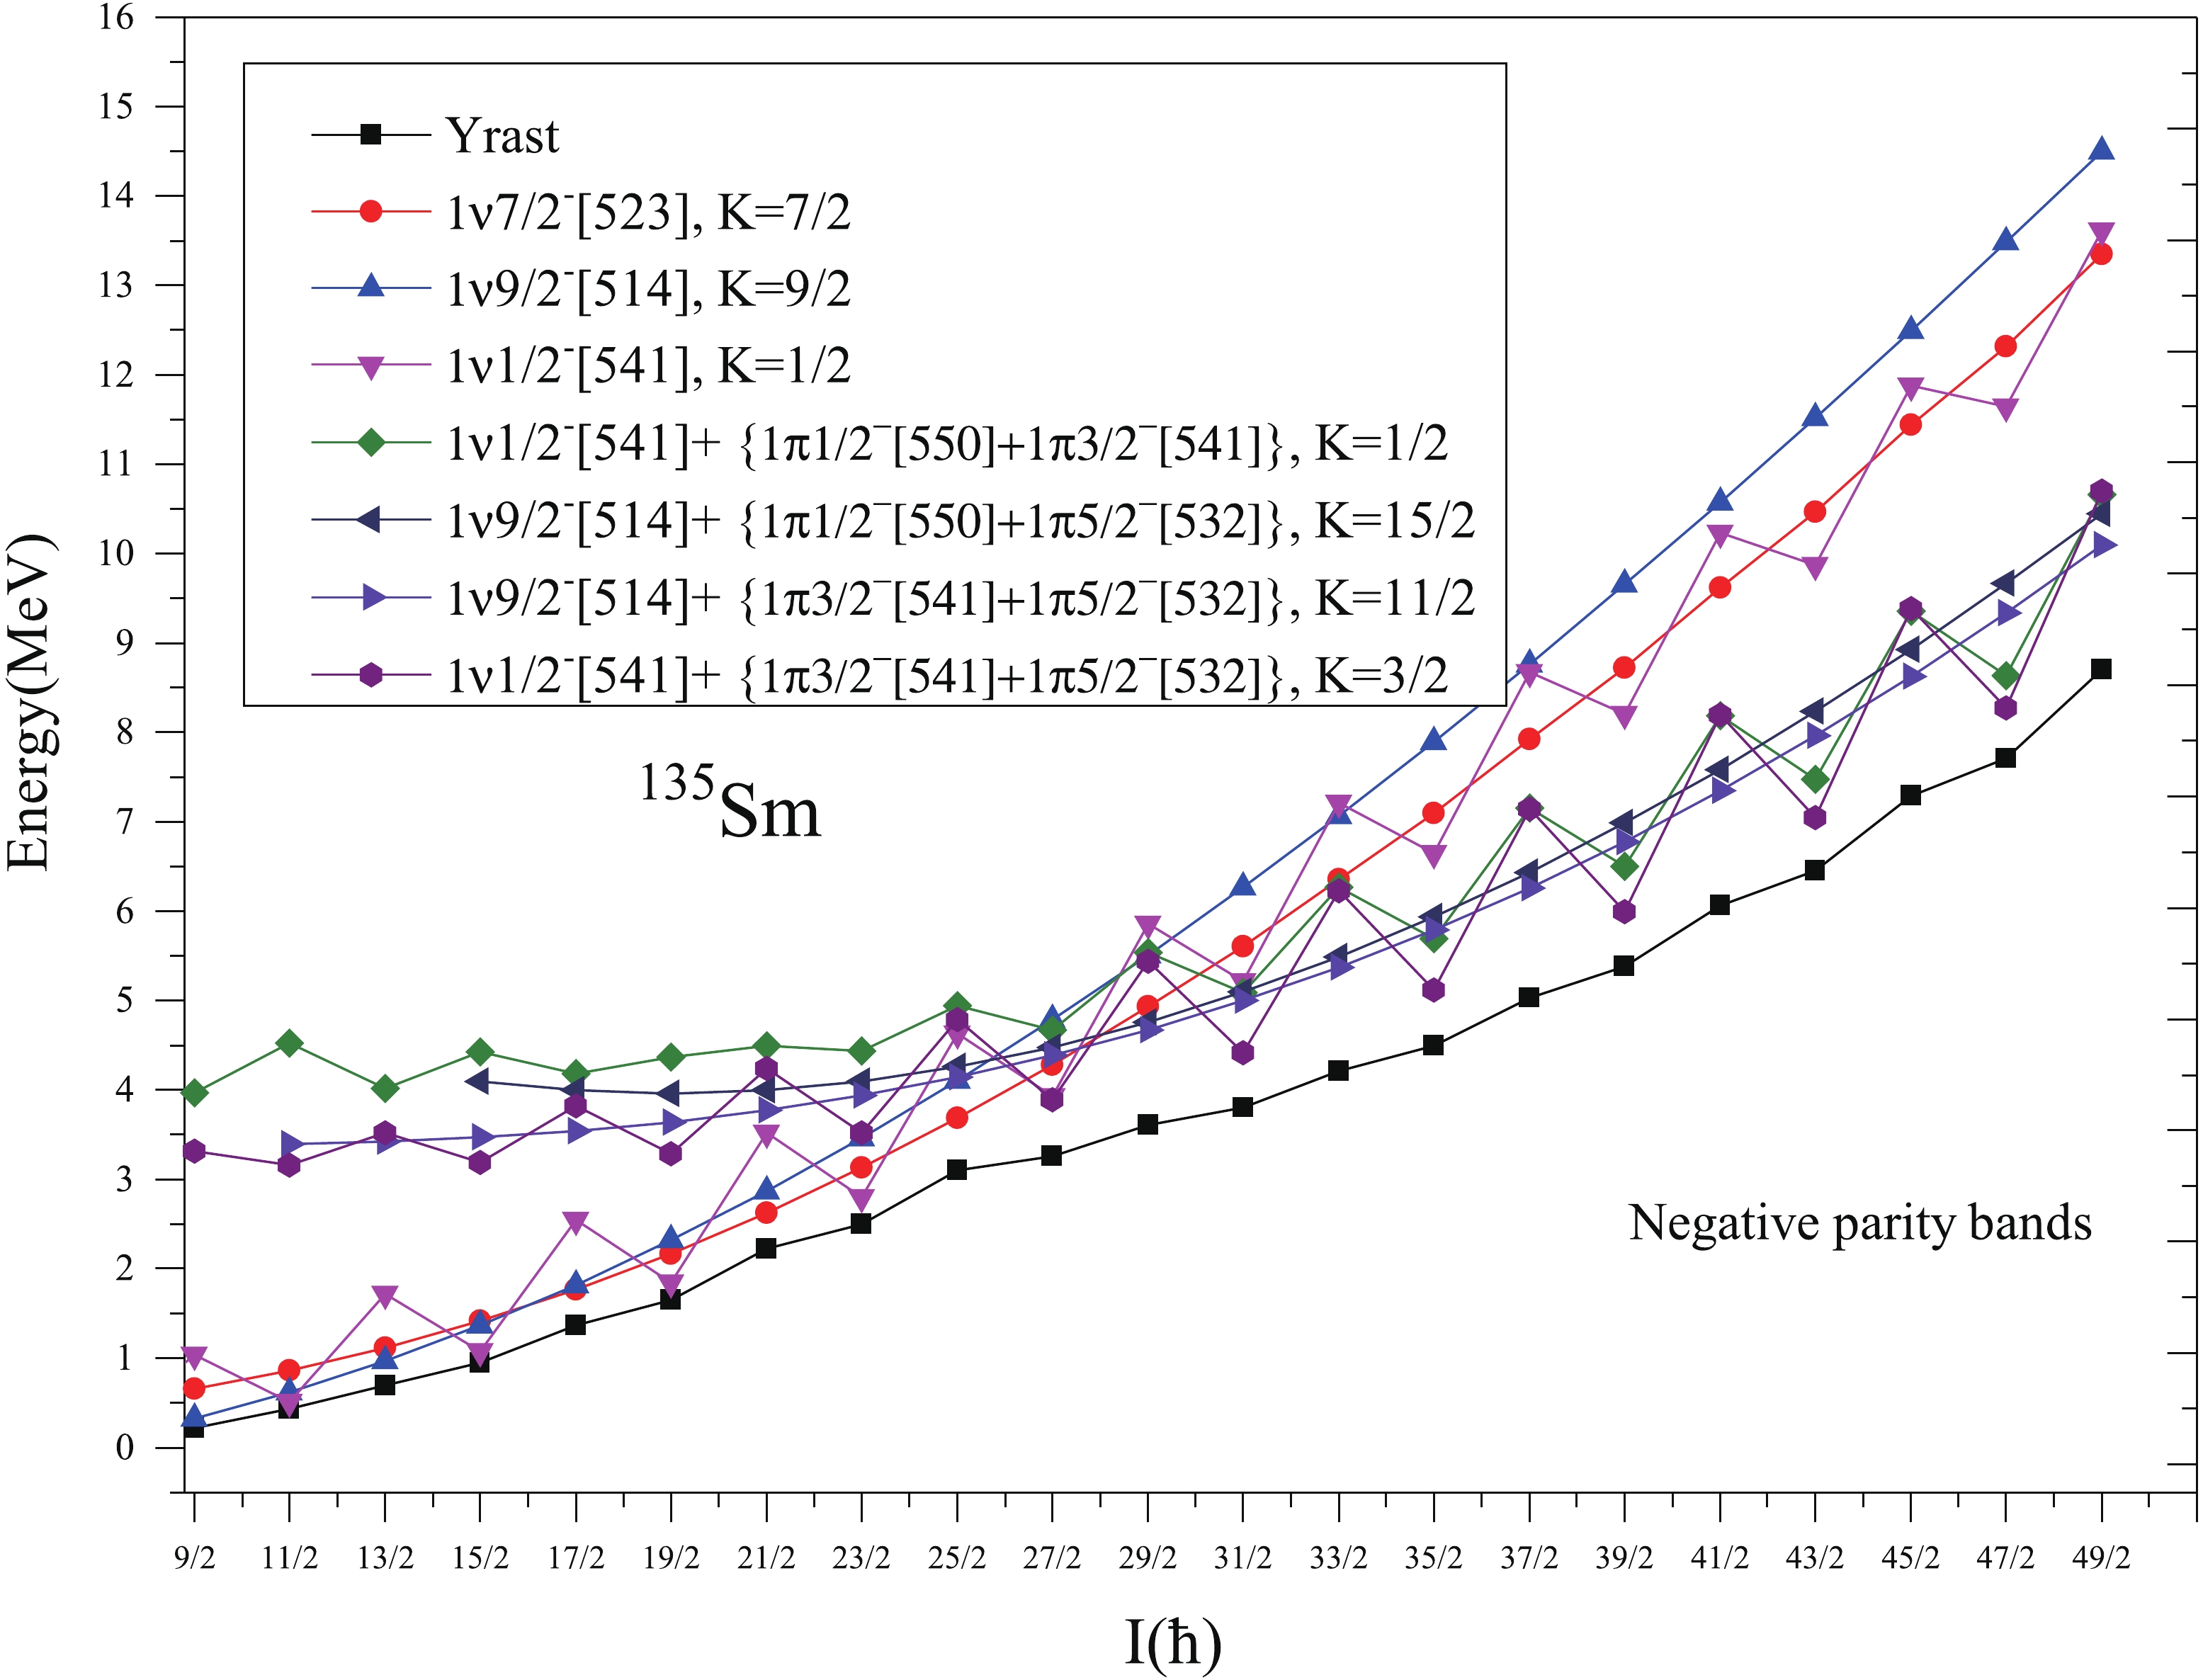
Figure 13.(color online) Band diagram for negative parity bands for135Sm. Only low-lying and significant bands are taken.
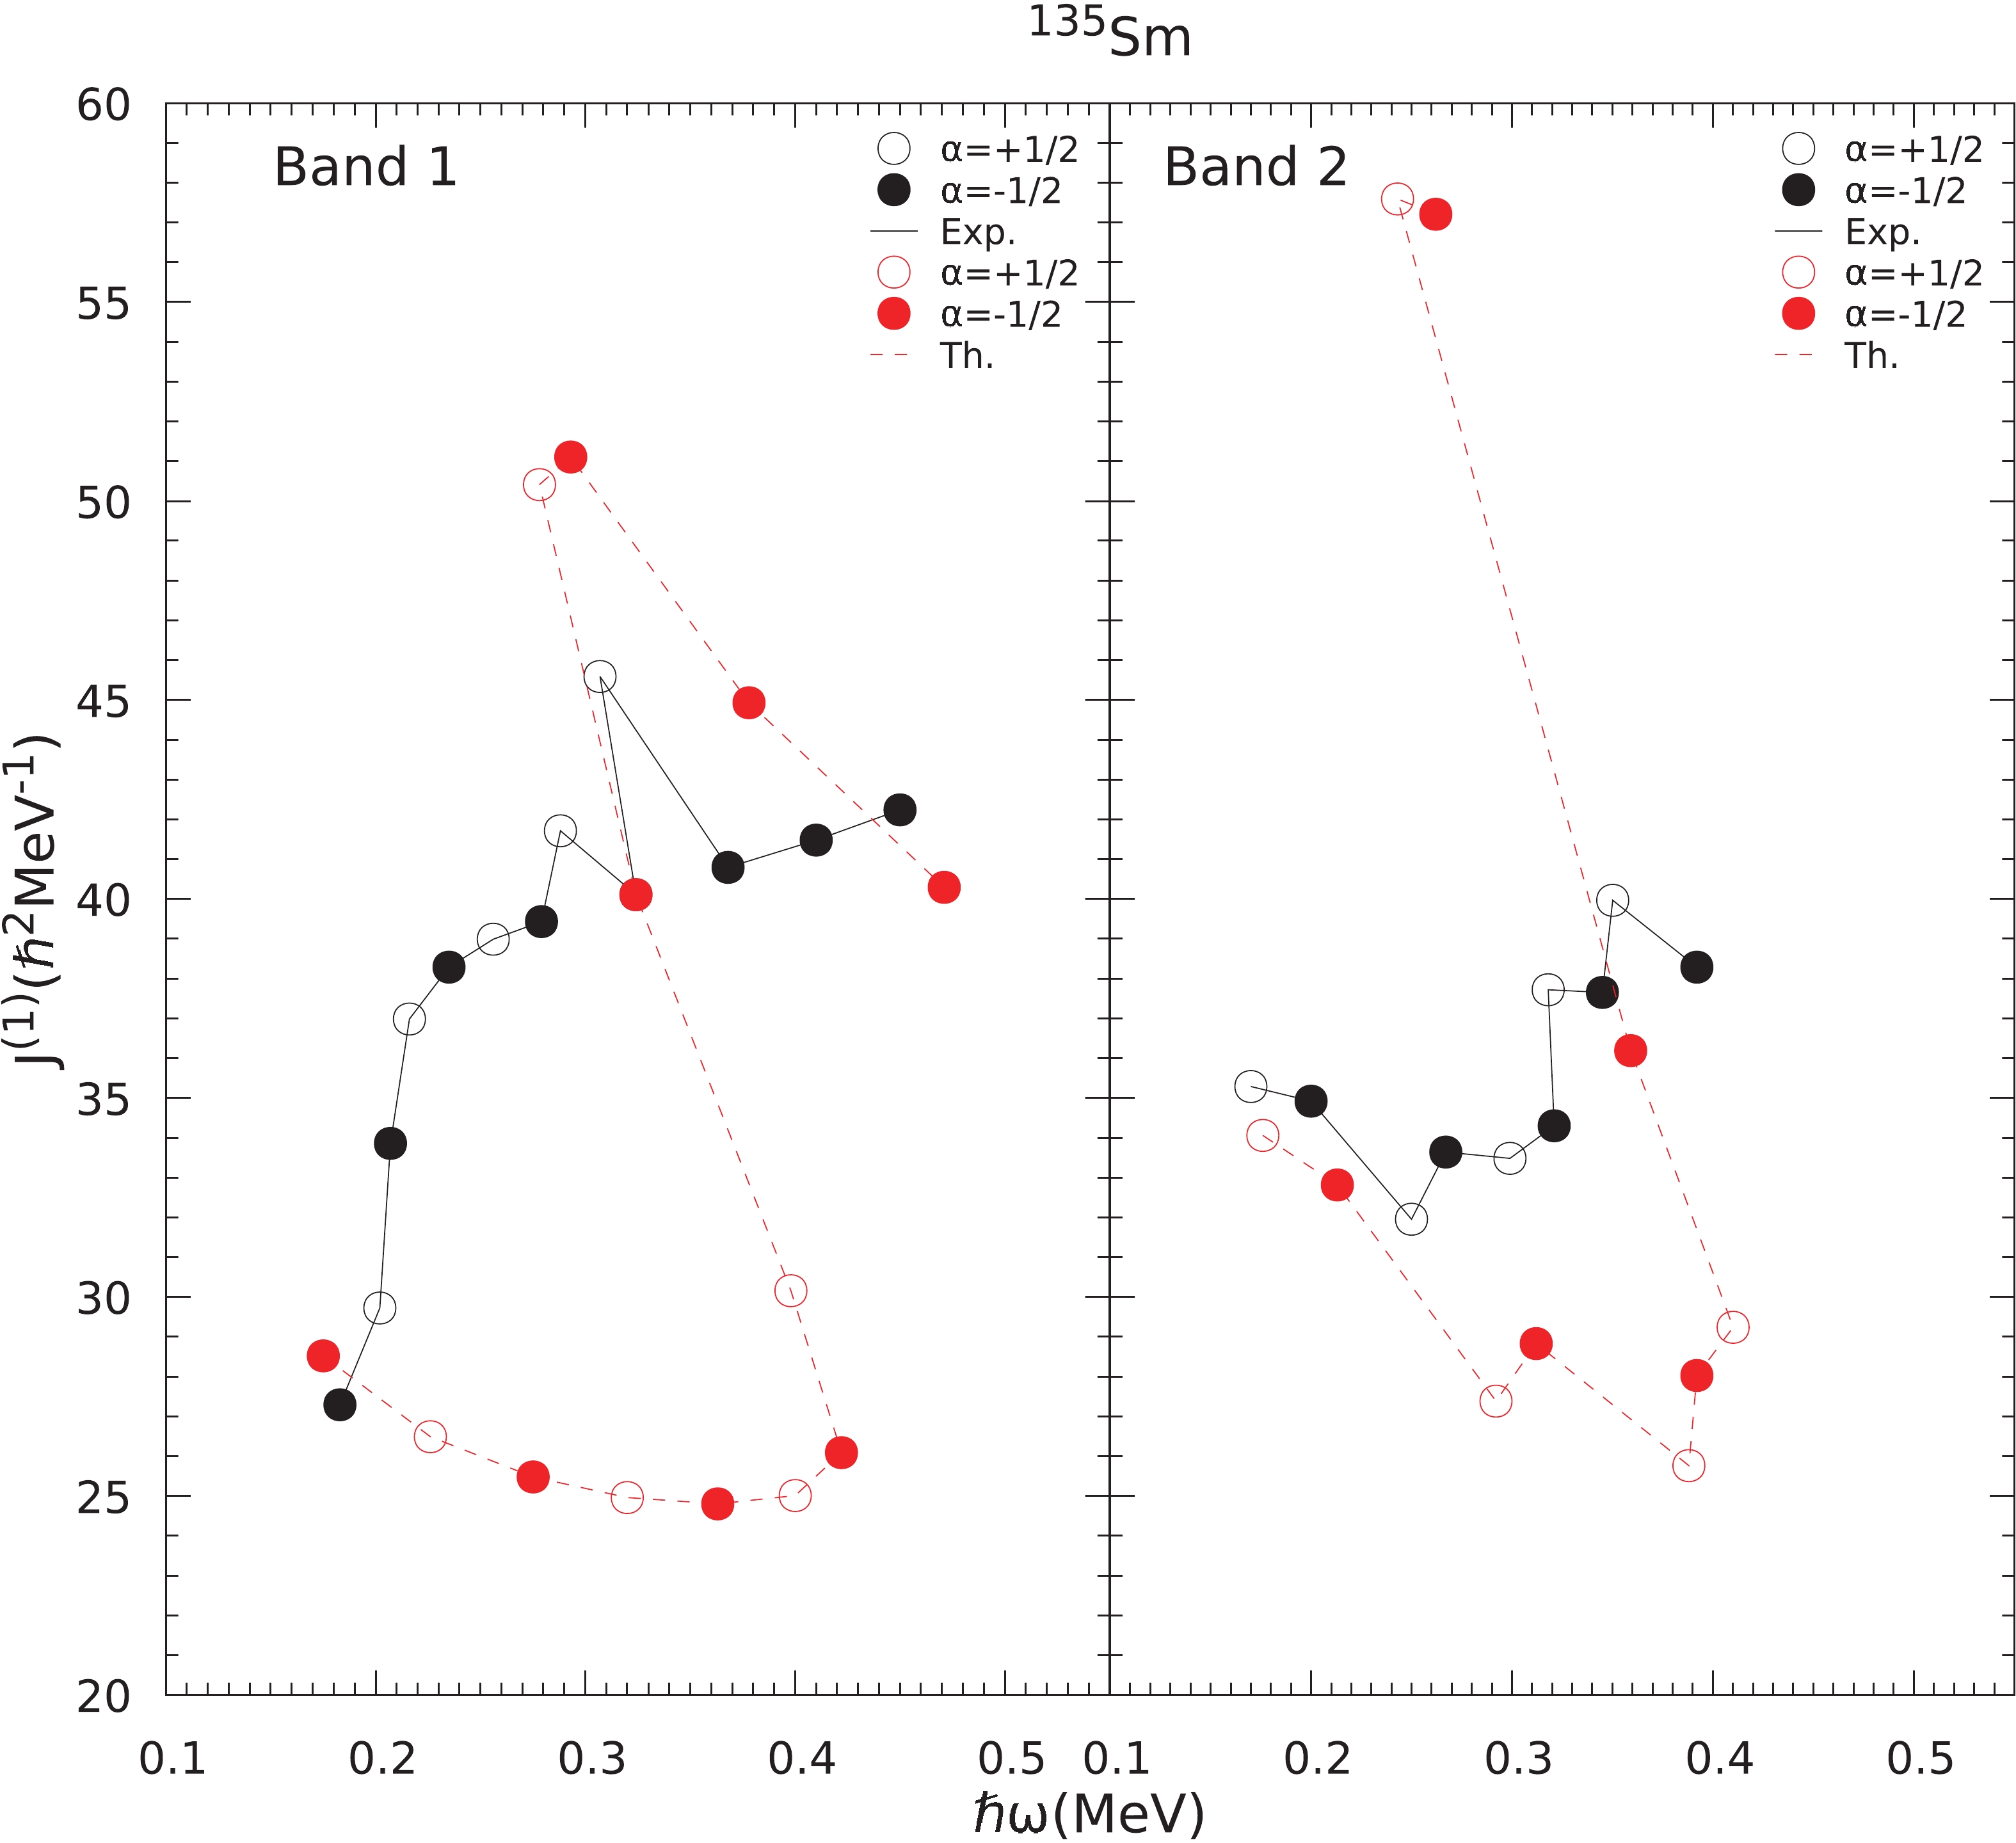
Figure 14.(color online) Comparison of calculated and experimental kinetic moment of inertiaJ(1), for bands 1,2 as a function of rotational frequency (ω) in135Sm.
-
The comparison of calculated kinetic moment of inertiaJ(1)versusωwith the experimental ones for yrast bands 1 and 2 of135Sm, is presented inFig. 14. The calculated curve for band 1 shows a large increase inJ(1)values at spinI=27/2 at rotational frequency
$\hbar \omega $ ~0.34 MeV thereby, predicting the phenomenon of backbending in the vicinity of the region of crossing of 1-qp bands by 3-qp bands. However, the change in experimentalJ(1)curve observed in experimental values around spinI=25/2, at$\hbar \omega $ ~0.30 is less pronounced as compared to calculated results.Now, coming to band 2, the comparison of calculated and experimentalJ(1)versusωplots, presented inFig. 14, for band 2, show the staggering pattern clearly. The calculated results reproduce the experimental zigzag pattern, nicely. However, the calculated values ofJ(1)show a large increase inJ(1)atI=25/2 at
$\hbar \omega $ ~0.28 MeV due to the crossing of 3-qp bands. Thus, the calculated results predict a sharp change inJ(1)in yrast positive and negative parity bands 1 and 2 of135Sm at higher spins around the band crossing region due to the large crossing angle between the 1-qp and 3-qp bands. -
In137Sm, the experimental band spectra and band head energies of yrast negative and positive parity bands are confirmed experimentally [6,7,27]. Calculations are performed for137Sm with the deformation parametersε2=0.20 andε4=0.04 for the yrast negative and positive parity bands 1 and 2, of137Sm. These values of deformation parameters are the same as predicted for137Sm by the authors of Refs. [24,25].Figure 15shows the calculated energy levels for yrastI=9/2-negative andI=7/2+positive parity bands together with the experimental data of Ref. [27]. As one can see from theFig. 15, the calculated experimental data of negative parity band 1 are reproduced very well by the present calculations. The difference between the experimental and calculated values at the highest known spin 43/2−is only 0.044 MeV. Now coming to the discussion on energy level spectra of the positive parity band built on band head spinIπ=7/2+and represented by band 2 in theFig. 15, the energies of the experimental and calculated band head spins are almost same. It means the experimental energy of the band head spin 7/2+of this positive parity band is exactly reproduced. The difference between experimental and calculated values at the highest known spin 37/2+of band 2 is 0.429 MeV.
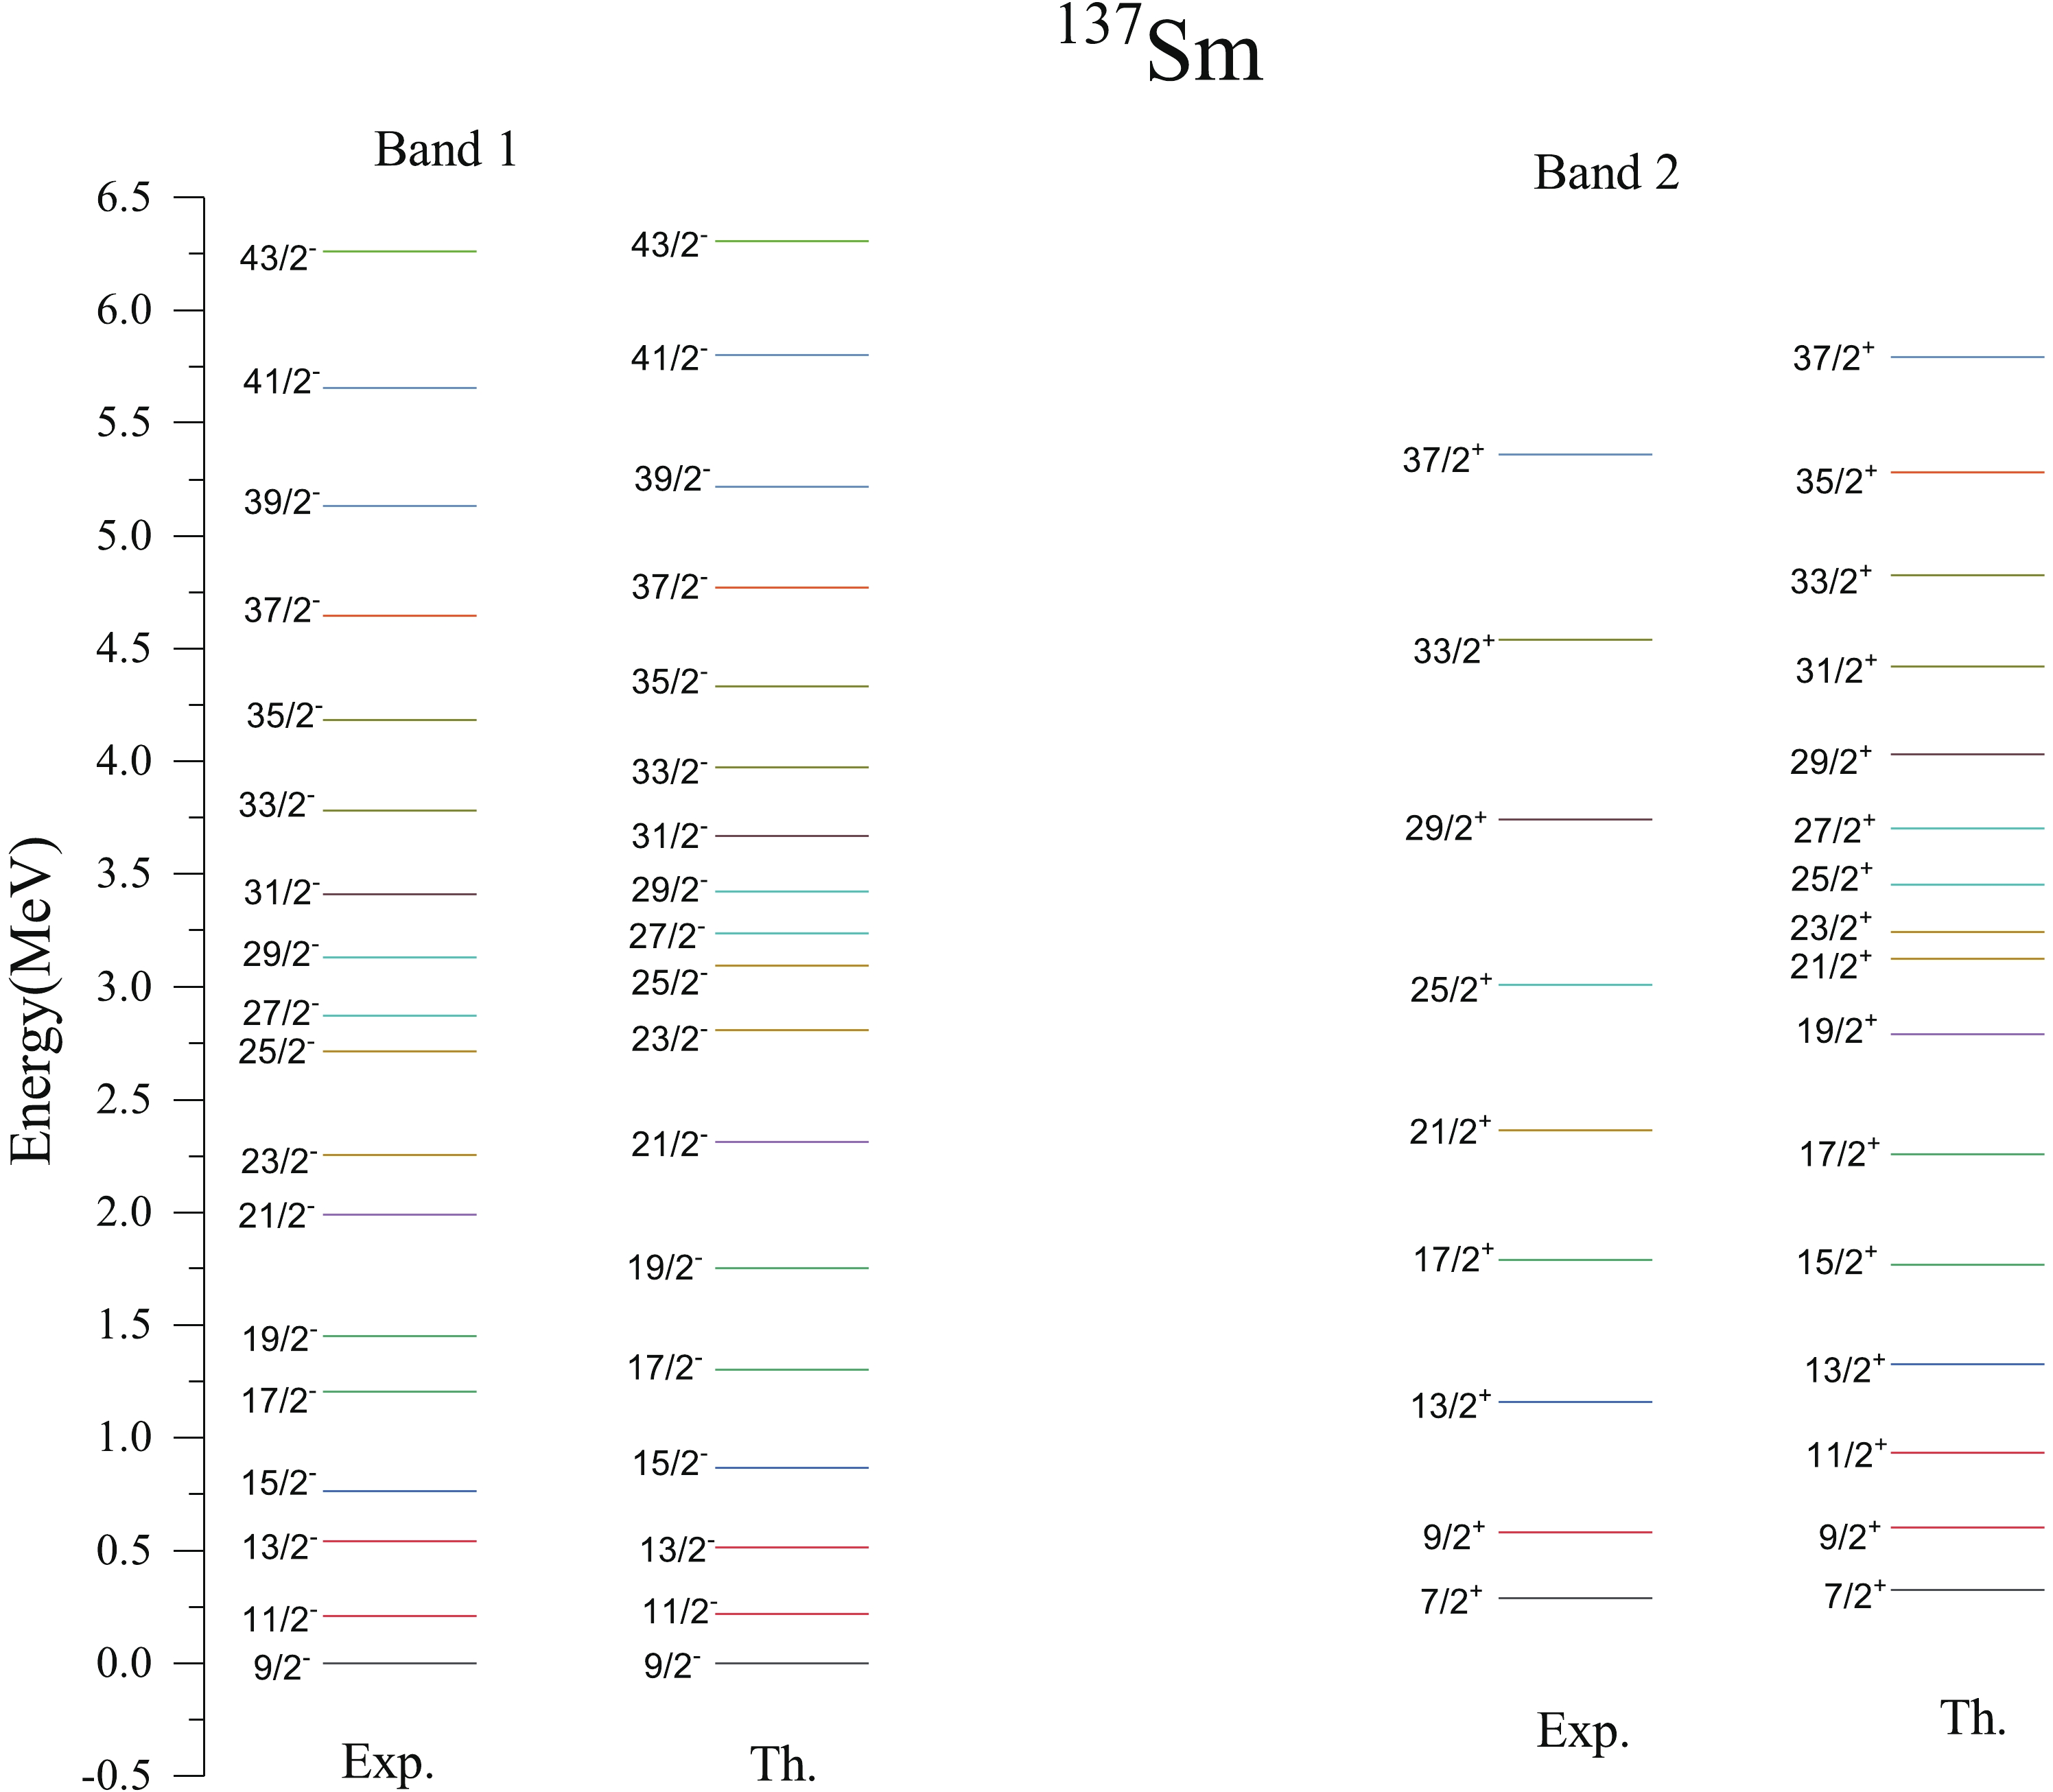
Figure 15.(color online) Comparison of theoretical (Th.) energy levels with the available experimental (Exp.) data [27] for negative parity band 1 and positive parity band 2 of137Sm.
-
Figure 16shows relevant 1-qp and 3-qp bands of negative parity along with their configurations for137Sm. From the figure, it is evident that the dominant structure of yrast band up to the spin 15/2−isK=9/2 state of neutronh11/2orbital, which is consistent with the band head spin and configuration observed for this band by the authors of Refs. [6,7,27]. At the spinI=17/2−, another 1-qp neutron 2f7/2band interacts with this 1-qph11/2band and energy states of the yrast band from the spinI=19/2−toI=23/2−are predominantly arising fromK=1/2 state of 1ν2f7/2orbital. Around the spinI=25/2−, the 1-qp neutron bands are crossed by two 3-qp bands consisting of single neutron coupled to a pair of protons with configurations 1ν9/2−[514]+{1π1/2−[550]+1π3/2−[541]},K=11/2 and 1ν9/2−[514]+{1π1/2−[550]+1π5/2−[532]},K=15/2. This band crossing causes a significant change in the yrast structure of137Sm and the yrast states of negative parity band aboveI=23/2 are predicted to arise from the superposition of these two 3-qp bands.
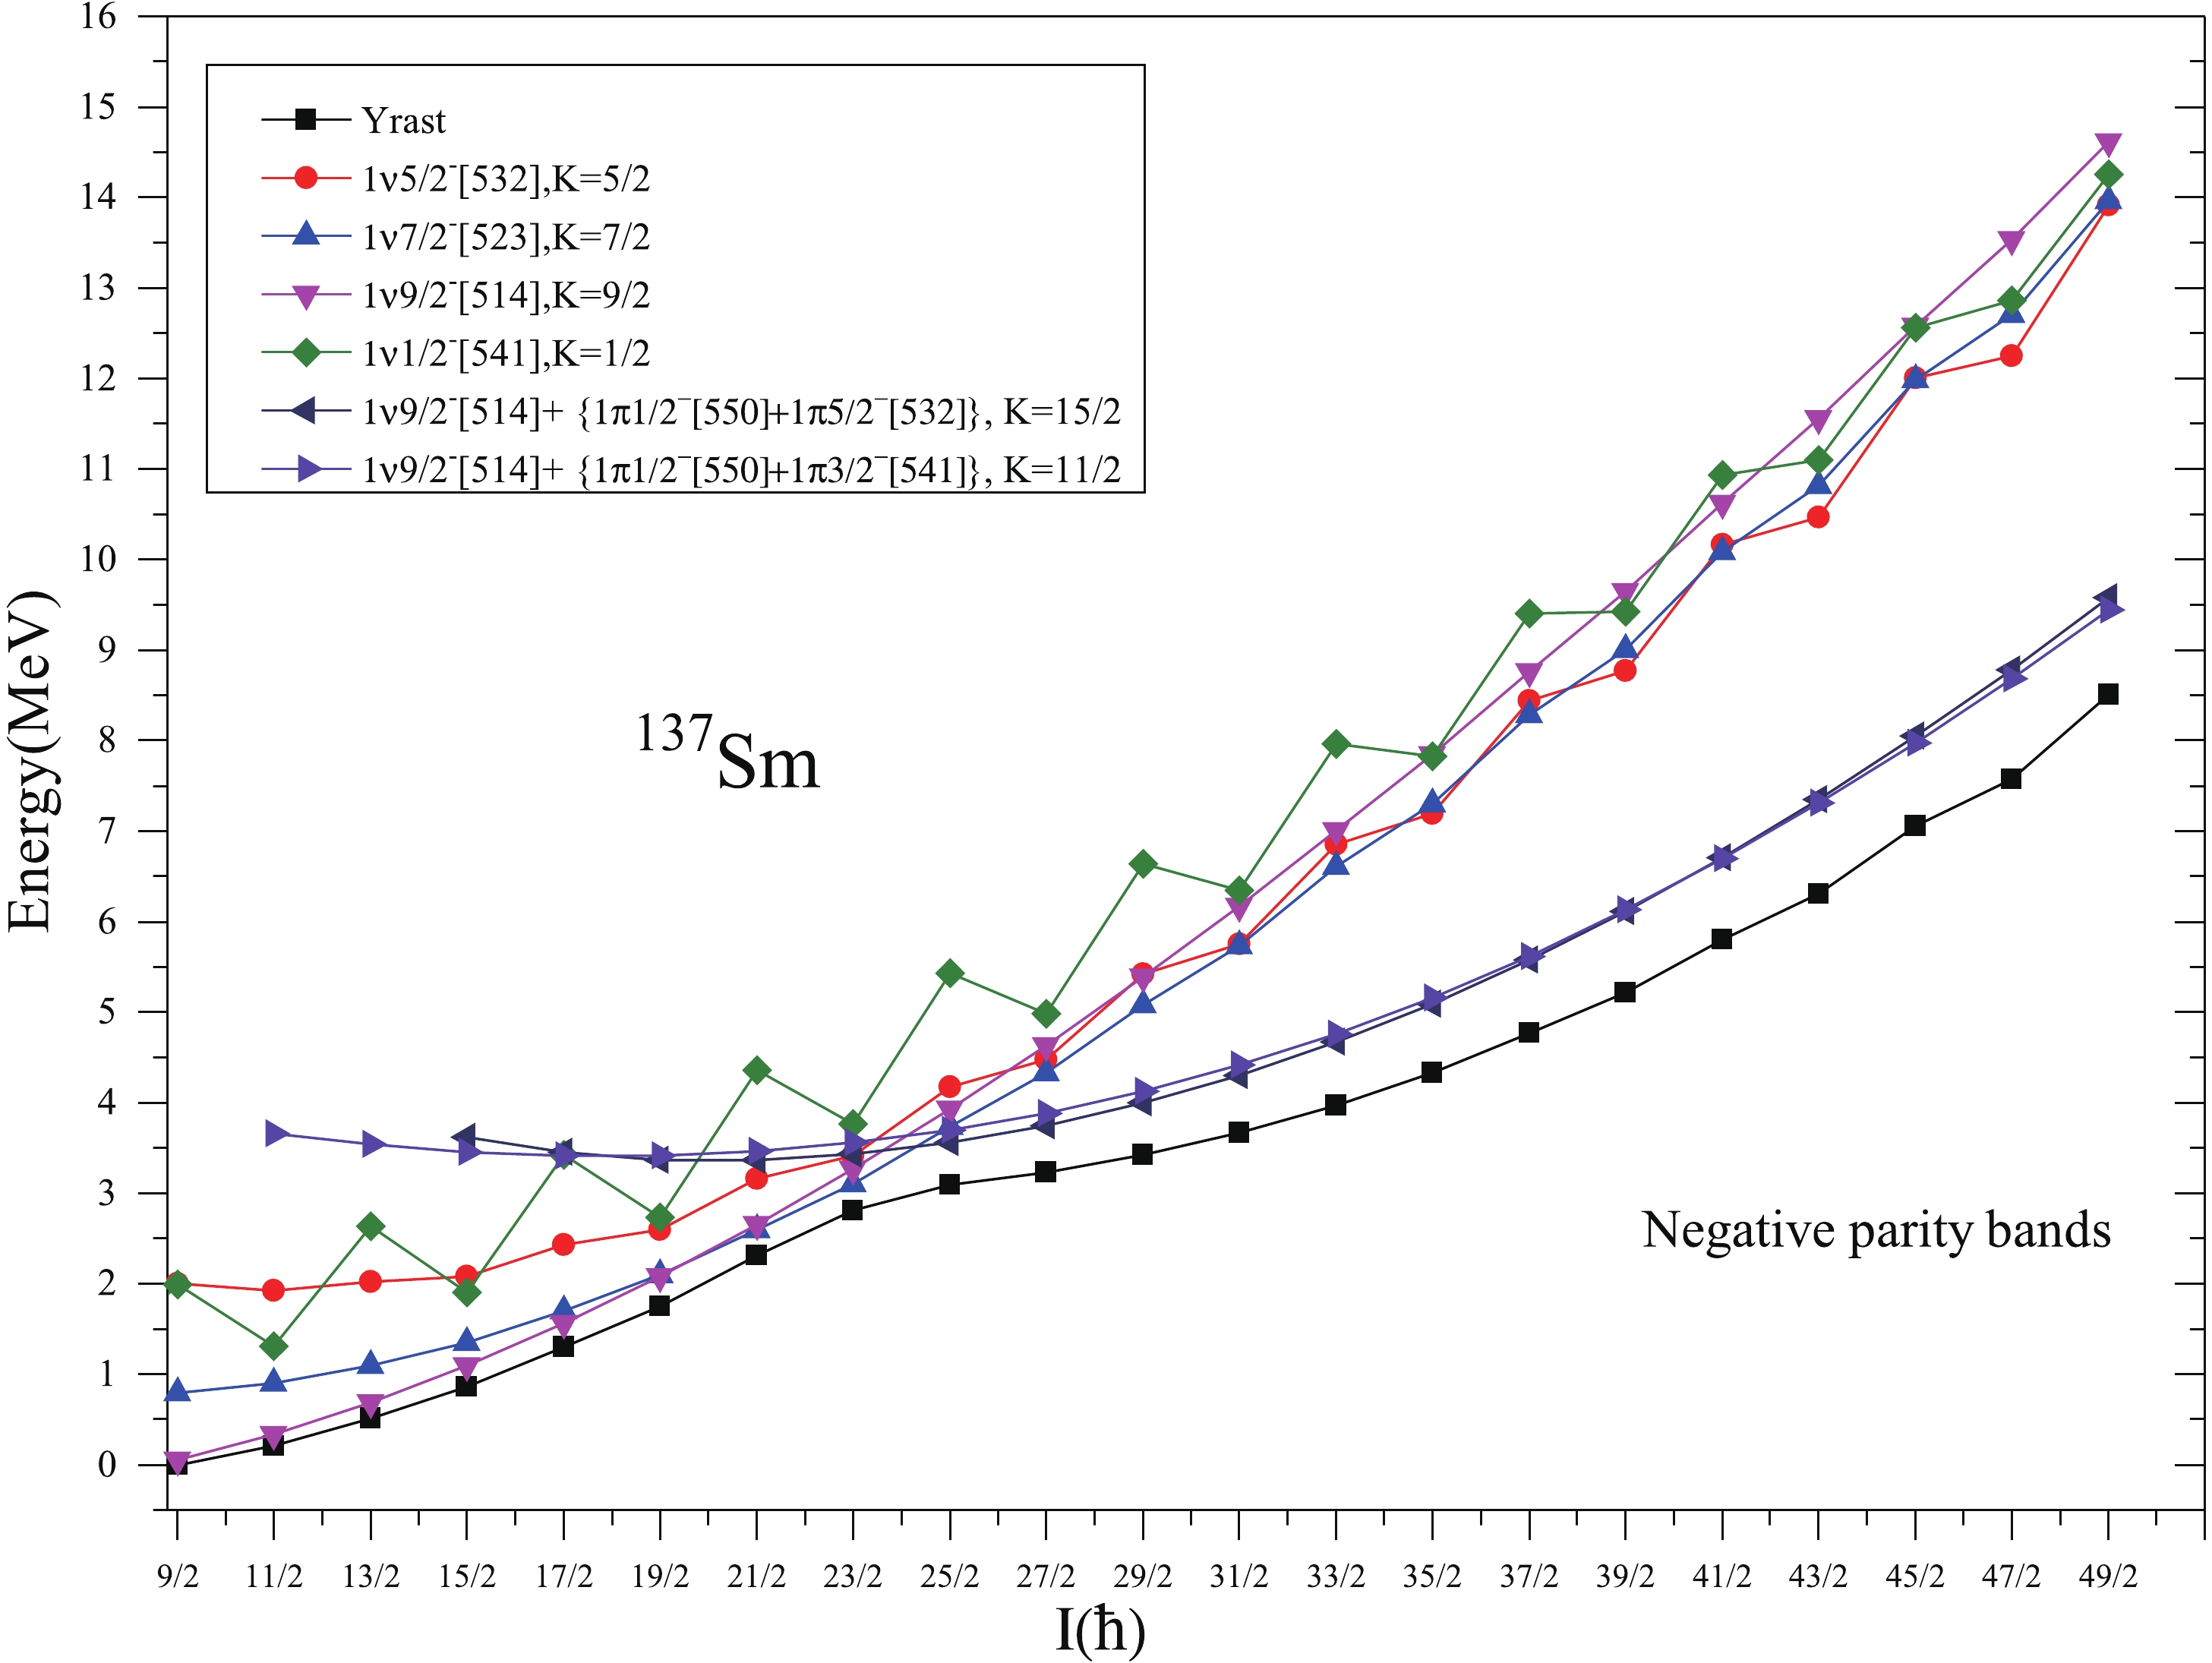
Figure 16.(color online) Band diagram for negative parity bands for137Sm. Only low-lying and significant bands are taken.
Figure 17represents the band diagram for positive parity bands of137Sm. From this figure, it can be seen that the 1-qp neutron band fromK=7/2 state of neutron orbitalg7/2is lowest in energy from all the other positive parity bands. This lowest energy band of positive parity goes monotonically up to the spinI=21/2+. The authors of Ref. [8] proposed this band to originate from theK=1/2 state of neutrond3/2orbital. However, reasonably good agreement with the experimental energies for whole of this band support it to arise from the predicted configuration 1ν7/2+[404](1g7/2) for this band. Further, at the spinI=23/2+, band crossing by multiple 3-qp bands causes a significant change in the energy states of the lowest positive parity states. It can be predicted that after the band crossing the lowest positive parity states has a composite structure and are predicted to arise from the superposition of multi 3-qp bands whose configurations are shown in theFig. 17.
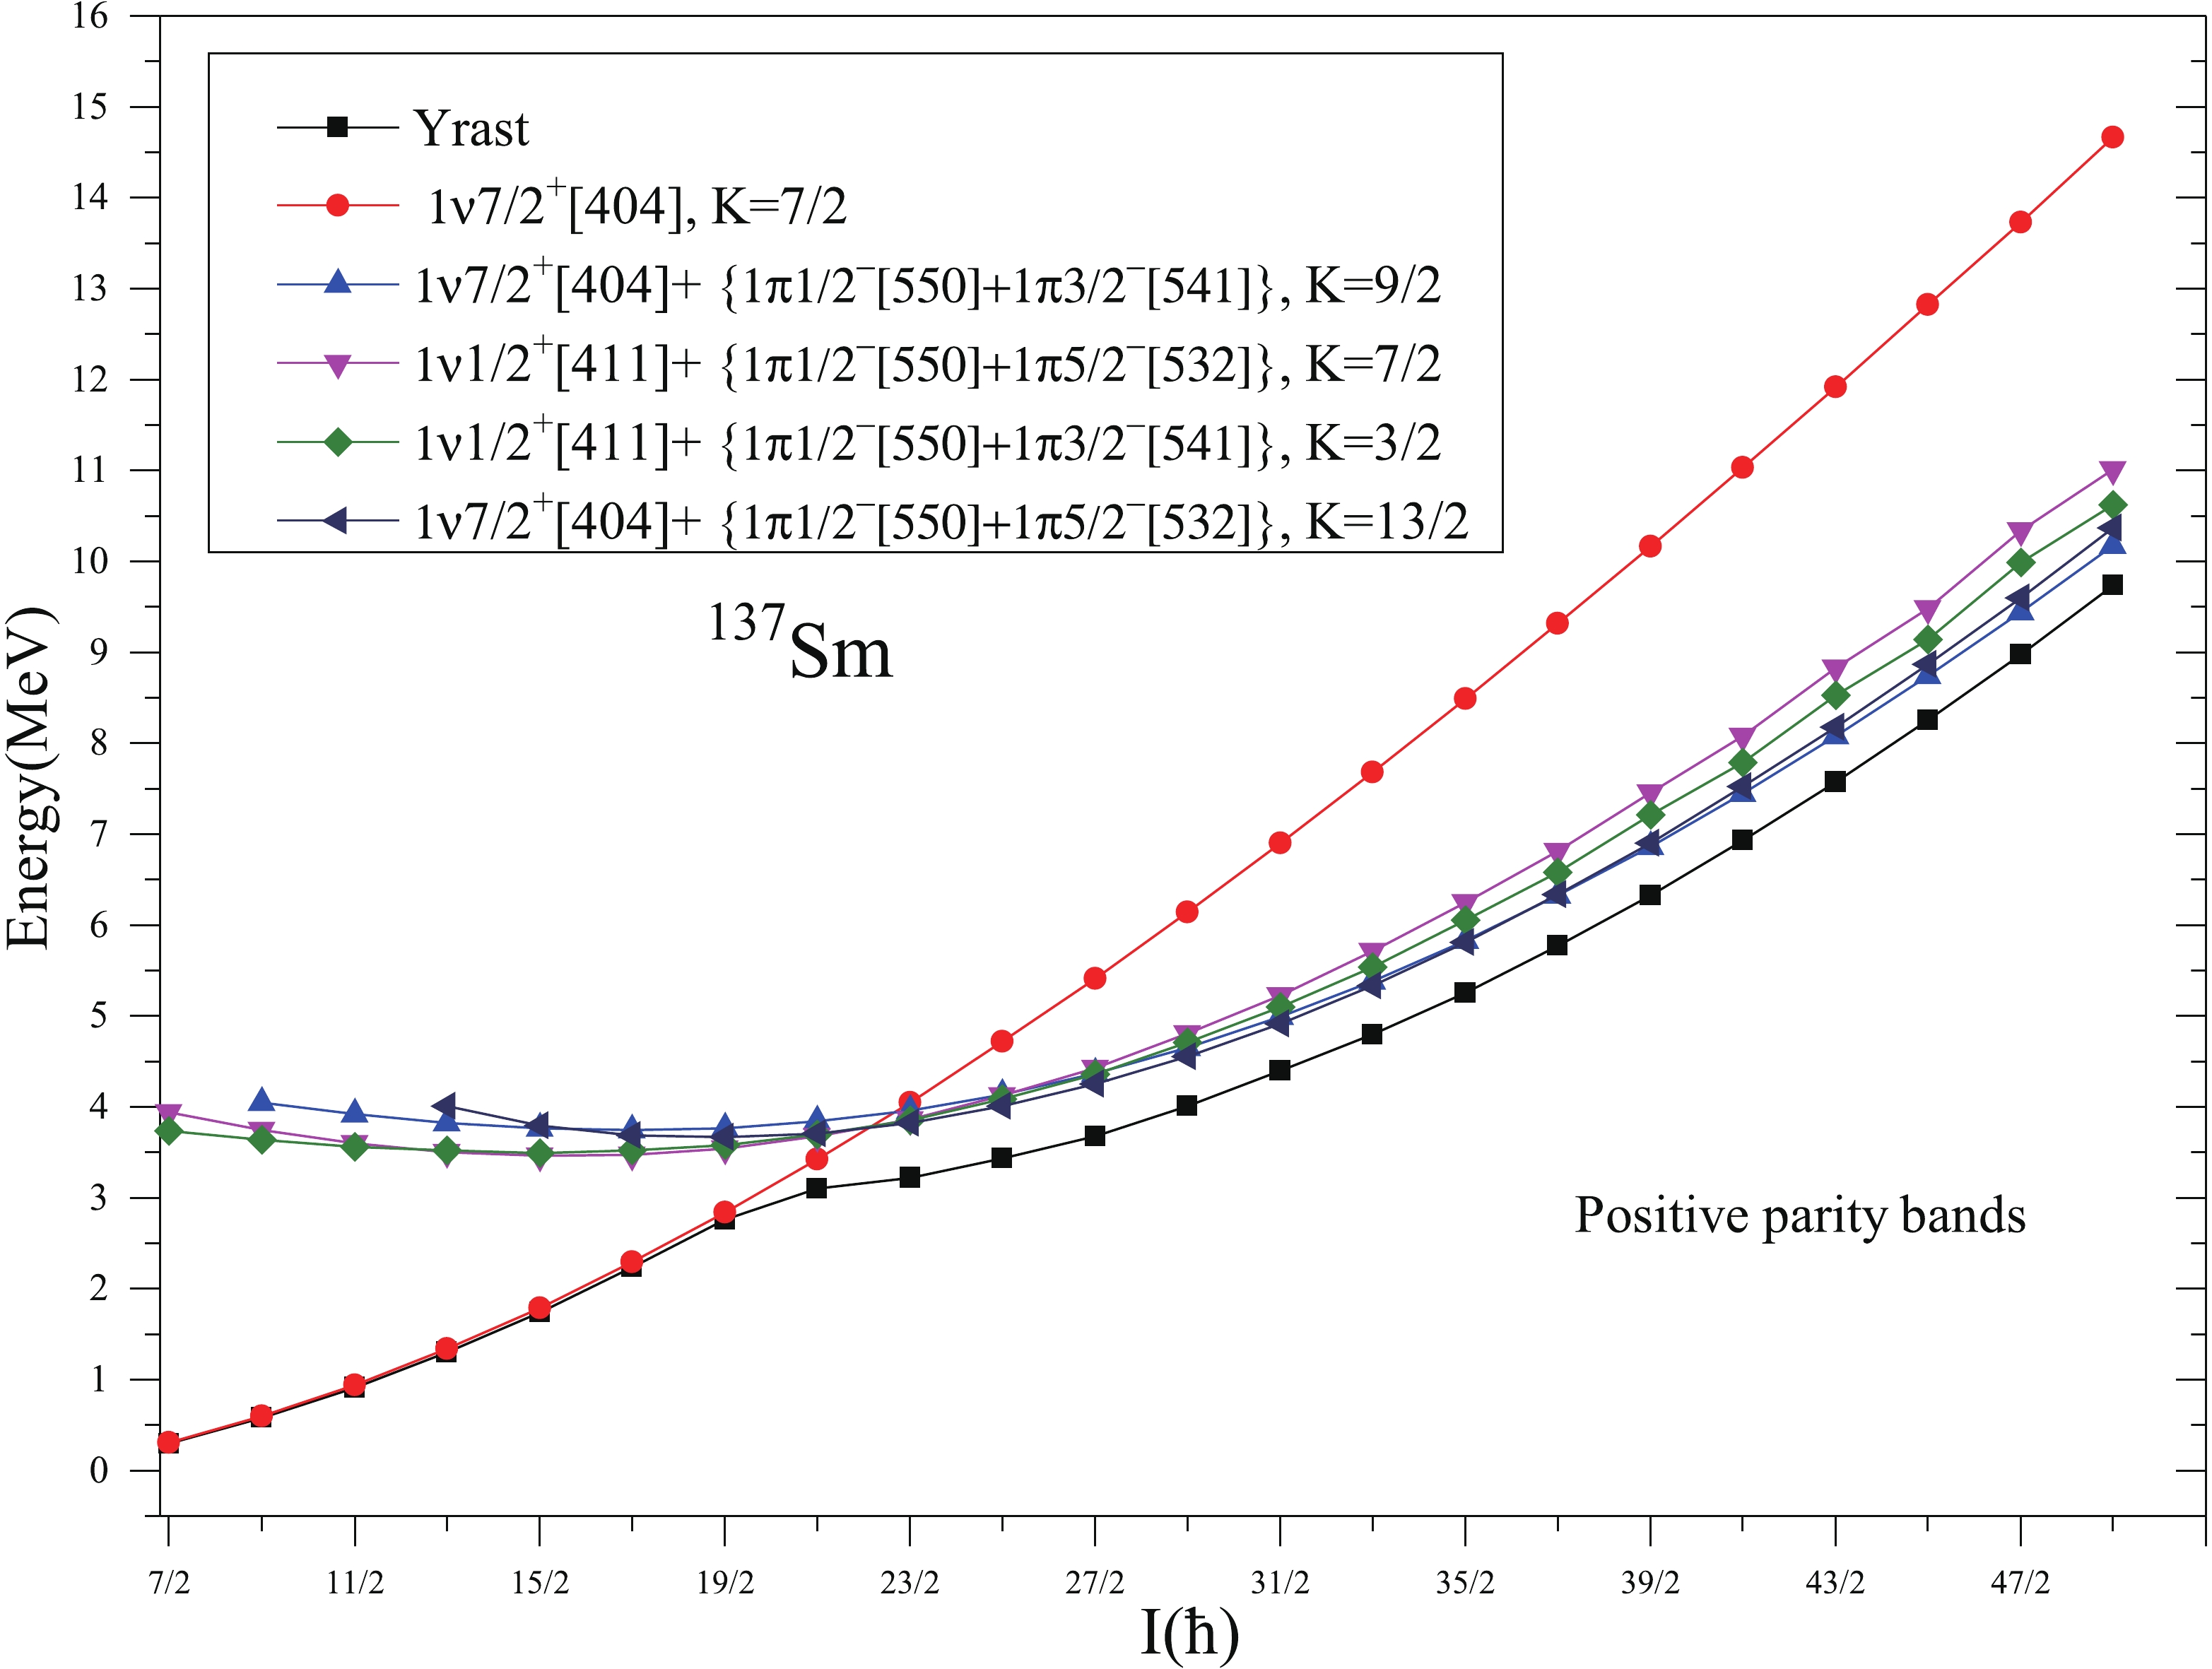
Figure 17.(color online) Band diagram for positive parity bands for137Sm. Only low-lying and significant bands are taken.
-
The experimental and calculatedJ(1)versusωplots for137Sm are displayed inFig. 18. From this figure, it is observed that for negative parity band 1, both the experimental and calculated results show the phenomenon of backbending at the same spinI=25/2−and at rotational frequencies
$\hbar \omega $ =0.34 and 0.366, respectively. The crossing frequencies predicted by the present calculations are consistent with those given in Ref. [6]. This phenomenon of backbending occurs at the spin around which 1-qp neutron bands are crossed by 3-qp (1ν+2π) bands as seen inFig. 16and it may be due to the alignment of a pair of protons in the π(h11/2)2orbitals. However, the staggering observed at low spins is not reproduced by the present calculation.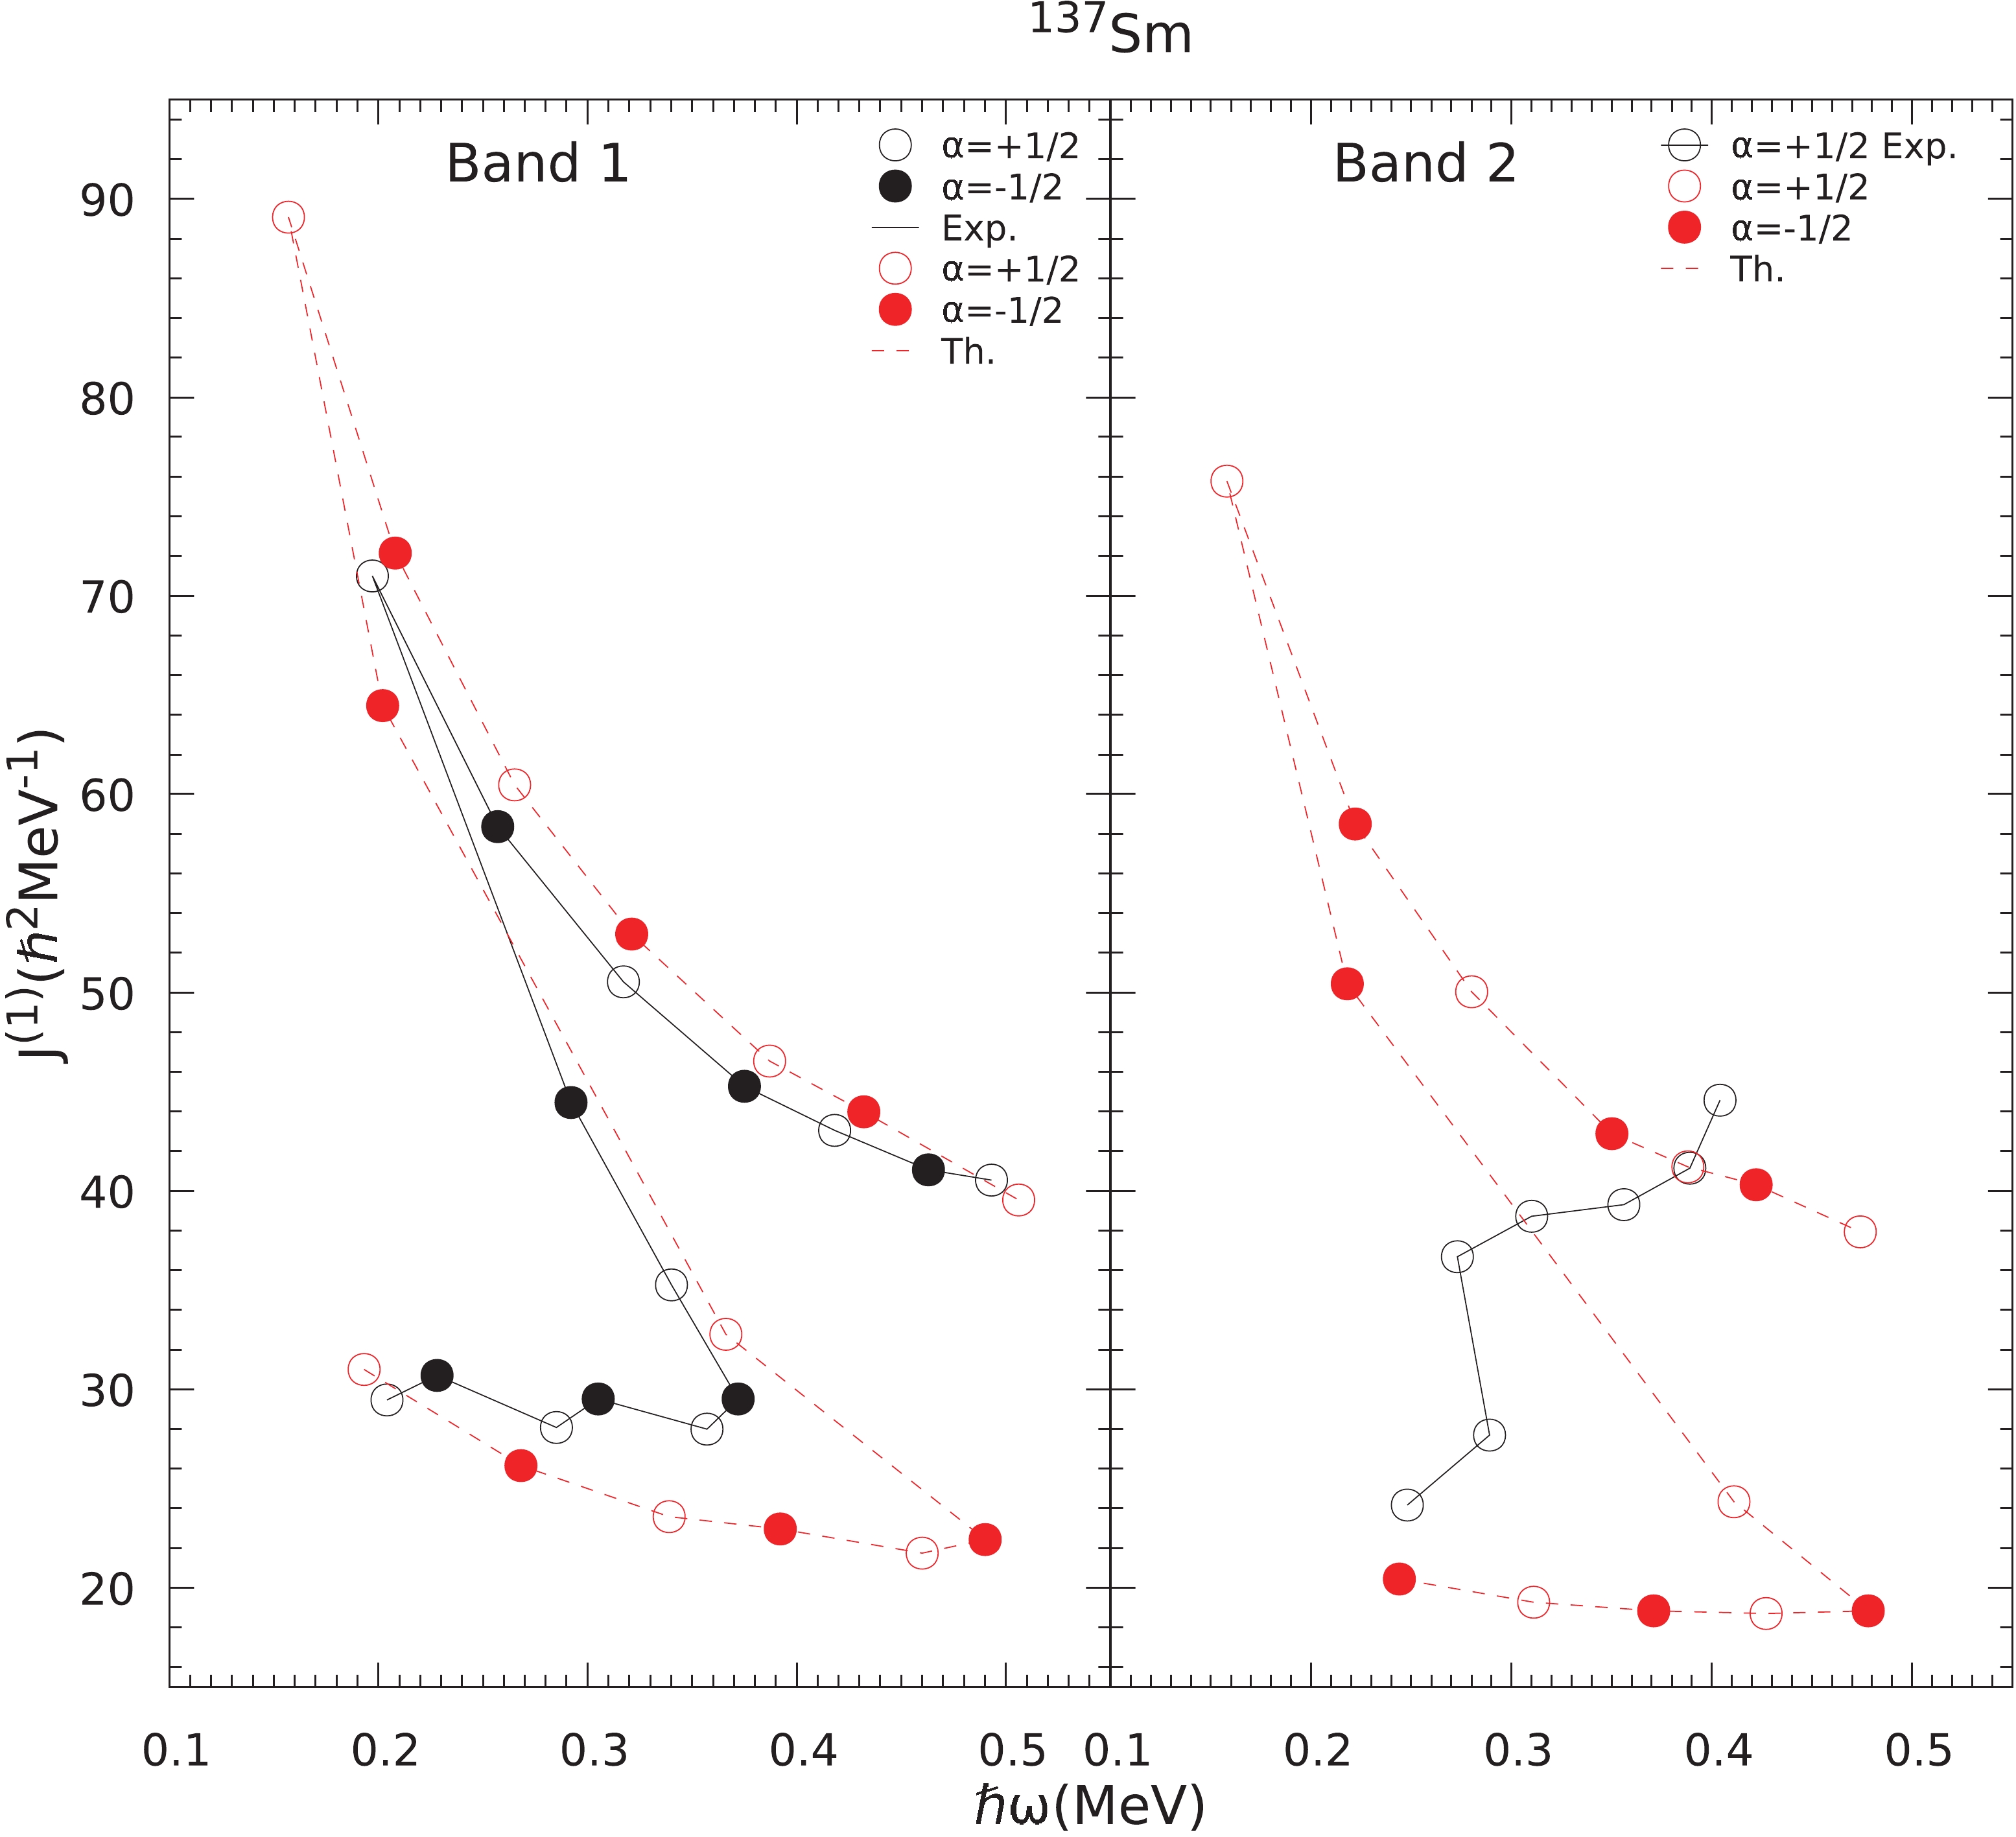
Figure 18.(color online) Comparison of calculated and experimental kinetic moment of inertiaJ(1), for bands 1,2 as a function of rotational frequency (ω) in137Sm.
Similarly, theJ(1)versusω, plots of positive parity band 2, presented in the same figure, show the phenomenon of backbending in the experimental and calculated results at the same spinI=21/2+and at rotational frequencies
$\hbar \omega $ =0.273 and 0.411, respectively and it is due to the crossing of 1-qp neutron band by 3-qp (1ν+2π) bands as seen inFig. 17. Thus, the phenomenon of backbending in the yrast negative and positive parity bands of137Sm, arises due to the alignment of a pair of protons in the down sloppingK- components of π(h11/2)2orbitals. -
The energy of electromagnetic radiation field can be described mathematically in terms of a multipole moment expansion. The terms correspond to 2n- pole and the lowest terms aren=0 (monopole),n=1 (dipole),n=2 (quadrupole),n=3 (octupole),n=4 (hexadecapole) and so on. The electric quadrupole transition probabilityB(E2) of a nucleus is sensitive to nuclear charge distribution and collective effects such as deformation. The magnetic dipole transition probabilityB(M1) are sensitive to nuclear magnetic moments and single particle properties. Experimentally, it is difficult to obtain absoluteB(E2) andB(M1) values through measurements of mean life times of nuclear states. In contrast, it is relatively easy to extract the ratioB(M1)/B(E2), knowing just γ-ray energies and intensities. TheB(M1)/B(E2) values are sensitively dependent on the single particle angular momentum states occupied by the valence protons and neutrons. These are directly linked to the wave functions of the system and their prediction poses an important test for nuclear structure models. It is therefore important to calculate these quantities for rotational bands of odd mass neutron deficient Sm isotopes.
The calculation of electromagnetic transition probabilities [30] are important for the reliability of the wave functions generated by Eq. (1). The reduced electric quadrupole transition probabilityB(E2) from an initial stateIi=Ito a final stateIf=I-2is given by
$ B\left( {E2,{I_i} \to {I_f}} \right) = \frac{{{e^2}}}{{\left( {2{I_i} + 1} \right)}}{\left| {\left\langle {{\sigma _f},{I_f}\left\| {{{\hat Q}_2}} \right\|{\sigma _i},{I_i}} \right\rangle } \right|^2}, $

where the operator
${\hat Q_2}$ is related to the quadrupole operator. In the present calculations, the proton and neutron effective charges are calculated as${e_\pi } = e\left[ {1 + \left( {{e_{\rm eff}}} \right)} \right]$ and${e_v} = e\left( {{e_{\rm eff}}} \right)$ with${e_{\rm eff}} = 0.5$ for all Sm nuclei studied in this paper.TheB(M1) transition probability from an initial stateIi=Ito a final stateIf=I-1 is calculated by using the relation
$ B\left( {M1,{I_i} \to {I_f}} \right) = \frac{{\mu _N^2}}{{2{I_i} + 1}}{\left| {\left\langle {{\sigma _f},{I_f}\left\| {{{\hat M}_1}} \right\|{\sigma _i},{I_i}} \right\rangle } \right|^2} $

where the magnetic dipole operator is defined as
$\hat M_1^\tau \! =\! g_l^\tau {{\hat J}^\tau }\! + $ $\left( {g_s^\tau - g_l^\tau } \right){{\hat s}^\tau }$ . Hereτis eitherπorνandglandgsare the orbital and spin gyromagnetic factors, respectively. In the present calculations, the free values ofglare taken and forgsthe free values are damped by a 0.75 factor$ g_l^\pi = 1\;\;\;\;g_s^\pi = 5.59\;\times \;0.75\;\;\;\;\;\;g_l^v = 0\;\;\;\;\;g_s^v = - 3.826\;\times \;0.75 $

-
The experimental data onB(E2) andB(M1) transition probabilities is not available for133-137Sm isotopes, but the experimental data [4,6,8] onB(M1)/B(E2) ratios is available for low spin states of133,137Sm. Therefore,B(M1)/B(E2) ratios are presented inTable 2for comparison with the available experimental data and the results are discussed in the following subsections.
Nucleus Positive parity yrast bands 1 and 2 Negative parity yrast bands 5 and 6 (a)33Sm Spin (I) B(M1)/B(E2) (μn/eb)2 B(M1)/B(E2) (μn/eb)2 Exp. [4] Th. Exp. Th. 9/2 0.766±0.251 0.936 − − 11/2 0.782±0.190 0.633 0.372±0.114 0.749 13/2 0.827±0.159 0.530 0.300±0.200 0.487 15/2 0.570±0.123 0.476 0.349±0.143 0.402 17/2 0.452±0.092 0.441 0.306±0.200 0.360 19/2 0.415 0.336 21/2 0.394 0.319 23/2 0.373 0.308 25/2 0.353 0.297 27/2 0.325 0.292 29/2 0.278 0.279 31/2 0.179 0.276 33/2 0.098 0.255 -
The experimental data onB(M1)/B(E2) ratios is known up to spinI=17/2 only. The comparison of calculatedB(M1)/B(E2) ratios with the available experimental data [4] is represented inTable 2. The agreement between calculated transition strengths and available experimental values is good except at the angular momentum state 13/2+. The experimental data, show an increase inB(M1)/B(E2) values as one moves from spinI=9/2 to 13/2, and a decrease fromI=13/2 to 17/2. The calculated results predict a decreasing trend with spin up to the band crossing spinI=33/2, thereby, showing a change in the structure of bands 1 and 2 around the band crossing region.
-
The comparison of calculated and available experimental [4] transition strength ratiosB(M1)/B(E2) for negative parity bands is also presented inTable 2(a). From this table, it is observed that the present calculations have nicely reproduced the transition strength ratios for negative parity yrast band forI=13/2 toI=17/2. The calculatedB(M1)/B(E2) values show a slow decrease with spin fromI=13/2 toI=33/2 thereby, showing no abrupt change in the structure of yrast negative parity bands.
-
In case of135Sm, the experimental data on electromagnetic transition probabilities are not available. The values forB(M1)/B(E2) ratios have been predicted for yrast positive parity band and are presented inTable 2(b). The calculatedB(M1)/B(E2) ratios show a decrease in their values from spinI=11/2 to 13/2 and after that these values are nearly constant up to spinI=21/2. At spinI=29/2, these values show an increase due to the change in structure of the yrast positive parity band after the band crossing region.
The comparison of calculated and experimentalB(M1)/B(E2) ratios for137Sm is presented inTable 2(c). The negative parity band which is a ground state yrast band, in this nucleus has two sets of experimental data [6,8] onB(M1)/B(E2) ratios up to spinI=21/2. The observed trend ofB(M1)/B(E2) ratios of Ref. [8] is reasonably reproduced by the present calculation except at the spinI=19/2−as can be seen in theTable 2(c). The increase in theB(M1)/B(E2) values at the spinI=19/2−is not reproduced by the present calculation. The predicted values ofB(M1)/B(E2) show a sharp decrease at spinI=27/2 and then an increase at spinI=29/2, which can be attributed to the alignment of protons in the down sloppingK-components of π(h11/2)2orbitals.
-
From the foregoing discussion of the calculated results and their comparison with the experimental data, the following broad conclusions can be drawn:
In133Sm all the seven experimentally known bands have been studied. The PSM calculations successfully give a deeper understanding of the mechanism of the formation of yrast and excited state bands from the single and multi-quasiparticle configurations. The positive parity ground state band based on configuration 1ν5/2+[413] (2d5/2), band spectra (both signature partners – bands 1 and 2) and crossing frequencies for133Sm are successfully reproduced. The present calculations have found (h11/2)2proton crossing at frequency (~0.400 MeV) which is an indication of structural change caused by crossing of ground state band by 3-qp bands. Experimentally, it is also observed that there is tentative evidence for the (h11/2)2proton crossing at a frequency (~0.35 MeV). Also, it has been found that the first excited positive parity band is based on configuration 1ν1/2+[400] (2d3/2), which is very much consistent with the experimental observation. The band head energy and band spectra of excited positive parity bands is not confirmed experimentally. The present calculations predict the band head energy of band 3 as 0.226 MeV with respect to band 1. The transition energies of bands 3 and 4 at lower spins are fairly reproduced by the present calculations.
Further, it has been found that 1-qp neutron band built onK=7/2 and having configuration [523]7/2−(h11/2) is lowest in energy out of all other negative parity bands, which is very much consistent with the experimentally observed band head spin and configuration assigned to this band. The band spectra and band head spin of bands represented by 5 and 6 (signature partners of 1ν1h
11/2) are not confirmed experimentally. However, the present calculations predict the band head energy of band 5 as 0.179 MeV with respect to positive parity band 1. The present calculations are successful in reproducingE2 transitions of bands 5 and 6 and dipole transitionsM1 connecting these two bands. The decoupled band 7 in133Sm has been assigned [541]1/2−(h9/2) configuration experimentally. The present calculation predicts band 7 as arising from 1ν1/2−[541] (2f7/2) configuration. The relative band head energy of this band with respect to yrast negative parity band 5 is predicted as 0.444 MeV. The present calculations reproduced the availableE2 transitions for this decoupled band. The decrease in calculatedE2 transitions at higher spin may be due to crossing by 3-qp bands around spin 37/2−. For the reliability of wave functions, we have calculated the electromagnetic transition strength ratios for positive and negative parity yrast bands of133Sm. From the results, it is found that the calculatedB(M1)/B(E2) reflect a decrease in their values around the band crossing spin 31/2+indicating a change in the structure of bands around this spin. Comparison of calculated transition strength ratiosB(M1)/B(E2) with the available experimental data is good except at the angular momentum state 13/2+. For negative parity yrast band of133Sm the calculatedB(M1)/B(E2) values do not show any significant change up to band crossing spin 33/2. The present calculations have nicely reproduced the transition ratiosB(M1)/B(E2)s for negative parity yrast band except at spinI=11/2 in case of133Sm isotope.
In case of135Sm, 1-qp neutron band built onK=7/2 and having configuration 1ν7/2+[404](1g7/2) is lowest in energy out of all other positive parity bands up to the spinI=23/2+and is consistent with experimentally known band head spin and configuration. The crossing by 3-qp bands at the spin 25/2+causes a significant change in the yrast structure of135Sm. This crossing predicts the occurrence of backbending in the calculated results at the band crossing spinI=25/2+, which is also observed experimentally at the same spin and rotational frequency. TheB(M1)/B(E2) ratios have been predicted for the positive parity yrast ground state band of135Sm. The present calculations in135Sm found the dominant structure of the lowest negative parity band based onK=9/2 state of the neutron 1h11/2orbital up to the spin 13/2−and is consistent with the experimental band head spin and configuration. The calculated results of ΔI=1 transition energies and moment of inertia, for negative parity band 2 reproduces the observed staggering in this band due to the admixture of 1ν1/2−[541] band with lowK=1/2 component in the wavefunction. As the band spectra of135Sm is tentative and not confirmed experimentally, it is not feasible to make precise comments on the agreement of the calculated results with the available experimental data.
The present calculations for negative parity of137Sm predicted that the dominant structure of yrast band up to the spin 15/2−isK=9/2 state of neutronh11/2orbital, which is consistent with the experimental band head spin and configuration. For the positive parity of137Sm, 1-qp neutron band fromK=7/2 state of neutron orbitalg7/2is lowest in energy from all the other positive parity bands. Experimentally, this band is proposed to originate from theK=1/2 state of neutrond3/2orbital. However, reasonably good agreement with the experimental energies for whole of this band supports the predicted configuration 1ν7/2[404](1g7/2) for this band. The present calculations reproduced the band spectra of both positive and negative parity bands. The observed backbending phenomena have been reproduced nicely at the band crossing spins due to the crossing of 1-qp neutron bands by 3-qp bands. The backbending in moment of inertia is predicted to arise due to the alignment of pair of protons in the down sloppingK-components of π(h11/2)2orbitals. For137Sm, the observed trends inB(M1)/B(E2) have been reasonably reproduced except at the spinI=19/2−. The calculated results onB(M1)/B(E2) show the sharp increase in their values at spinI=29/2−due to the alignment of a pair of protons in the π(h11/2)2orbitals.
The present calculations well reproduced the low-spin experimental data on133-137Sm. However, the precise position of spins and rotational frequencies where quasiparticle alignments take place are very sensitive to several calculation conditions. One of them is to select the best Nilsson-single particle states for neutron-deficient nuclei in the mass regionA~130-140. The Nilsson single particle states in the present work are obtained by using the standard Nilsson parameters of Ref. [23] without any adjustment. The agreement with the experimental data may be improved further by directly modifying the Nilsson parameters for the neutron-deficientA~130-140 mass range as discussed in Ref. [31] for proton-rich nuclei in the upper pf shell.
We are thankful to Professor Y. Sun for his collaborations.
Microscopic study of electromagnetic properties and band spectra of neutron deficient133,135,137Sm
- Received Date:2019-03-18
- Accepted Date:2019-09-24
- Available Online:2019-12-01
Abstract:A microscopic high spin study of neutron deficient and normally deformed133,135,137Sm has been carried out in projected shell model framework. The theoretical results have been obtained for the spins, parities and energy values of yrast and excited bands. Besides this, the band spectra, band head energies, moment of inertia and electromagnetic transition strengths are also predicted in these isotopes. The calculations successfully give a deeper understanding of the mechanism of the formation of yrast and excited bands from the single and multi-quasi particle configurations. The results on moment of inertia predict an alignment of a pair of protons in the proton (1h11/2)2orbitals in the yrast ground state bands of133-137Sm due to the crossing of one quasiparticle bands by multi-quasiparticle bands at higher spins. The discussion in the present work is based on the deformed single particle scheme. Any future experimental confirmation or refutation of our predictions will be a valuable information which can help to understand the deformed single particle structure in these odd mass neutron deficient133-137Sm.


 DownLoad: