


 Abstract
 HTML
HTML Reference
 Related
 PDF
PDF


-
The nuclear mass (binding energy) is one of the most important topics in nuclear physics and astrophysics. In the semi-empirical mass formula based on the liquid drop model, the binding energy
$ B(A,Z) $ of a nucleus is the sum of the volume, surface, Coulomb, symmetry, and pairing terms, which can be expressed as a function of the mass numberAand charge numberZ[1,2],$ B(A,Z) = a_{\rm v}A-a_{\rm s}A^{2/3}-a_{\rm C}\frac{Z^{2}}{A^{1/3}}-a_{\rm sym}\frac{(N-Z)^{2}}{A}+a_{\rm p}A^{-1/2}, $

(1) where
$a _{\rm v} $ ,$ a_{\rm s} $ ,$a _{\rm C} $ ,$ a_{\rm sym} $ , and$a _{\rm p} $ are the volume, surface, Coulomb, symmetry, and pairing energy coefficients, respectively. The coefficients are obtained by fitting to experimentally measured binding energies of nuclei. In contrast, the nuclear mass is usually indicated by the mass excess (nuclide mass minus the mass number in atomic mass units). The mass excess of the isobaric nuclei can be expressed as a parabola, as a function of the atomic numberZwith a high degree of precision, referred to as the Bohr-Wheeler parabola [3]. In Ref. [4], the nuclide mass equation is expressed as$ M(A,Z) = M(A,Z_{A})+\frac{1}{2}b_{A}(Z-Z_{A})^{2}+P_{A}-S(N,Z), $

(2) whereMis the mass excess of nucleus (A,Z) in MeV, andZandAare the atomic and mass numbers of the nucleus.
$ M(A,Z_{A}) $ is described as the minimum of the mass excess parabola, where$ Z_{A} $ is a parameter and not the atomic number of an existing nuclei.$ b_{A} $ is the curvature parameter of the isobaric mass parabola,$ P_{A} $ is the pairing energy due to the odd-even variation, and$ S(N,Z) $ is the shell correction term. In the textbook [5], the relation between the nuclear mass excess and the binding energy is written as$ B(A,Z) = 931.4943\times(0.008665A-0.00084Z)-M(A,Z), $

(3) where 0.008665 is the mass excess of the neutron, and 0.00084 is the hydrogen-neutron mass difference in atomic mass units. One atomic mass unit is equivalent to 931.4943 MeV. The question is, hence, whether the Coulomb energy coefficient and the symmetry energy coefficient in the binding energy formula can be expressed by parabolic parameters
$ Z_{A} $ and$ b_{A} $ .There are two ways to obtain the parameters
$ Z_{A} $ and$ b_{A} $ . One is by fitting the experimentally measured mass excess of isobaric nuclei with Eq.(2). The other is by fitting by measuredβ-decay energies of isobaric nuclei with Eq.(4). The first method requires that four parameters$ Z_{A} $ ,$ b_{A} $ ,$ M(A,Z_{A}) $ , and$ P_{A} $ are determined by a parabola fit, while the second requires that three parameters$ Z_{A} $ ,$ b_{A} $ , and$ P_{A} $ are determined by fitting the$ \beta $ -decay energies. Isobaric analyses of$ \beta $ -decay energies were conducted by several authors [3,6,7], where the early work was based on scanty experimental data. In Ref. [3], Bohr and Wheeler employed the least-squares method to determine the parameters of the mass parabola,$ Z_{A} $ ,$ b_{A} $ , and$ P_{A} $ , for 20Avalues by a parabola fit of the isobaric mass excess. In Ref. [6], J. W. Dewdney analyzed the isobaric$ \beta $ -decay energies and used the least-squares method to determine the parameters of the mass parabola for 157Avalues. The experimental data were taken from Refs. [8,9]. Later, X.Y. Li and co-workers [7] updated the three parameters of the isobaric mass parabola for 234Avalues ($ 10\leqslant A\leqslant 253 $ ) in the same manner as Dewdney, however they adopted a different mass table AME1977 [10] including about 1000 nuclides. In the recent decades, with the development of scientific instruments and the progress of technology, a large number of unstable nuclei could be produced, and their masses could be measured with high precision. The experimental information or recommended values for nuclear and decay properties of 3437 nuclides are compiled in the mass table AME2016 [11]. The number and precision of nuclear masses in AME2016 have been considerably increased in comparison with the results compiled in the AME1977 database [10]. The available data sets are presently significantly larger, and it is possible to analyze them statistically.Double
$ \beta $ -decay is a popular topic. It is a rare transition between two nuclei with the same mass number, which changes the nuclear charge number by two units,$ (A, Z) \rightarrow (A, Z\pm2) $ , and has been observed in many nuclei [12,13]. The energy released in the double$ \beta $ -decay exhibits even a greater regularity than the single$ \beta $ -decay, as shown in Ref. [14]. However, detailed studies of the mass parabola have not been performed using the total double$ \beta $ -decay energies. In this study, we propose a simple empirical formula to obtain the parameters$ Z_{A} $ and$ b_{A} $ . The relation between the Coulomb energy coefficient and the symmetry energy coefficient in terms of$ Z_{A} $ and$ b_{A} $ is then presented. We use more than 2400 total double$ \beta $ -decay energies, which are complied in the AME2016 database, to analyze the properties of the Bohr-Wheeler isobaric mass parabola in all modes of double$ \beta $ -decay employing a theoretical method. The advantage of this approach is that there are only two parameters in the expression for the double$ \beta $ -decay energies, as the pairing energy$ P_{A} $ and the mass excess$ M(A,Z_{A}) $ are removed by the mass difference between$ (A, Z) $ and$ (A, Z\pm2) $ . Furthermore, the overall simplicity of the double$ \beta $ -decay energy pattern may point to a convenient empirical mass formula. -
TheQvalue is defined as the total energy released in a given nuclear reaction. TheQvalue of
$ \beta $ -decay is calculated by the mass difference between the two nuclei$ (A, Z) $ and$ (A, Z+1) $ , while the expressions for$ \beta $ -decay energies may be derived from the empirical mass Eq. (2), when the shell correction is neglected. According to Eq.(2), the$ \beta $ -decay energy is directly proportional to$ Z-Z_{A} $ . For oddAisobars, there is only one isobaric mass parabola, since the pairing energy term is equal to zero, and the$ \beta $ -decay energies plotted versusZlie on a single straight line. However, for evenAisobars, due to the extra stability associated with pairs of similar nucleons, two isobaric mass parabolas with the same shape are obtained, but they are displaced one below the other. The lower parabola contains even-even nuclides, while odd-odd nuclides lie on the upper parabola. Consequently, the$ \beta $ -decay energies plotted versusZdo not lie on a single straight line, but on a pair of parallel straight lines. For negative$ \beta $ -decay and positive$ \beta $ -decay (or electron capture), one can combine them into one universal expression$ Q_{\beta} = M(A,Z)-M(A,Z+1) = -b_{A}\left(Z-Z_{A}+\frac{1}{2}\right)+\Delta E. $

(4) The reaction will proceed only when theQvalue is positive: "
$ Q_{\beta}>0 $ " for$ \beta^{-} $ -decay occurs when the mass of atom$ M(A, Z) $ is greater than the mass of atom$ M(A, Z+1) $ ; "$ Q_{\beta}<0 $ " for$ \beta^{+} $ -decay occurs when the mass of atom$ M(A, Z+1) $ is greater than that of$ M(A, Z) $ . For even-even nuclides$ \Delta E = 2P_{A} $ , for odd-odd nuclides$ \Delta E = -2P_{A} $ , and for odd-Anuclides (i.e., even-odd and odd-even)$ \Delta E = 0 $ .Our aim in this study is to propose a very simple empirical formula that only depends on the basic mass parabolic parameters
$ Z_{A} $ and$ b_{A} $ . We employ the total double$ \beta $ -decay energy to analyze the mass parabola rather than the total single$ \beta $ -decay energy. The parameters$ M (A,Z_{A}) $ and$ \Delta E $ are removed by the mass difference between$ (A, Z) $ and$ (A, Z + 2) $ . We obtain a universal expression for the total double$ \beta $ -decay energy in the same manner as above,$ Q_{2\beta} = M(A,Z)-M(A,Z+2) = -2b_{A}(Z-Z_{A}+1), $

(5) where “
$ Q_{2\beta}>0 $ ” for$ \beta^{-}\beta^{-} $ , and “$ Q_{2\beta}<0 $ ” for$ \beta^{+}\beta^{+} $ . The nucleus$ (Z,A) $ will be called the decay nucleus, no matter whether the decay actually proceeds from$ (A, Z) $ to$ (A, Z + 2) $ or vice versa. The total double$ \beta $ -decay energies lie on the same lines for odd-odd and even-even nuclei for even-Avalues, and for adjacent odd-Aand even-Avalues, they lie approximately on the same lines. -
We employ the three Eqs. (2), (4), and (5) to analyze the corresponding experimental data, i.e., the mass excess, total
$ \beta $ -decay energies, and total double$ \beta $ -decay energies. The parameters$ Z_{A} $ and$ b_{A} $ in the isobaric mass parabola are obtained using the least-squares fitting procedure. The calculated results are compared, and they are found to be almost identical for three different methods of fitting the corresponding experimental data.The first equation Eq.(2) requires at least three parameters,
$ Z_{A} $ ,$ b_{A} $ , and$ M (A,Z_{A}) $ , to fit the experimental mass excess for odd-Anuclei. Here,$ P_{A} $ = 0 is assumed, based on the values of$ P_{A} <0.3 $ MeV for odd-Anuclei, presented in Ref. [6]. For even-Anuclei, an isobaric slice through the mass surface tends to yield two parabolas of the same shape, but they are displaced one below the other. Even nuclides lie on the lower parabola, while the odd nuclides lie on the upper parabola. Hence, it is necessary to unify the parameters$ Z_{A} $ and$ b_{A} $ for even-even and odd-odd nuclei,$ b_{A} = 0.5(b^{\rm o-o}_{A}+b^{\rm e-e}_{A}) $ and$ Z_{A} = 0.5(Z_{A}^{\rm o-o}+Z_{A}^{\rm e-e}) $ , where$ b^{\rm e-e}_{A} $ and$ Z_{A}^{\rm e-e} $ are for even-even nuclei, and$ b^{\rm o-o}_{A} $ and$ Z_{A}^{\rm o-o} $ for odd-odd nuclei. Finally, the value of$ \Delta E $ is obtained from the difference$ \Delta E = M^{\rm o-o}(A,Z_{A})-M^{\rm e-e}(A,Z_{A}) $ . For Eq. (4), the procedure is similar to that for Eq. (2), and the value of$ \Delta E $ equals to half of the difference between the two intercepts of a pair of parallel lines.To construct the formula for
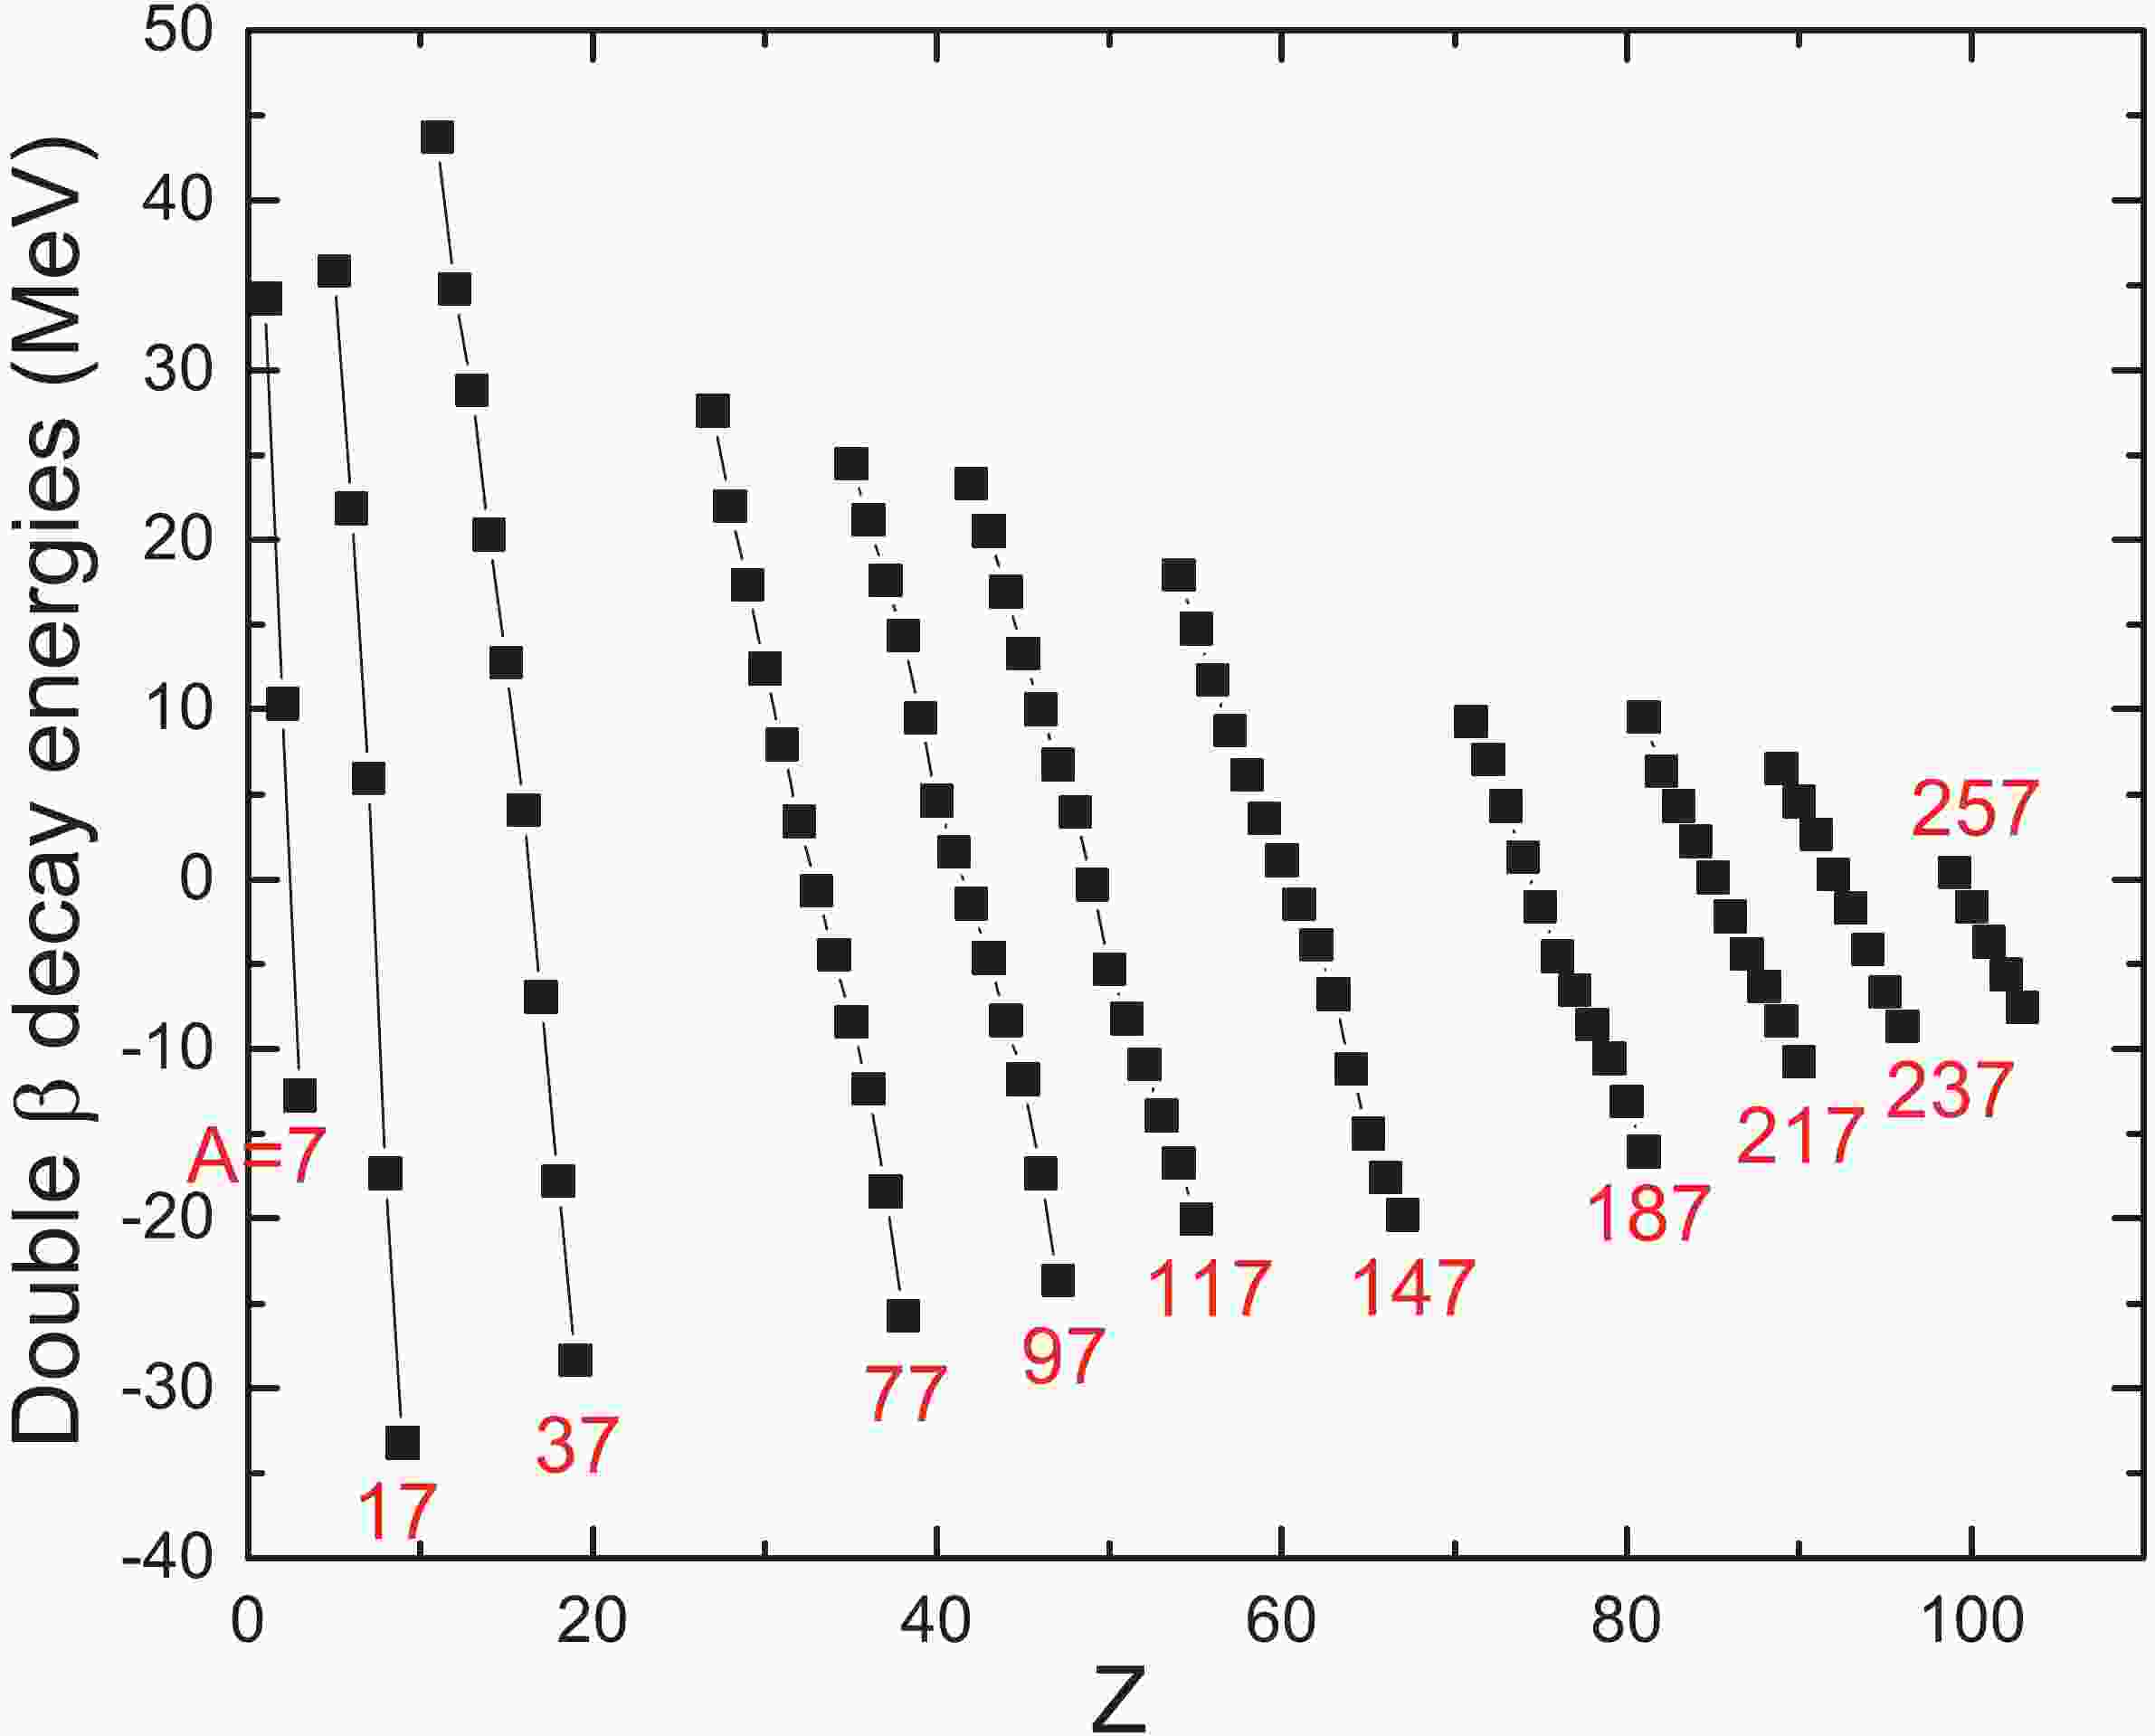
$ Q_{2\beta} $ , we start by plotting the total double$ \beta $ -decay energy$ Q_{2\beta} $ versus the charge numberZfor 11 odd-Anuclei$ 7\leqslant A\leqslant 257 $ inFig. 1. The experimental data for$ Q_{2\beta} $ are taken from AME2016 [11]. The straight line relations in this plot are clearly distinguishable, and the slopes$ 2b_{A} $ of these lines exhibit the general trend that$ Q_{2\beta} $ decreases slightly with increasing mass numberA. A similar linear relation is also shown for even-Avalues inFig. 2.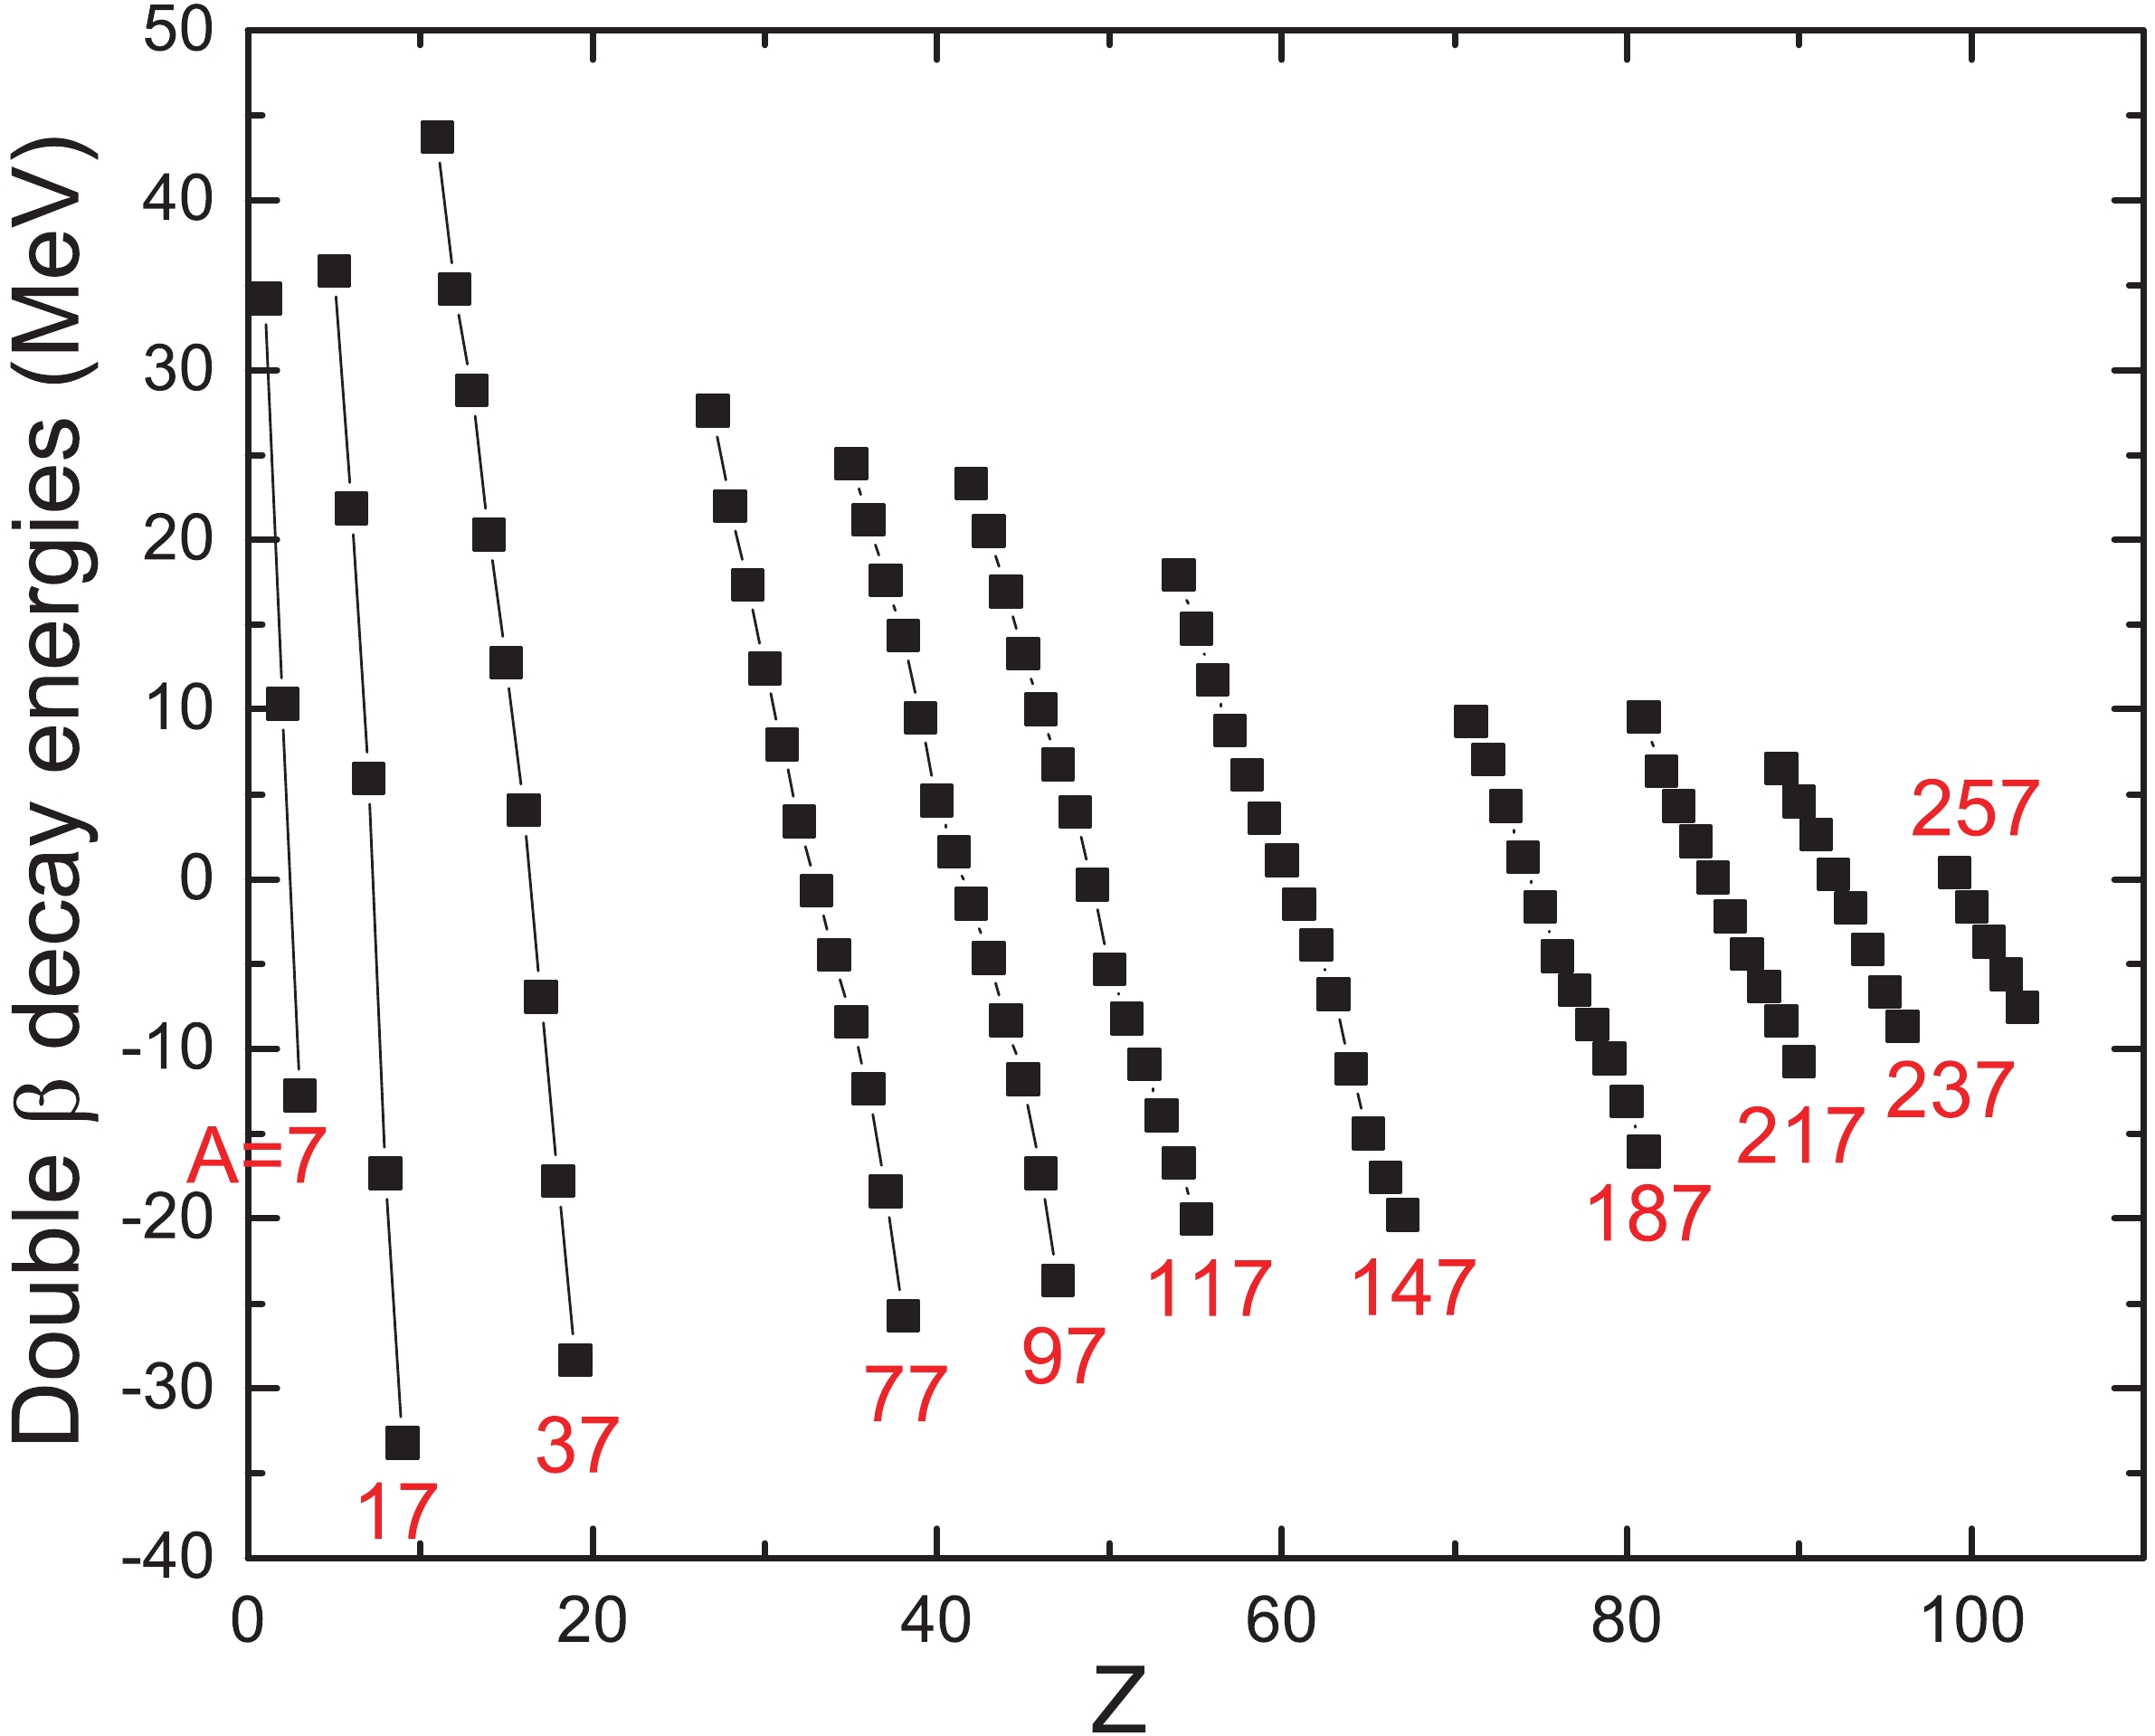
Figure 1.(color online) The total double
$ \beta $ -decay energy$ Q_{2\beta} $ as a function of charge numberZfor 11 odd-Avalues ($ 7\leqslant A\leqslant 257 $ ). The experimental data are taken from AME2016 [11]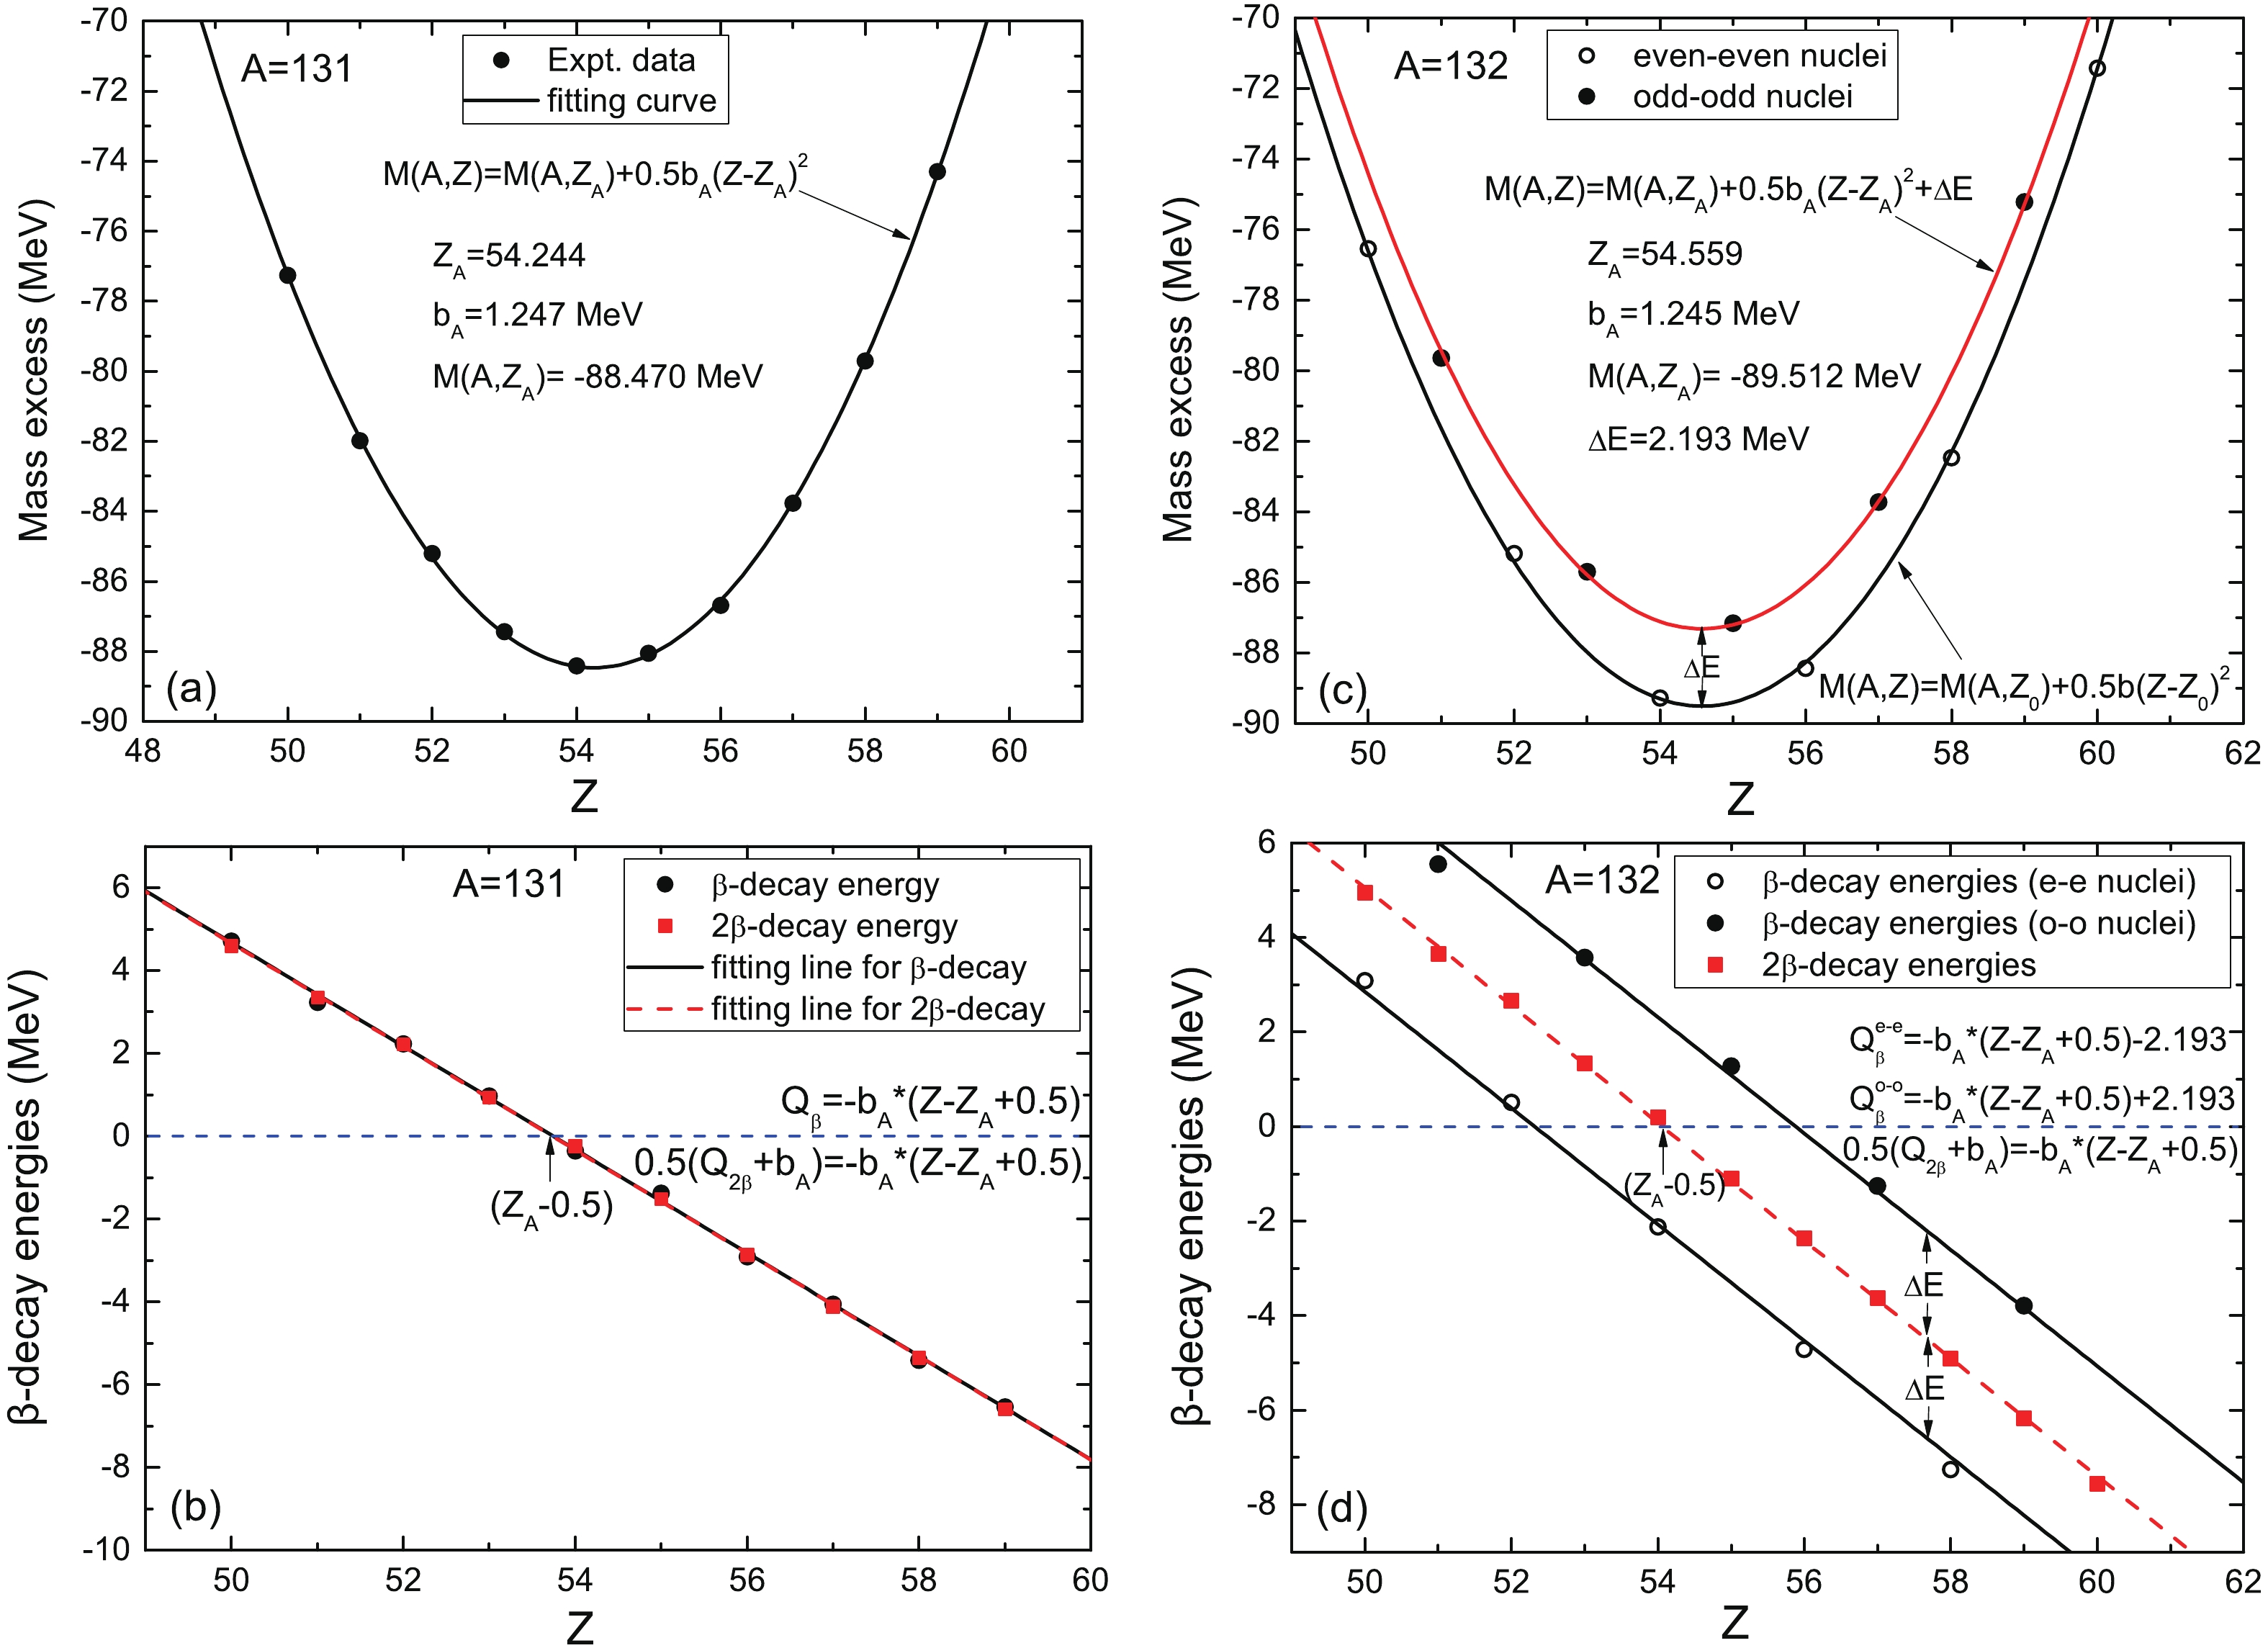
Figure 2.(color online) Two examples of the experimental data and their treatment. Mass excess (a),
$ \beta $ -decay energy (b) as a function of the charge numberZ, and the fitted curves for$ A = 131 $ . (c) and (d) are the same as (a) and (b) for$ A = 132 $ . Solid curves inFig. 2 (a)and(c)denote the results of fitting the experimental mass excess with Eq. (2). Solid lines inFig. 2 (b)and(d)denote the results of fitting the experimental data$ Q_{\beta} $ with Eq. (4), and dashed lines inFig. 2 (b)and(d)denote the results of fitting the experimental data$ Q_{2\beta} $ with Eq. (5).Figure 2shows two examples of the treatment of experimental data for
$ A = 131 $ and$ A = 132 $ as a function of the nuclear charge numberZ.Figure 2 (a)is a plot of the experimental isobaric mass parabola forA= 131. The mass parabola is related to the$ \beta $ and$ 2\beta $ -decay energies shown in the plot below (b). The intercept$ Z_{A} $ on the$ \beta $ -decay energy plot corresponds to the minimum of the mass parabola. The slope$ b_{A} $ of the$ \beta $ -decay energy plot is a measure of the steepness of the mass parabola. The red dashed lines inFig. 2 (b)and(d)denote the results of fitting the experimental data for$ Q_{2\beta} $ by Eq. (5).Figure 2 (c)and(d)are similar plots forA= 132.Figure 2 (c)shows that the mass excess lies alternately on a pair of parabolas of identical shape. The parabola for even masses is below the odd-mass parabola by$ \Delta E $ . This implies that the$ \beta $ -decay points lie on a pair of parallel straight lines, while the double$ \beta $ -decay points lie on a single straight line for both odd-Aand even-A.Figure 3presents the mass parabolic parameters
$ Z_{A} $ (a),$ b_{A} $ (b), and$ \Delta E $ (c) as a function of the nuclear mass numberA. The values of$ Z_{A} $ and$ b_{A} $ obtained by the aforementioned procedure are shown inFig. 3 (a)and(b)with blue solid curves using Eq. (5).$ \Delta E $ is depicted with blue open circles inFig. 3 (c)calculated with Eq.(4). The solid curve$ \Delta E = 2P_{A} $ is the result of a fit of the$ \beta $ -decay energy, and the pairing energy term$ P_{A} = 11.50\delta/A^{1/2} $ is obtained, where$ \delta $ equals to 0 for odd-A, +1 for even-even and -1 for odd-odd nuclides. The calculated values are compared with the early results of Bohr and Wheeler [3] (solid squares), Dewdney [6] (solid circles) and X.Y.Li [7] (solid triangles). There are currently 358 knownβ-decay stable nuclides [15], plotted inFig. 3 (a)with open circles. We found a very good agreement between our results and those obtained previously in Refs. [6,7], except for a fewAvalues ($ Z_{A} $ parameter forA= 111, and$ b_{A} $ parameter forA= 144). We presume that our results for these cases are more robust, because the discontinuities occur only for the two A values shown inFig. 3. Our results indicate that$ Z_{A} $ = 47.7566 and$ b_{A} $ = 1.7955 forA= 111, and$ Z_{A} $ = 59.9768 and$ b_{A} $ = 1.5102 forA= 144.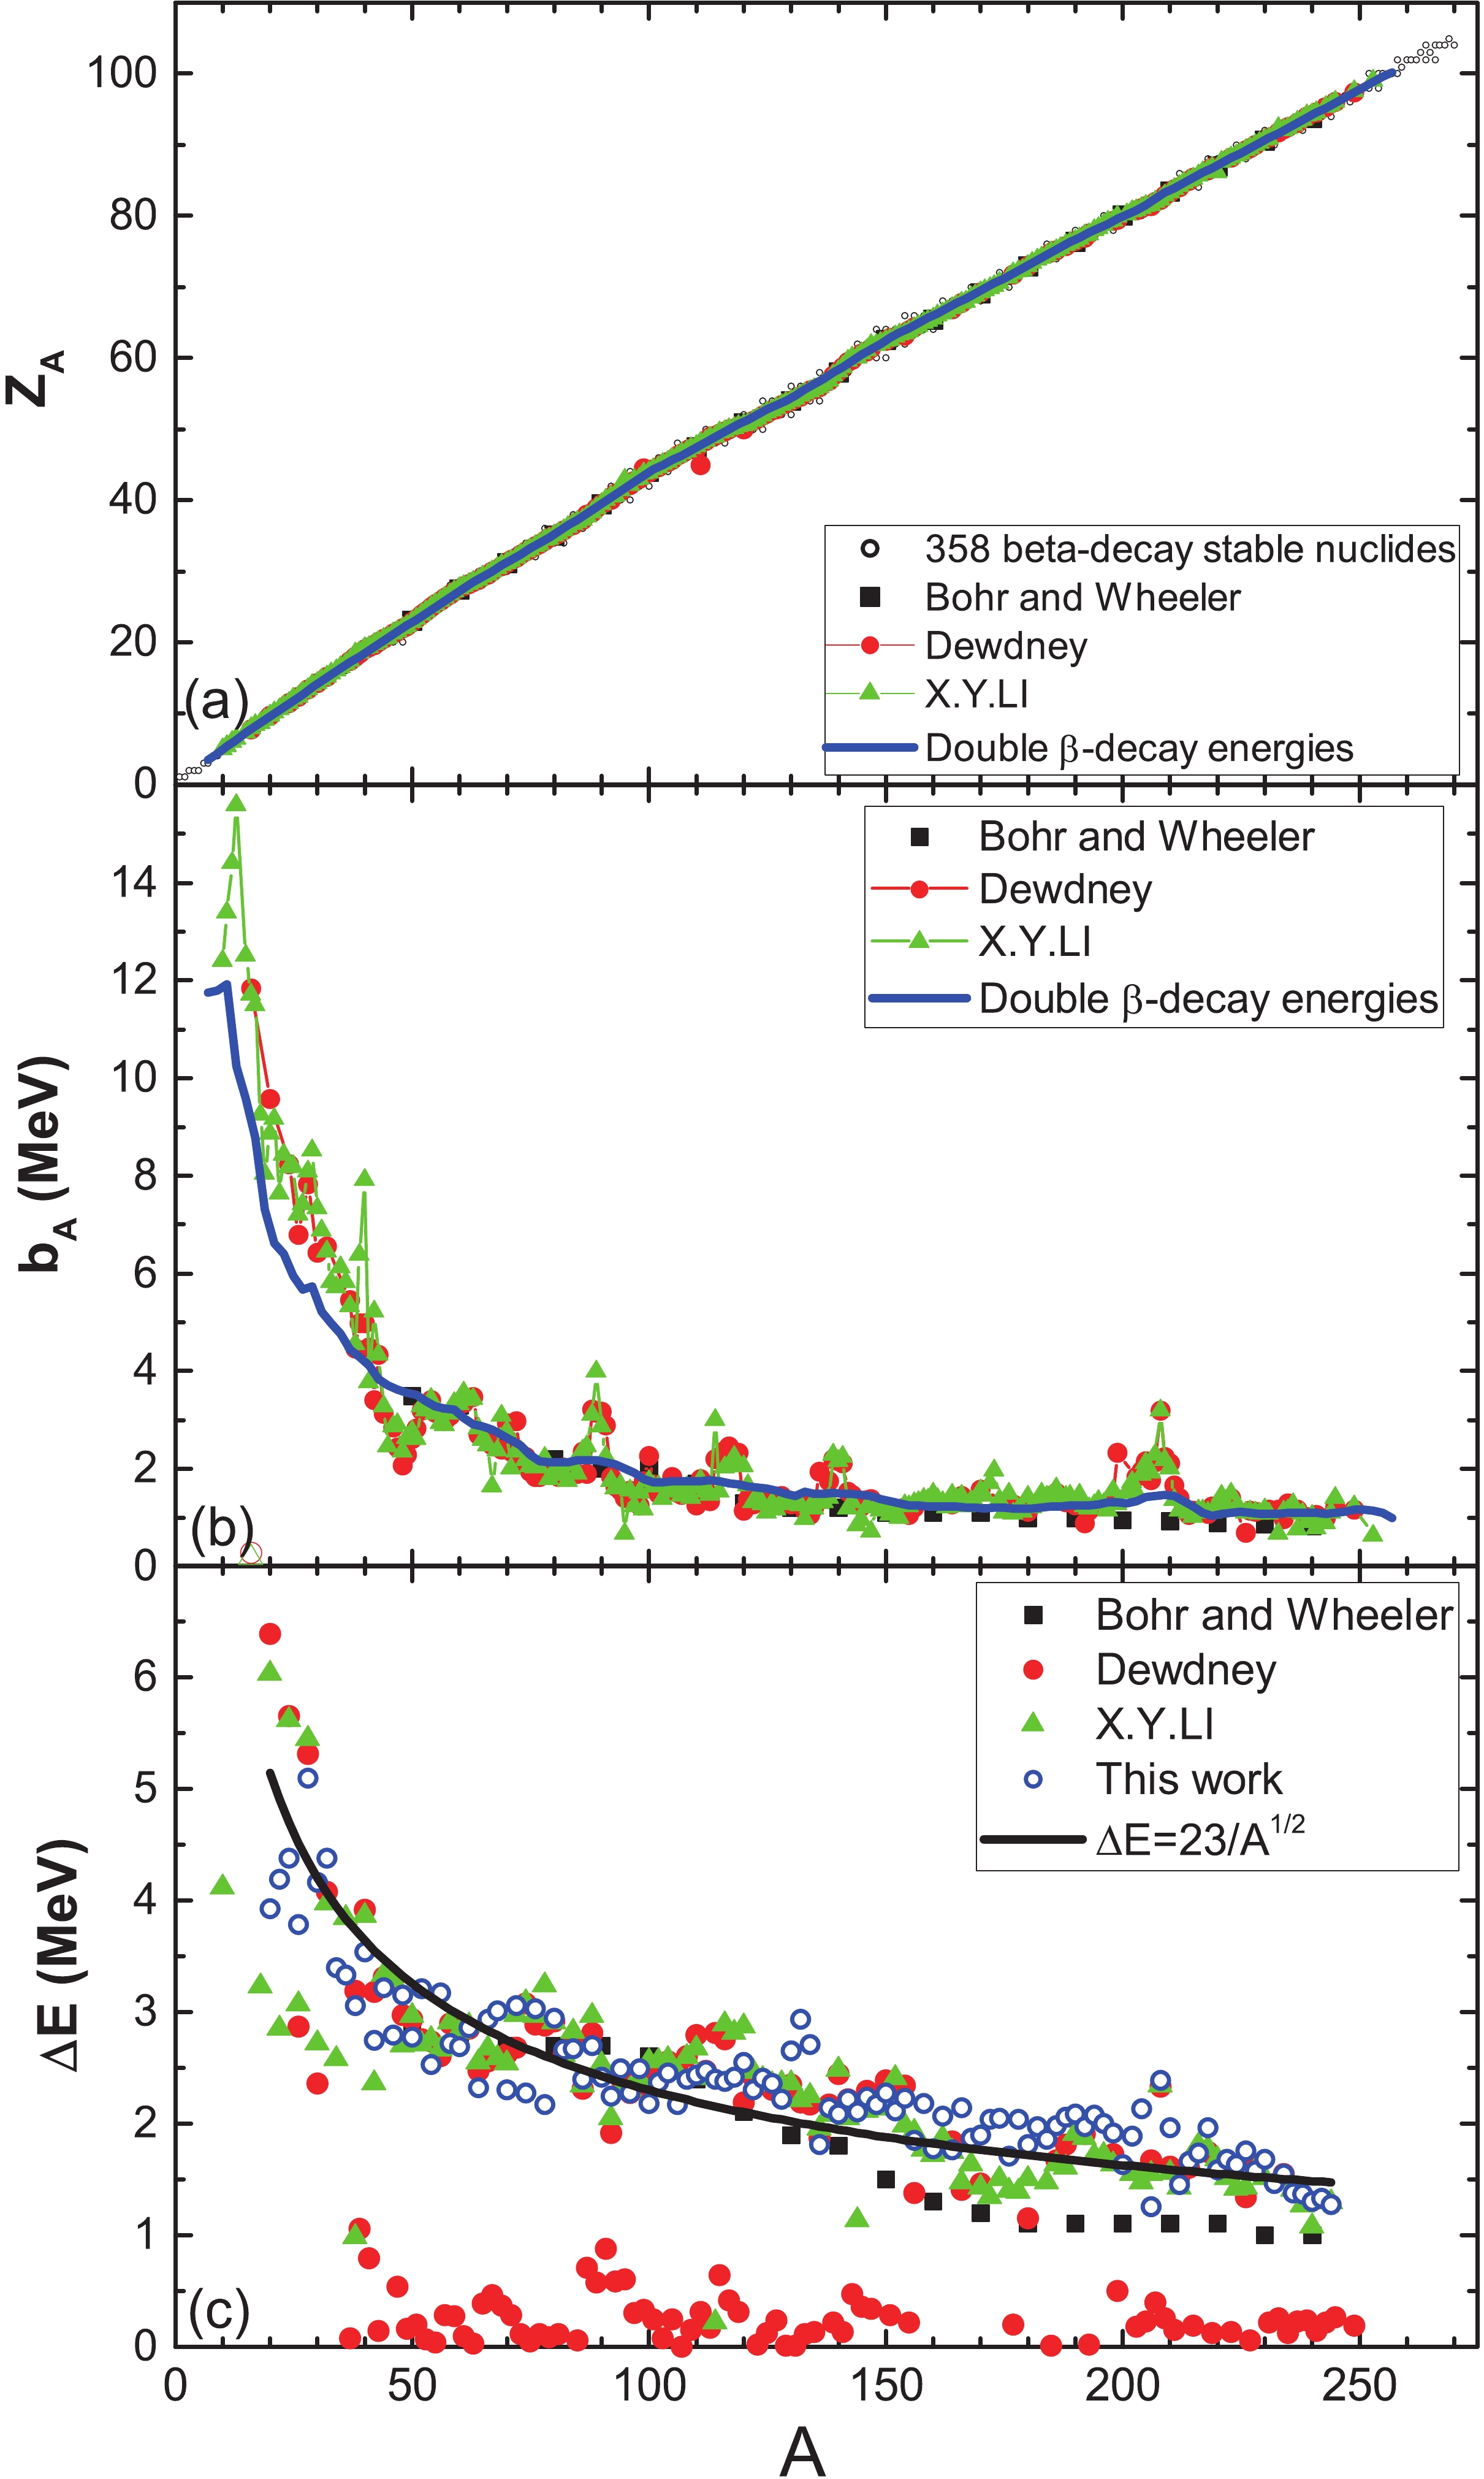
Figure 3.(color online) The mass parabola parameters
$ Z_{A} $ (a),$ b_{A} $ (b), and$ \Delta E $ (c) as a function of the nuclear mass numberA. The calculated values (blue solid curves) are compared with early results of Bohr and Wheeler [3] (solid squares), Dewdney [6] (solid circles) and X.Y. Li [7] (solid triangles). Black solid curve in (c) is the pairing energy term$ \Delta E = 2P_{A} $ , which is obtained by fitting the$ \beta $ -decay energies. -
The Coulomb energy coefficient
$ a_{\rm C} $ can be determined from the mass relation for mirror nuclei. On the one hand, due to the charge independence of the nuclear force, the binding energies of mirror pairs differ only in their Coulomb energy. The Coulomb energy difference between a pair of mirror nuclei is proportional to$ Y = N-Z $ [16,17],$ -\Delta B = E_{\rm C}\left[A,\frac{1}{2}(A+Y)\right]-E_{\rm C}\left[A,\frac{1}{2}(A-Y)\right] = b_{c}Y, $

(6) where
$ b_{c} $ is the proportionality coefficient, which indeed depends onA.On the other hand, the mass relations for mirror nuclei can be obtained from Eq. (2). First, one needs to express the charge numberZwith the mass numberA, i.e.,
$ Z = \frac{1}{2}(A\pm Y) $ for a pair of mirror nuclei. Then, the difference of mass excess for a pair of mirror nuclei for both odd and evenAwith different$ Y = 1, 2, 3,... $ reads$\begin{split} \Delta M =& M\left[A,\frac{1}{2}(A+Y)\right]-M\left[A,\frac{1}{2}(A-Y)\right] \\=& \frac{1}{2}b_{A}(A-2Z_{A})Y. \end{split}$

(7) Combining the three Eqs. (3), (6), and (7), and taking the hydrogen-neutron mass difference
$ \Delta_{(^{1}H-n)} =$ $ -0.7825 $ MeV, we obtain$ \frac{\Delta M}{Y} = b_{c} = \frac{1}{2}b_{A}(A-2Z_{A})-\Delta_{(^{1}H-n)}. $

(8) This result is consistent with those in Refs. [18,19]. Our results are presented inFig. 4, where the mass difference of 95 pairs of mirror nuclei, scaled by the charge differenceY, are plotted against
$ A^{2/3} $ , and are seen to lie on a straight line. The value ofYranges from 1 (32 cases) to 6 (1 case). The solid and dashed curves denote the results with and without the shell correction energies, respectively. The shell correction energies are taken from Ref. [20]. The thick solid curve shows some oscillations and fluctuations due to the shell effect. When the shell corrections are taken into account, the fluctuations of the extracted$ b_{c} $ are effectively reduced. The thin solid line represents the straight line fit. We obtain$ b_{c} = 0.691A^{2/3}-0.8724 $ MeV by fitting the left hand of Eq. (8) for 251Avalues, with an rms deviation of 0.384 MeV, which is the error associated with this method of determining$ a_{\rm C} $ andc, and it is smaller than in Ref. [18]. The intercept at 0.8724 is the contribution of the Coulomb exchange term and the nuclear surface diffuseness correction term. If we assume the Coulomb energy expression$ E_{\rm C} = \dfrac{a_{\rm C}Z^{2}}{A^{1/3}}(1-cZ^{-2/3}) $ , in which the contribution of the Coulomb exchange term is taken into account, we obtain$ a_{\rm C} = 0.691 $ MeV and$ c = 1.1914 $ MeV. The mirror-nuclide method can be extended to include all values ofAin Eq. (8), although mirror nuclides are observed for$ A \leqslant 75 $ . The availability of the Coulomb energy coefficients for the complete range ofAvalues should be helpful in studies addressing the variation of the Coulomb energy with the mass number.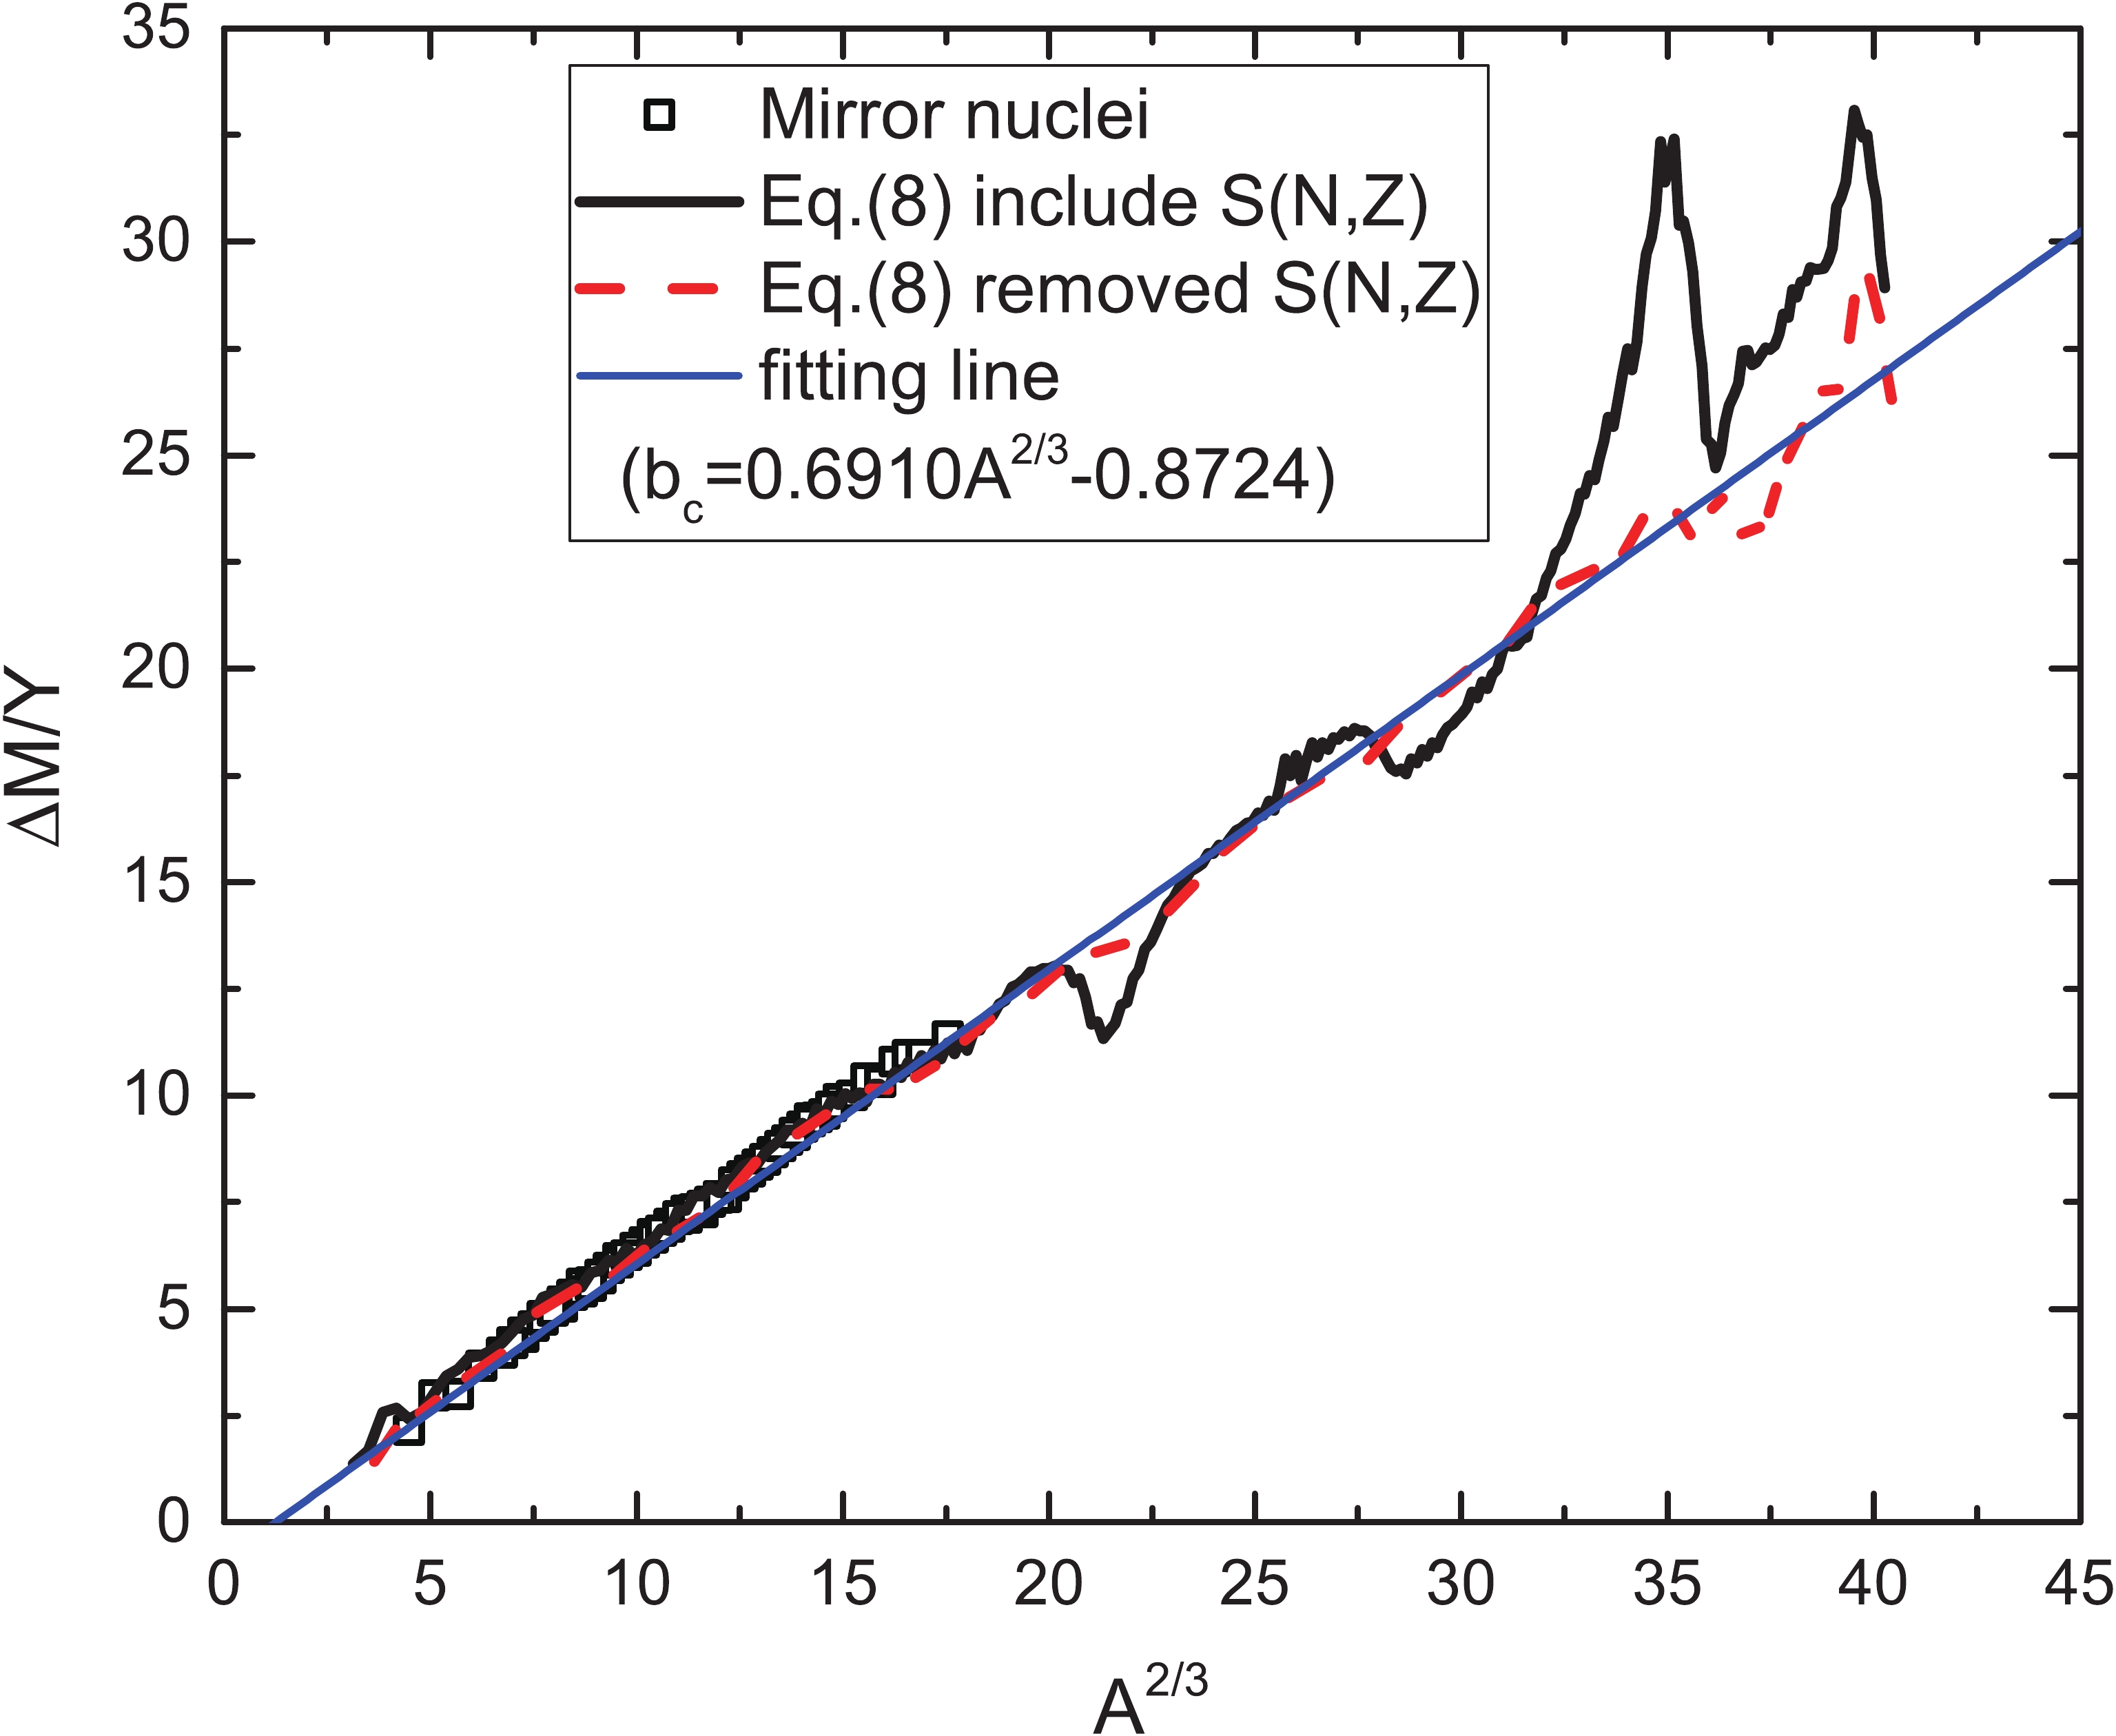
Figure 4.(color online) Scaled mass difference (solid squares) of 95 pairs of mirror nuclei in the region 11
$ \leqslant A\leqslant $ 75 as a function of$ A^{2/3} $ . Solid and dashed curves represent the left-hand side of Eq.(8) with and without the shell correction energies, respectively, which are taken from Ref. [20]. Thin solid line represents the straight line fit. -
The symmetry energy coefficient plays an important role in nuclear physics and astrophysics. In this study, the symmetry energy coefficient
$ a_{\rm sym} $ is deduced and expressed by the two parameters$ Z_{A} $ and$ b_{A} $ . First, we insert Eqs. (1) and (3) into the expression (5) and take theQvalue of the double$ \beta $ -decay of the mother nuclide (A,Z-1), to obtain$\begin{split} Q_{2\beta}(A,Z-1) =& M(A,Z-1)-M(A,Z+1)\\ =& B(A,Z+1)-B(A,Z-1)+2\Delta_{(^{1}H-n)}\\ =& -\left(\frac{16a_{\rm sym}}{A}+\frac{4a_{c}}{A^{1/3}}\right)Z+8a_{\rm sym}+1.5649. \end{split}$

(9) TheQvalue of the double
$ \beta $ -decay of (A,Z-1) in Eq. (5) is written as$ Q_{2\beta}(A,Z-1) = -2b_{A}(Z-Z_{A}), $

(10) then, the symmetry energy coefficient
$ a_{\rm sym} $ is obtained by solving the combination of Eqs. (9) and (10), that is$ a_{\rm sym} = \frac{(2b_{A}Z_{A}-1.5649)}{8}\simeq\frac{b_{A}Z_{A}}{4}. $

(11) There are two forms for describing the mass-dependent symmetry coefficient. One was proposed by Danielewicz and Lee,
$ a_{\rm sym}(A) = S_{0}/(1+\kappa A^{-1/3}) $ [21], where$ S_{0} $ is the volume-symmetry energy coefficient of the nucleus, and$ \kappa $ is the ratio of the surface-symmetry coefficient to the volume-symmetry coefficient. The other form is frequently employed, and it is written as$ a_{\rm sym}(A) = $ $ S_{0}(1-\kappa A^{-1/3}) $ [22–27].Fig. 5shows the symmetry energy coefficient$ a_{\rm sym}(A) $ as a function of A from Eq. (11). The open circles denote the results without the shell corrections. These exhibit some odd-even staggering and fluctuations, which could be caused by the nuclear residual pairing interaction and the nuclear surface diffuseness correction effect. The blue solid curve and the red dashed curve denote the results of two analytic expressions, in which the coefficients are determined by fitting open circles. By performing a two-parameter fit of$ a_{\rm sym}(A) $ , attained previously with the relation Eq. (11), we obtained the values of$ S_{0} $ and$ \kappa $ . Within the 95% confidence interval,$ S_{0} = 26.575\pm0.271 $ and$ \kappa = 0.99\pm0.035 $ , and the corresponding rms deviation is 389 keV, if the mass dependence of the symmetry energy coefficient is$a_{\rm sym}(A) = $ $ S_{0}(1-\kappa A^{-1/3}) $ . By adopting$ a_{\rm sym}(A) = S_{0}/(1+\kappa A^{-1/3}) $ , one obtains$ S_{0} = 30.102\pm0.741 $ MeV and$ \kappa = 2.091\pm0.166 $ with an rms deviation of 398 keV. This result is shown inFig. 5by the red dashed curve. The obtained values of$ S_{0} $ and$ \kappa $ are in agreement with$ S_{0} = (31.1\pm1.7 $ ) MeV and$ \kappa = (2.31\pm038 $ ), given by Min Liu[28].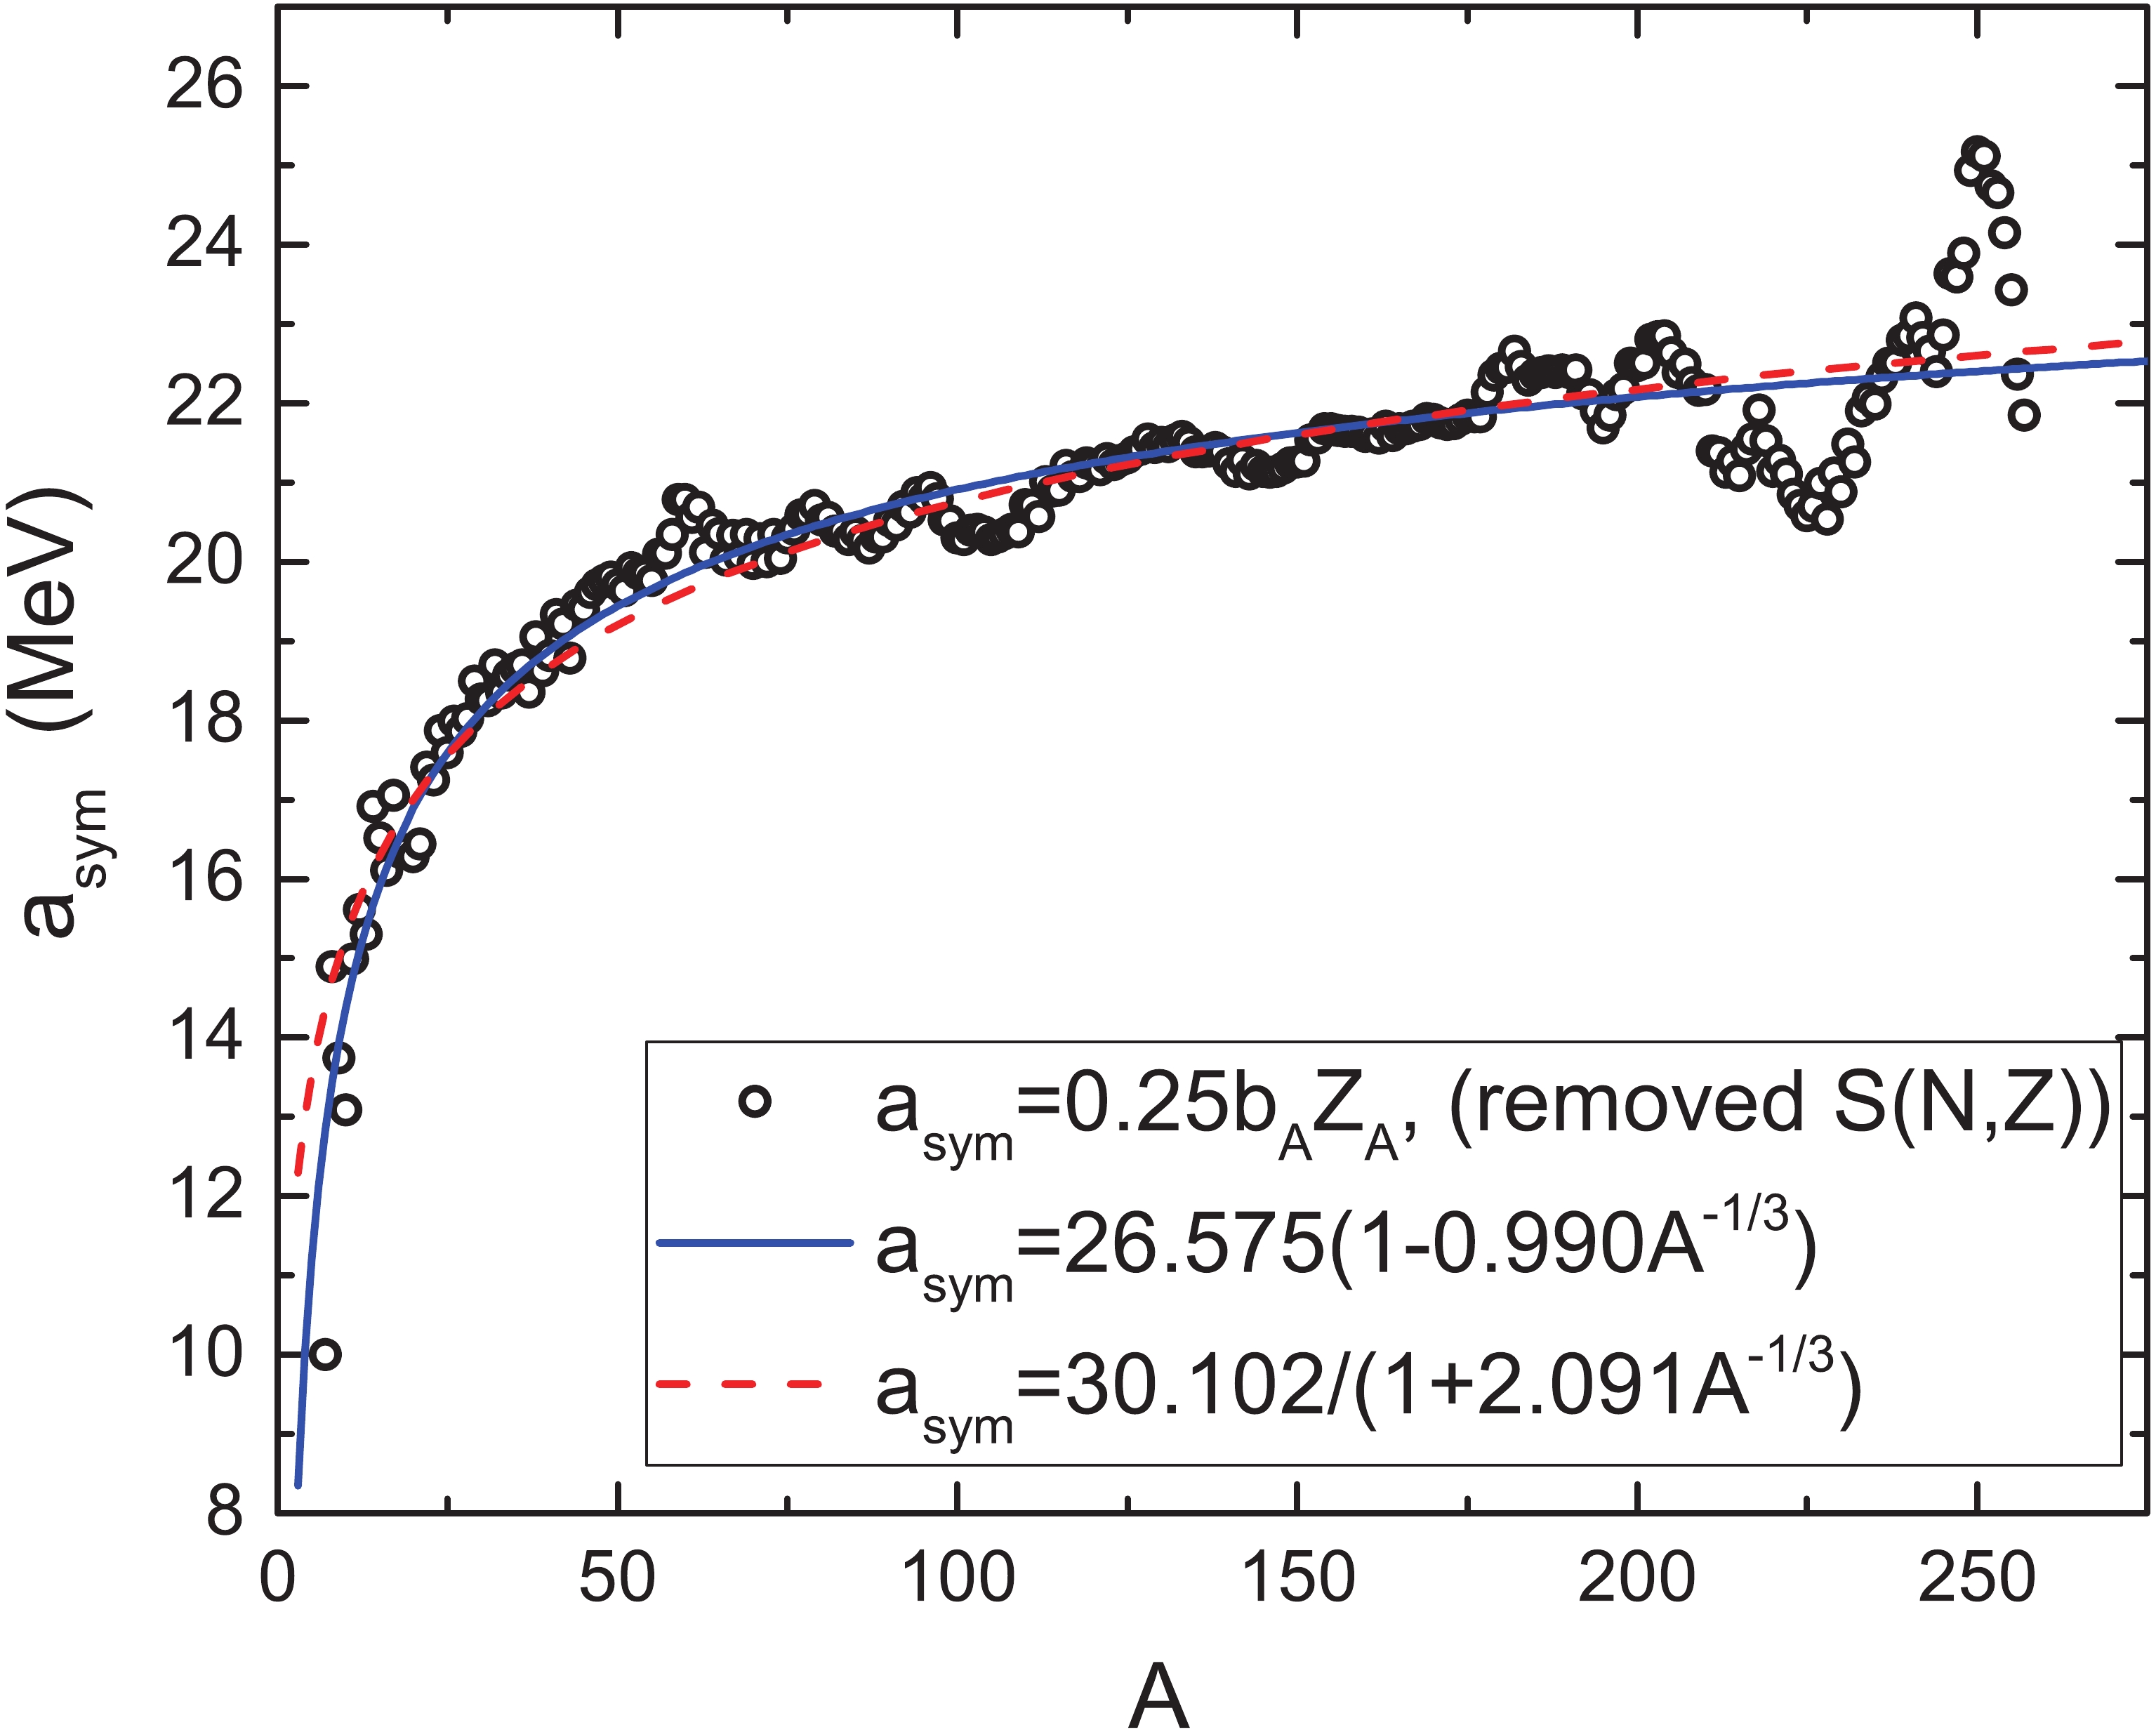
Figure 5.(color online) The symmetry energy coefficient for finite nuclei
$ a_{\rm sym}(A) $ as a function of the mass numberAfrom Eq. (11) (open circles). Shell correctionsS(N,Z) from Ref. [20] are removed from the mass excess of nuclei. Blue solid curve and red dashed curve denote the results of two analytic expressions, in which the coefficients are determined by fitting to the open circles. -
In summary, we proposed a method to determine two important parameters,
$ Z_{A} $ and$ b_{A} $ , in the well-known Bohr-Wheeler mass parabola. The linear relation between the total double$ \beta $ -decay energy and the charge numberZis deduced based on the isobaric mass parabola, which only includes two parameters,$ Z_{A} $ and$ b_{A} $ . The values of these two parameters were obtained by fitting 251Avalues of the experimental total double$ \beta $ -decay energies of nuclei compiled in the AME2016 database. The advantage of this approach is that we could remove the pairing energy term$ P_{A} $ in the process, which causes odd-even variation, as well as the mass excess$ M(A,Z_{A}) $ of the most stable nuclide. The Coulomb energy coefficient$ a_{\rm C} = 0.691 $ MeV was determined from the mass difference relation for mirror nuclei$ 0.5b_{A}(A-2Z_{A}) = \Delta_{(^{1}H-n)}+ $ $a_{\rm C}(A^{2/3}-1.0583c) $ , and$ c = 1.1914 $ MeV. The symmetry energy coefficients in the mass dependence given in the two forms,$ a_{\rm sym}(A) $ ,$ a_{\rm sym}(A) = 30.102/(1+2.091A^{-1/3}) $ , and$ a_{\rm sym}(A) = 26.575(1- $ $0.99A^{-1/3}) $ , were determined by fitting the relation$ a_{\rm sym}(A) = 0.25b_{A}Z_{A} $ . The obtained values of$ S_{0} $ and$ \kappa $ are in agreement with the results in other references. This implies that the proposed method for determining the Coulomb energy coefficient and the symmetry energy coefficient is reliable. Further work is in progress, which includes a comparison of the experimental data and the results of several theoretical mass tables.
Nuclear mass parabola and its applications
- Received Date:2019-08-18
- Available Online:2019-12-01
Abstract:We propose a method for extracting the properties of the isobaric mass parabola based on the total double


 DownLoad: