


 Abstract
 HTML
HTML Reference
 Related
 PDF
PDF


-
The12C+12C fusion reaction at deep sub-barrier energies is a key reaction in massive stars, type Ia supernovae and superbursts [1–3]. Lacking sufficient detection sensitivity, direct measurements are currently limited to
$ E_{\rm c.m.} > $ 2.1 MeV. Theoretical extrapolation is indispensable for determining the reaction rate for astrophysical applications. The coupling effect of the excited states of projectile and target nuclei is important for the prediction of the fusion reaction cross section at energies around and below the Coulomb barrier. Esbensenet al. [4] studied the coupling effect in the12C+12C fusion reaction and pointed out that mutual excitations to the high-lying states of 2$ ^+_1 $ at 4.44 MeV, 0$ ^+_2 $ at 7.654 MeV and 3$ ^-_1 $ at 9.641 MeV of12C play an important role. While the transition from the ground state to 2$ ^+_1 $ is relatively well determined [5], the other transitions to the 0$ ^+_2 $ and 3$ ^-_1 $ states lack sufficient experimental constraints. As the 0$ ^+_2 $ and 3$ ^-_1 $ states decay via the 3αchannel, a direct measurement of the inelastic scattering of12C(12C,3α)12C will provide a useful constraint for studies of fusion reactions around and below the Coulomb barrier. However, the measurement of the12C(12C,3α)12C channel is rather difficult as it involves a relatively high multiplicity and the difficult detection of low energy charged particles. There has been no direct measurement of the 3αchannel to date. Kolataet al.determined the 3αcross section by subtracting the contributions of theαand 2αchannels from the observedγ-ray yields [5,6] from the summedαparticle yield. However their result showed a minimum cross section at$ E_{\rm c.m.}\sim $ 19 MeV. Such an abnormal behavior is difficult to explain using any theory. An exclusive measurement of 3α+12C is needed to verify the result.The12C(12C,8Be)16O channel is a possible channel for the12C+12C fusion reaction. It was found that the8Be channel reaction cross section is smaller at
$ E_{\rm c.m.}\geq $ 3.91 MeV, but larger at$ E_{\rm c.m.}\leq $ 3.13 MeV than the$ \alpha_0 $ +20Neg.s.channel cross section. It was also found the cross section exceeds the DWBA calculation by nearly 3 orders of magnitude at$ E_{\rm c.m.} $ =2.43 MeV, suggesting that the formation of12C+12C dinuclear states becomes a predominant process at incident energies of$ E_{\rm c.m.}\leq $ 3.13 MeV [7]. As the outgoing8Be decays into twoαparticles at low energies, the detection of this channel in the overwhelming background arising from elastic scattering processes is quite challenging. So far, this reaction channel has only been studied once at sub-barrier energies using an emulsion detector [7]. New experimental techniques are needed to push the measurement down to sub-barrier energies to further study the8Be+16O reaction channel.Fusion reactions involving weakly bound nuclei are important for nuclear physics as well for the development of the superburst model in astrophysics [1,8]. However, such experiments are rare due to low radioactive ion beam intensities and a low detection efficiency. To overcome these difficulties, an active target method has been developed (see Refs. [9,10] and references therein). The active target detector acts as the target for the reaction and as the detection medium at the same time. These detectors are usually designed in the form of a multi-sampling ionization chamber or Time Projection Chamber (TPC), which have nearly 4πsolid angle coverage for charged particle detection [10,11]. The incident particles and reaction products can be tracked by the detector, enabling the use of a thick target without inducing additional significant losses in energy resolution. The fusion excitation functions could be measured over a wide energy range using a single incident beam energy. For example, a MUSIC detector was used at the Argonne National Laboratory for measuring the cross sections of the10,12-15C+12C systems with a beam intensity varying between 500 and 5000 particles/sec [12,13]. The fusion cross section was determined by identifying the fusion evaporation residues against the elastic or inelastic scattering events based on their different ionization energy losses in the gas volume. Due to the absence of 3 dimensional (3D) tracks in MUSIC, accurate measurements of the reaction multiplicity and the stopping power of each product cannot be obtained. A measurement of the fusion cross section below ~ 100 mb is rather challenging. A more complete measurement of the fusion residues and the decayed particles is needed to lower the limit of the cross section measurement.
We present the first experiment involving exclusive measurements of the excitation functions for the 3αchannels of12C+12C at energies around the Coulomb barrier. With the three dimensional tracking capability of TPC, the 2α, 3αparticles and8Be channels could be detected in addition to the reaction residues. Although the beam intensity is only a few hundreds of counts per second (cps), the exclusive measurement of the 2α, 3αchannels pushes the measured cross section limit down to 10 mb. Our measurement of the 3αchannel contradicts the minimum cross section observed atEc.m.=19 MeV. In the following sections, the detector setup and experimental procedure are described. The experimental results are presented together with a discussion of the results.
-
The experiment was performed with a 1024-channel TPC named pMATE (prototype Multi-purpose time projection chamber for nuclear Astrophysical and Exotic beam experiments). A schematic of the experimental setup and pMATE TPC detector are shown inFig. 1. The primary beam of12C4+was delivered from the sector-focusing cyclotron at the Heavy Ion Research Facility in Lanzhou (HIRFL), China [14]. The beam energy and beam current were 4.91 MeV/u and 300 enA, respectively. In order to obtain a low beam intensity down to the order of several 102cps for the active target, the12C particle was scattered by a gold foil with a thickness of 0.81 mg/cm2in a scattering chamber. The TPC was installed at a scattering angle of 30°, as shown inFig. 1. The scattered12C particle entered the TPC gas chamber through a 10 μm mylar foil with a 10-mm opening aperture, which was 80 cm away from the scattering Au foil. pMATE TPC was mounted inside a 380 mm (L)
$ \times $ 355 mm$ \times $ 285 mm (H) stainless chamber. In this12C+12C measurement, isobutane (C4H10) was used as the active target. The gas pressure and flow were controlled by a gas handling system to ensure the stability of the TPC running conditions during the test and measurement. In order to cover a wide energy range of the reaction, the gas pressure in TPC was set to 106 mbar and 50 mbar. In the latter case, an aluminum degrader with a thickness of 29 μm was placed before the TPC entrance window for tuning the beam energy to the wanted energy range.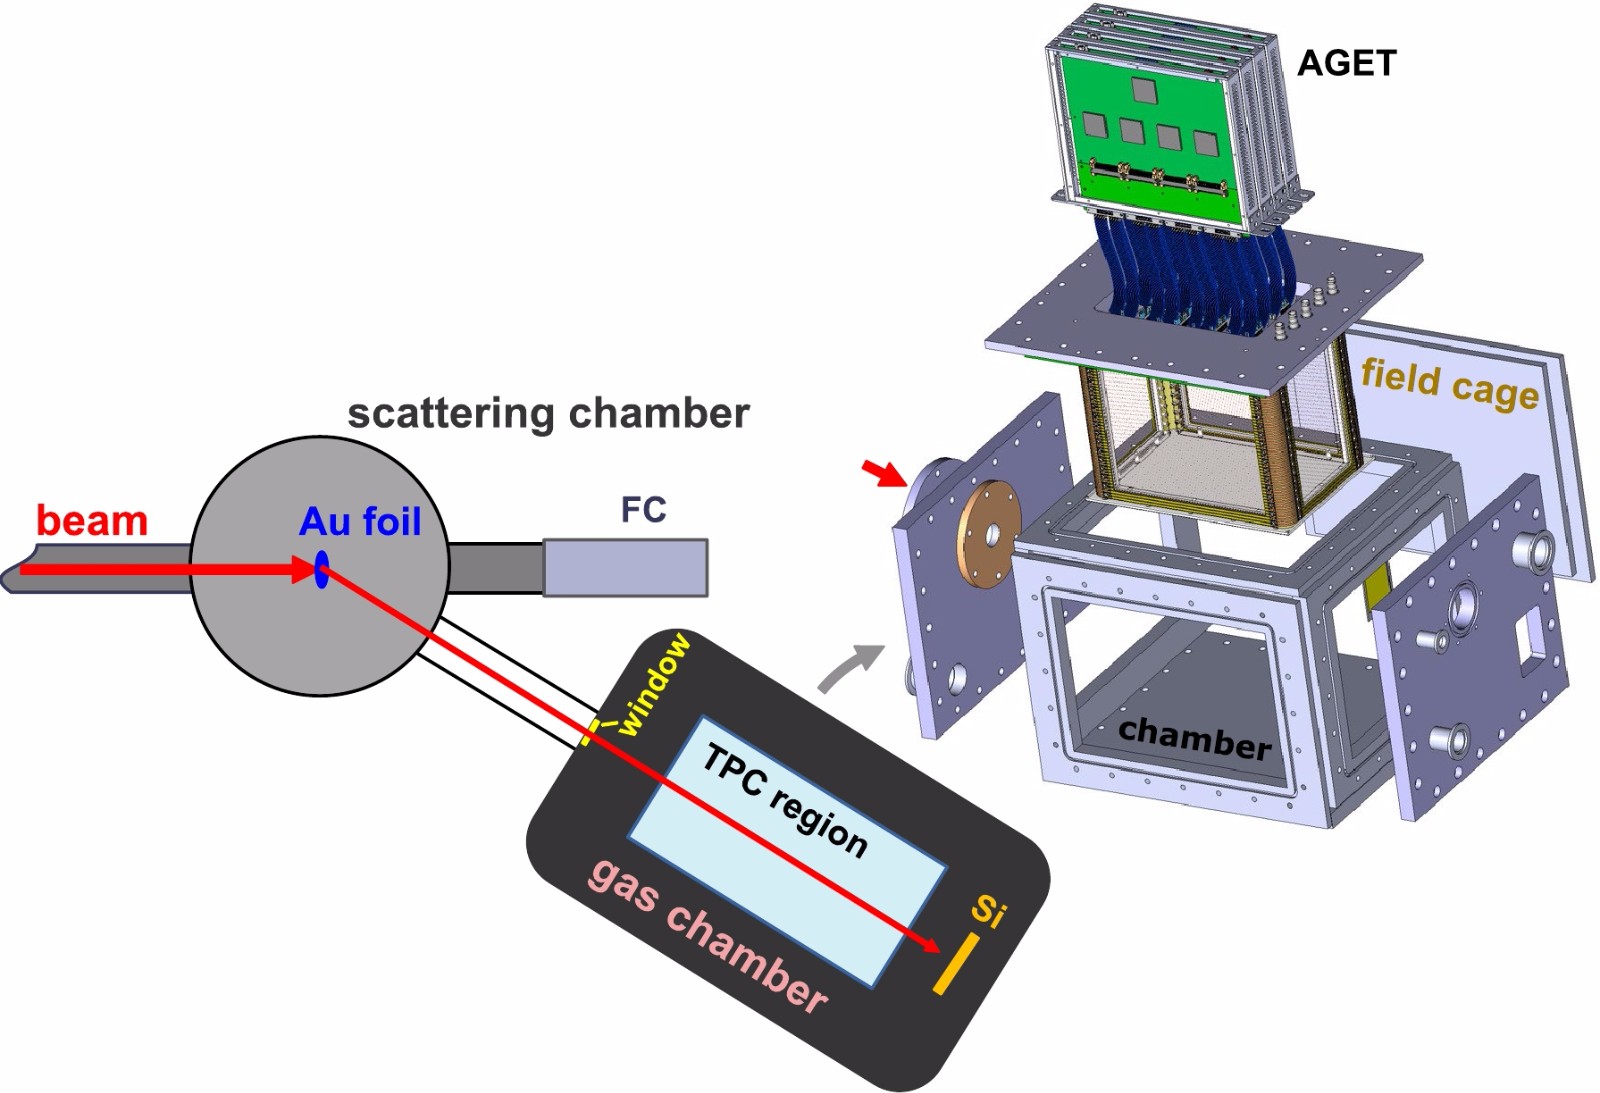
Figure 1.(color online) Schematic of the experimental setup used for the measurement.
The pMATE TPC has an active volume of 100 mm
$ \times $ 200 mm$ \times $ 200 mm (H). With a uniform electric field, which was formed by field wires, electrons from primary ionizations in the active region drift towards the anode readout plane. The avalanche of primary electrons, known as gas amplification, is performed using a stack of 2 thick Gaseous Electron Multipliers (GEMs) mounted on the readout plane [15]. In order to measure the multiplicity for reaction products, the anode is segmented into 32$ \times $ 32 rectangular pads of 3$ \times $ 6 mm2, which is shown in the upper part ofFig. 2. The pad columns are numbered from 0 to 31 along the incident beam direction (zaxis inFig. 2). A detailed description of the pMATE TPC and its performance can be found in Ref. [16].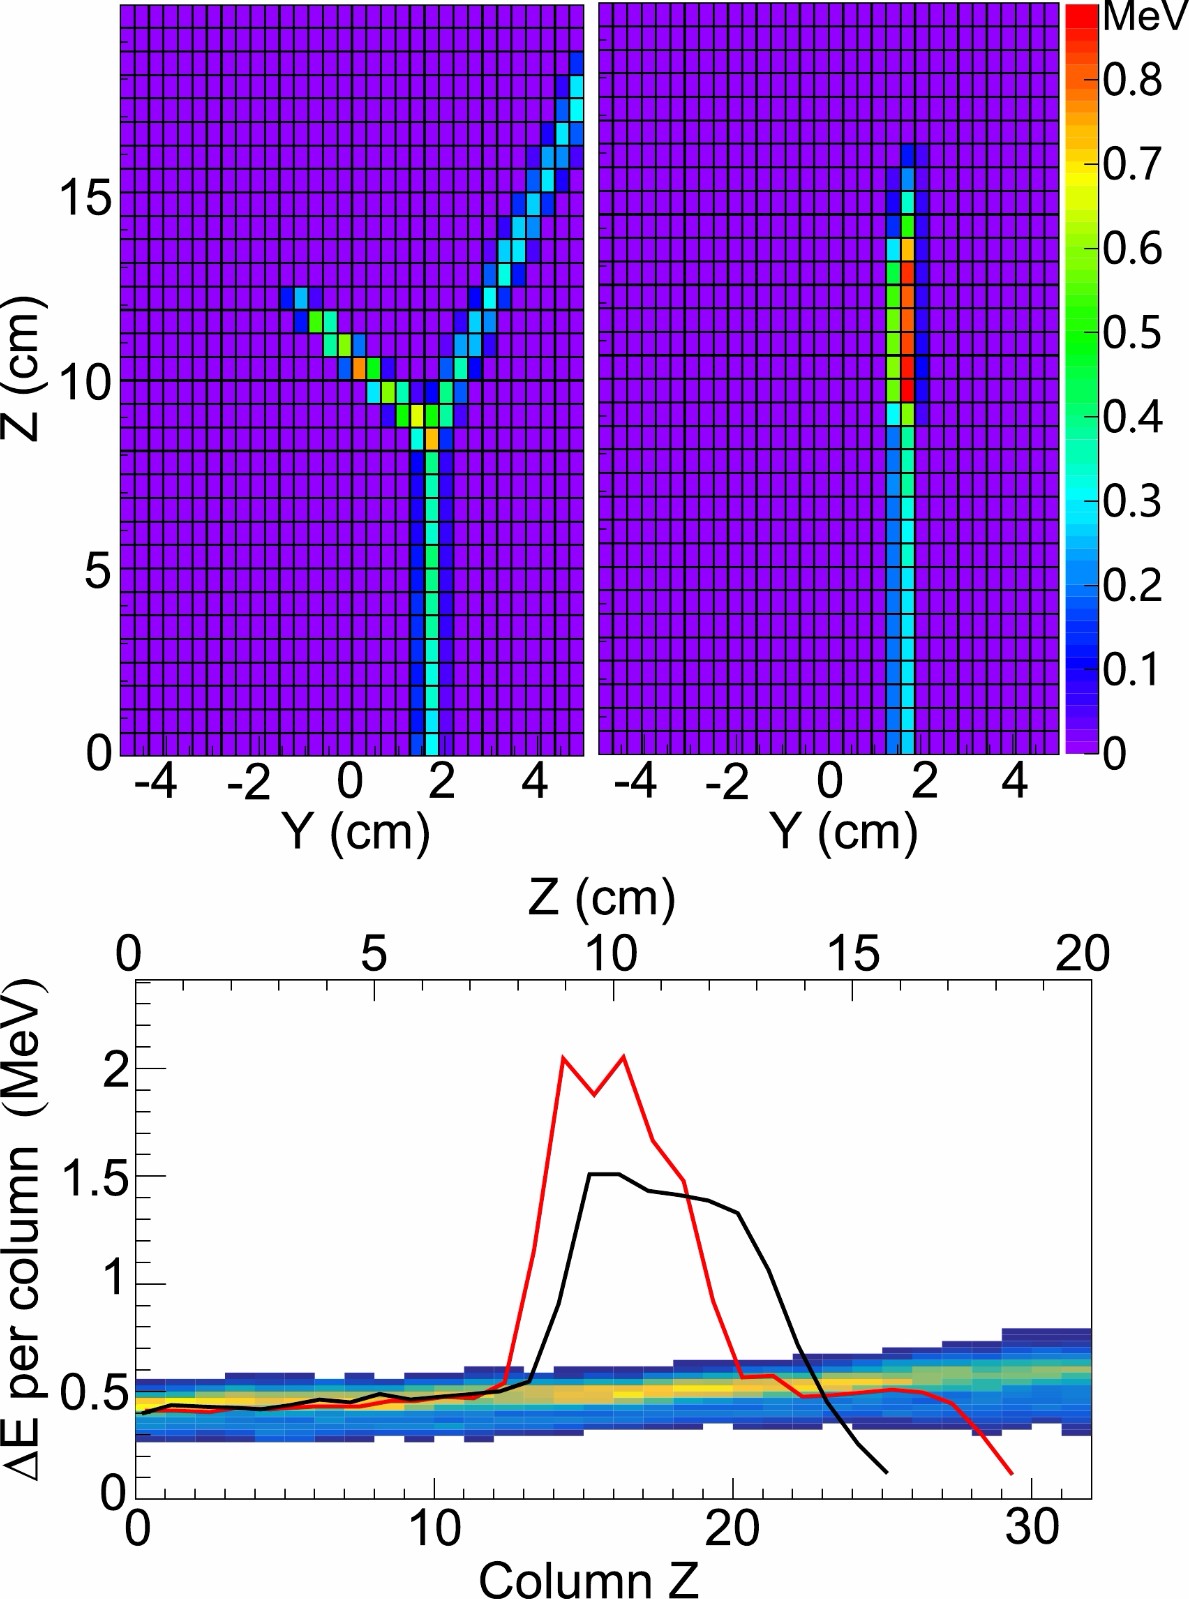
Figure 2.(color online) Events measured with the pMATE TPC at a gas pressure of 50 mbar. (top) Trajectories projected in the readout pad plane for one typical scattering event (left) and fusion event (right). The color is proportional to the energy-loss on each pad. (bottom) Histogram of the energy-loss profile of the unreacted beam particles along their incident direction. The energy-loss profiles of the reaction events in the top panel (red line
$ \rightarrow $ top left, black line$ \rightarrow $ top right) are also plotted for comparison. The pad columns are numbered from 0 to 31 along thezaxis, which defines the beam direction.The pad signals are read out using a 1024-channel digitized GET system [17]. The trigger rate is limited to 500 Hz considering the number of fired pads to be around 90 for each event. The corresponding data flow rate is estimated to be on the order of ~ 100 MB/s. In order to reduce the data flow and the possible data loss, it is necessary to avoid triggering the unreacted beam ions and elastic events at forward angles. For this purpose, a silicon detector was installed downstream of the TPC field cage inside the gas chamber (seeFig. 1). In the 12C+12C fusion reaction, the heavy residues tend to travel in a direction close to the incident beam. The gas pressure was adjusted to ensure the fusion residues stopped before the Si detector, while the unreacted beam particles could be detected by the Si detector. An anticoincidence between the signal from the Si detector and the signal from the GEM of TPC was used as the trigger for the GET electronics for capturing fusion reaction events and removing unreacted beam particles and most of the forward scattering events. To obtain the beam particle profile in TPC, the signal of the Si detector was also used occasionally in some runs after being scaled down.
In the current experimental setup, a constant gain optimized for fusion-residue andαparticle detection is achieved over the entire pad plane. The detection threshold is around 50 keV in each readout pad. Alpha particles with energies above ~15 MeV or protons with energies above ~0.56 MeV do not generate tracks in TPC as their energy depositions in each pad are below the detection threshold.
-
One advantage of the active-target TPC is that it records the tracks of every charged particle and provides the energy-loss, position and angle for each track. This capability cannot only help us tune the beam direction and reject events coming from scattering on the entrance window foil or the wires of the field cage, but is also crucial for an unambiguous identification of the type of reaction. The experimental traces of a typical scattering event and a fusion event measured with pMATE TPC are shown inFig. 2. On the bottom ofFig. 2, the Bragg curves (energy-loss in each pad column along the beam incident direction) of these two events are shown together with the energy-loss profiles of the unreacted beam particles passing through the TPC gas region. The Bragg curves for these reaction events are similar to the energy-loss signals of beam particles before the reaction happens. When the reaction happens, the Bragg curve suddenly increases around the reaction vertex. As shown inFig. 2, it is rather challenging to cleanly identify fusion events based only on these interfering elastic or inelastic scattering events. Information on the tracks of the emitted light particles from the fusion reaction is needed to determine the exact type of reaction.
Identification of the trajectories of the reaction products is the major task in a reconstruction of the reaction events. For most nuclear reaction measurements using TPC, the light particles from the reactions are usually scattered at large angles relative to the projectiles. In these cases, track reconstruction is straightforward. By extrapolating the tracks to the beam axis, the reaction vertex can be determined. In the case of fusion studies, reconstruction is complicated by the fact that the direction of the fusion residues is close to the beam direction. In order to eliminate interference from beam ions, the beam trajectory before the reaction has to be removed first. In our analysis, a pad region is defined for the12C beam according to the beam trajectory projected on the pad plane. Using the energy-loss (ΔE) profile in this beam region, as shown inFig. 2, the reaction position (or column) can be determined by checking ΔE. The fired pads from this position to the beam entrance correspond to the beam trajectory and are removed from further track analyses of the reaction products.
An example of a track reconstruction for one elastic/inelastic scattering event obtained in our experiment is shown inFig. 3. Two scattering particles cannot be separated at the point at which the two tracks merge in the readout pad plane (top panel inFig. 3). However, in the drift plane, which is perpendicular to the readout plane, two distinct tracks are observed, as shown in the middle panel ofFig. 3. The drift coordinate is determined by the electron drift time multiplied by the drift velocity. Here, we adopted the two-dimensional Hough transform method for separating the track, an algorithm commonly used in image analysis based on a given set of image pixels (see Ref. [18]). In the Hough transformation, each point at (x,y) is transformed into a curve in the (
$ \theta,R $ ) parameter space (Hough space) using the formulaR=$ x{\rm cos}\theta $ +$y{\rm sin}\theta$ in theθinterval of 0$ \leq $ θ$ \leq $ π. If the pixels in the pad or drift plane form a straight line, their transformed curves will intersect at one point in Hough space. As an example, the points in the drift plane (middle panel inFig. 3) are transformed into the Hough space shown at the bottom ofFig. 3. It should be noted that the points of the unreacted beams were removed before the transformation. By searching the intersection points in the Hough space in an iterative way, multiple tracks were determined separately. The solid straight lines in this figure represent the linear fittings, which are weighted by the charges deposited on each pad. It is seen that this procedure shows a good and stable track reconstruction performance over the entire range for scattering particles. Using 3D tracks, the particle energy loss, range and angle can be obtained and the reaction vertex can be calculated by tracing back to the beam axis.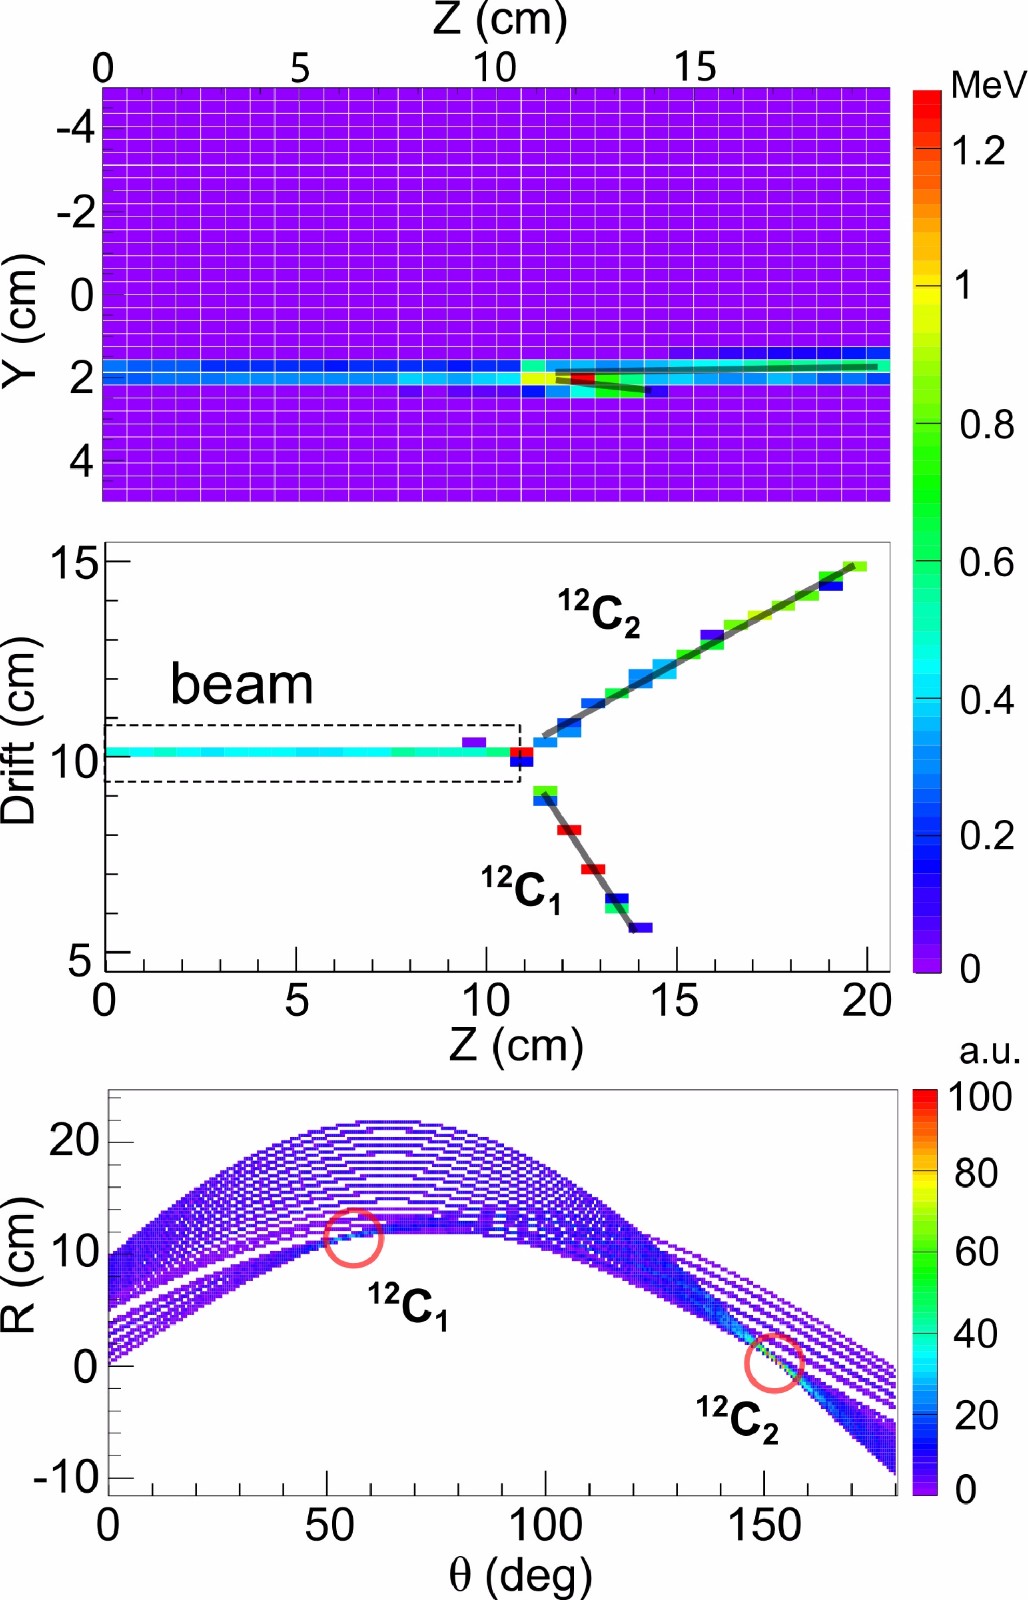
Figure 3.(color online) Example of a12C+12C scattering event. (top) Track projection to the pad plane. (middle) Projection to the drift plane along the electron drift direction. The solid lines are the linear fittings of the tracks identified by the Hough transform algorithm. (bottom) Hough space made from the points in the middle panel, where the points belonging to the beam were removed before the transformation. The red open circles indicate identified particle trajectories.
The response of the pMATE TPC to the fusion reaction was also investigated using a similar tracking method. The top plot ofFig. 4shows a strong ionization at the end of the beam-like trajectory. Looking at the event trajectories in the drift plane at the bottom ofFig. 4, this track was identified to be formed by fusion residue which has higherAandZthan the12C beam. These particles are stopped quickly by the gas after the reaction. The energy loss of another track is very different. The
$ \Delta E $ per pad is about ten times smaller than that of the12C beam. As the proton is below the detection threshold and no tritons or3He are expected in the12C+12C reaction in the current energy range, we can identify this particle as being an alpha using its energy-loss profile in the gas. Note that the range of the fusion residue in the gas is relative short and hence its points in Hough space sometimes fall into the alpha track. In order to resolve the track of heavy residue, we follow the changes in stopping power ($ {\rm d}E $ /$ {\rm d}X $ ) along the 3D track. Starting from the end point in a track, the averaged$ {\rm d}E $ /$ {\rm d}X $ is calculated at each point with a step size of 12 mm towards the reaction vertex. If the averaged$ {\rm d}E $ /$ {\rm d}X $ becomes two times larger than the previous one, the corresponding data points after that position will be removed from the track. These filtered points will be analyzed by a new Hough transform to identify the alpha track.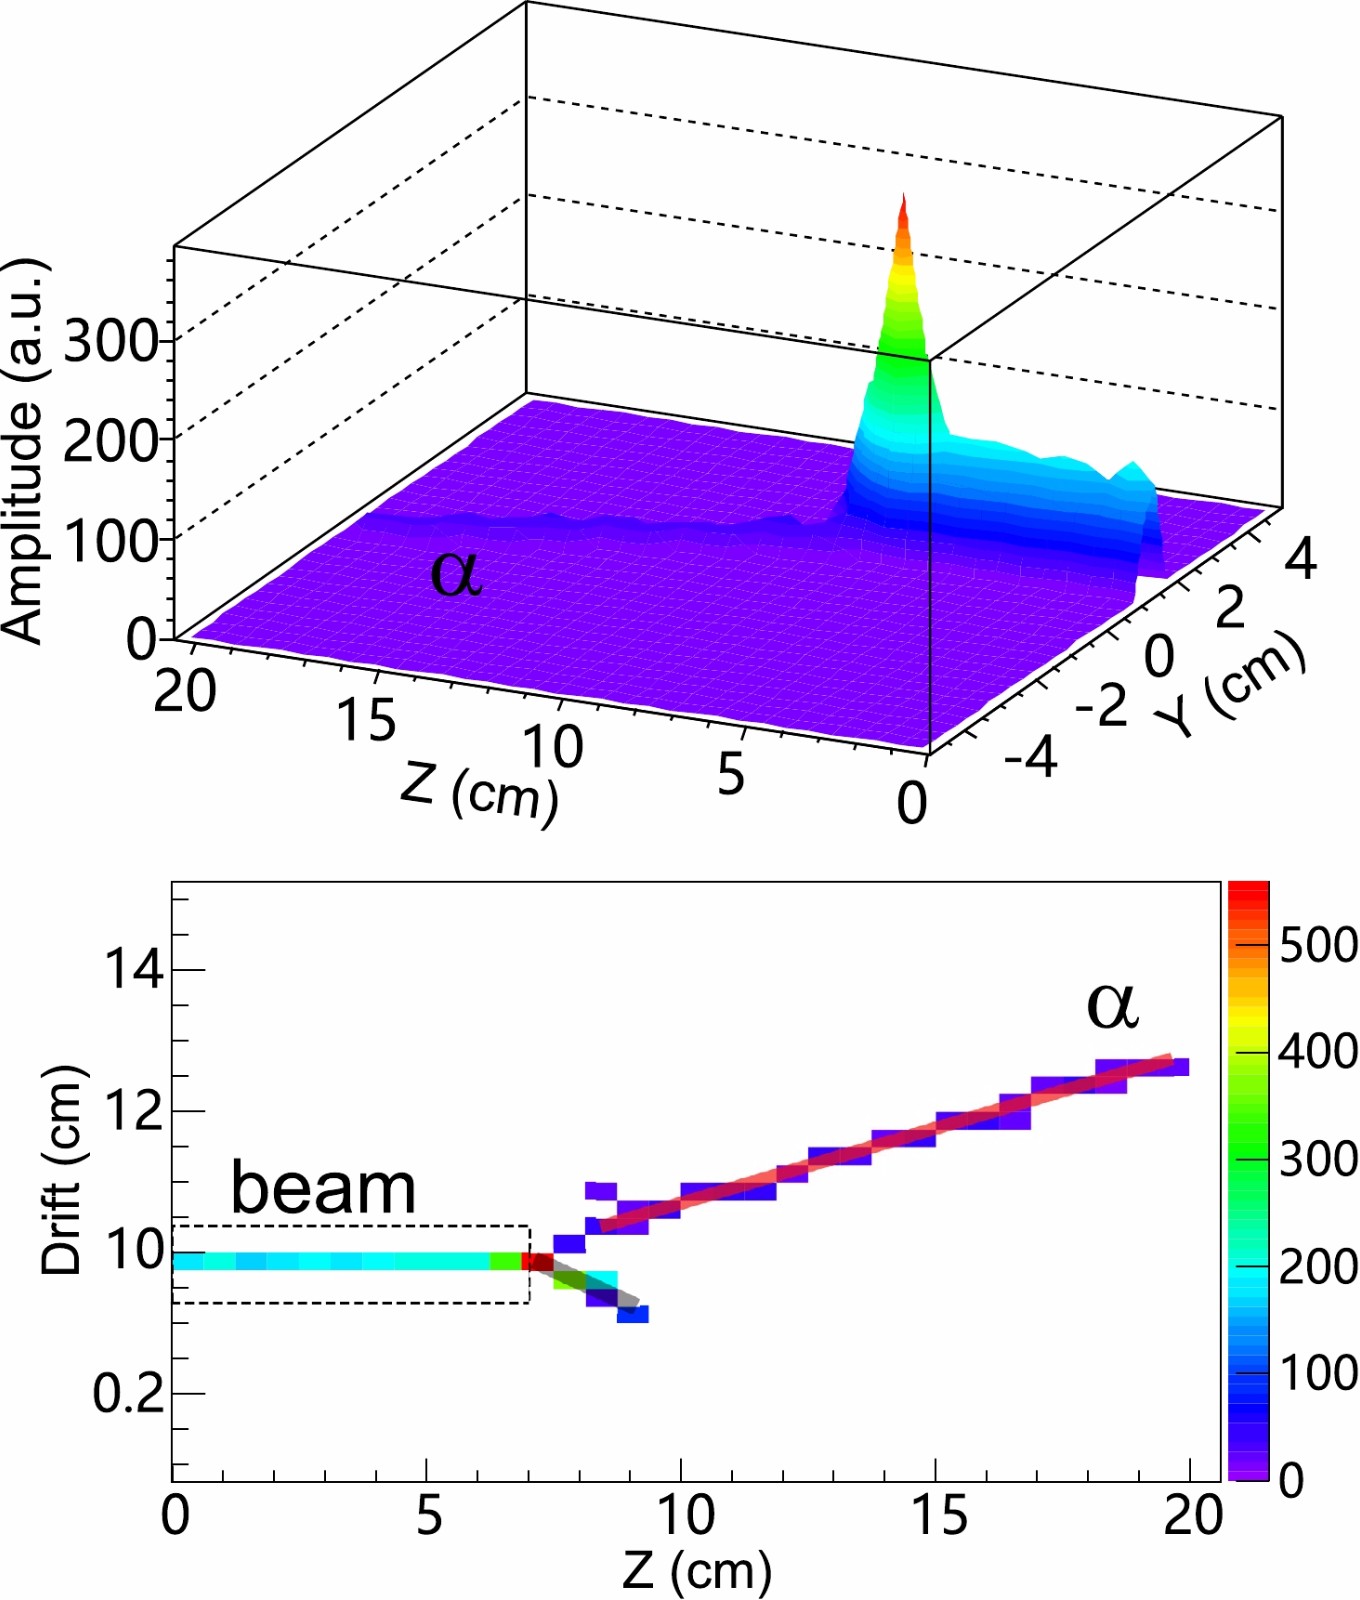
Figure 4.(color online) Energy-loss for a fusion event with oneαemission. (top) Projection of the energy-loss in the pad plane. (bottom) Track projection in the drift plane. The straight lines are the linear fittings of the tracks identified by the Hough transform algorithm.
An example of a four body event in the exit channel is shown inFig. 5. Due to the good tracking capability for multiple tracks, three evaporated alpha particles were detected directly and the recoiling fusion residue is also clearly seen here. After removing the beam trajectory, all recorded trajectories were reconstructed successfully using Hough transformation, as shown inFig. 5.
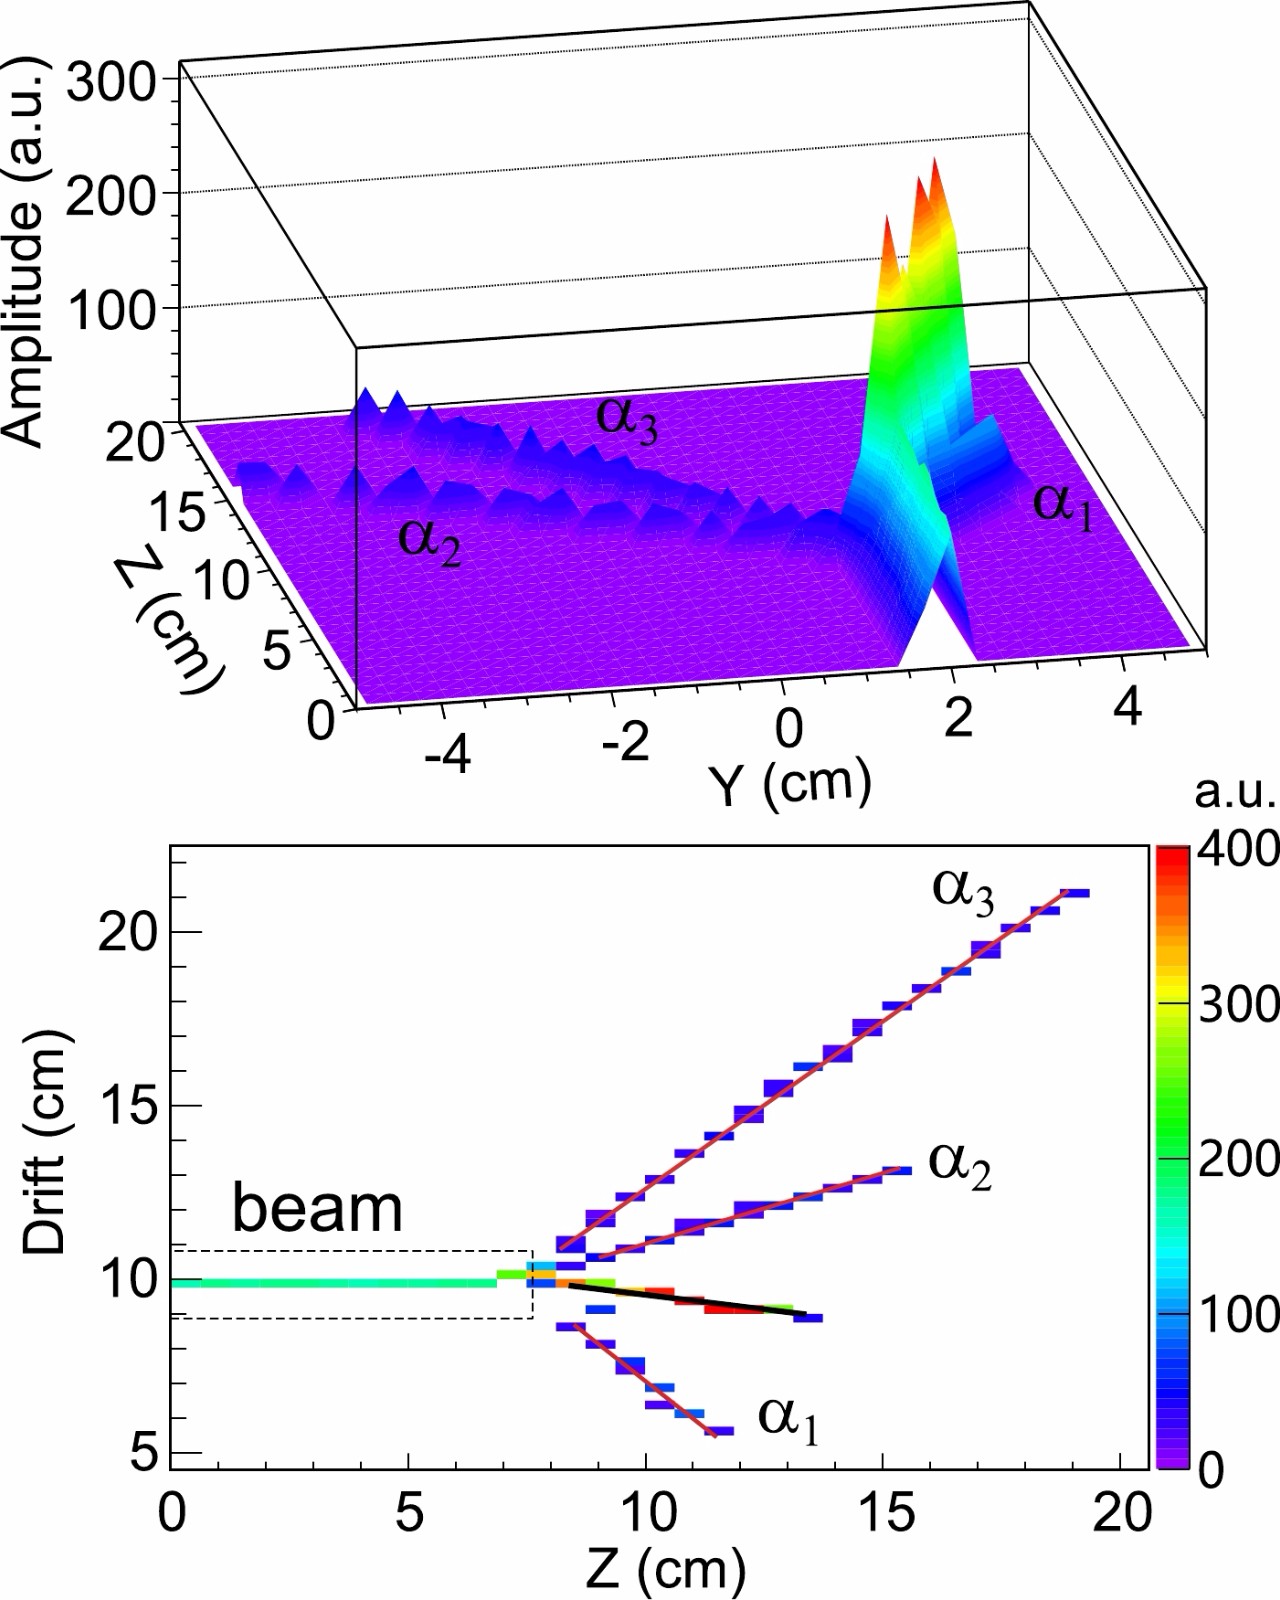
Figure 5.(color online) Similar toFig. 4, but for 3αemission from a12C+12C reaction event.
The emission of a heavier cluster decay12C+12C
$ \rightarrow ^{16} $ O+8Be (g.s.) has been studied extensively in previous works [7,19,20]. It was also observed in this work. For a ground-state8Be decay, two alpha particles are emitted with a narrow opening angle between each other. An example, as observed in this work is shown inFig. 6.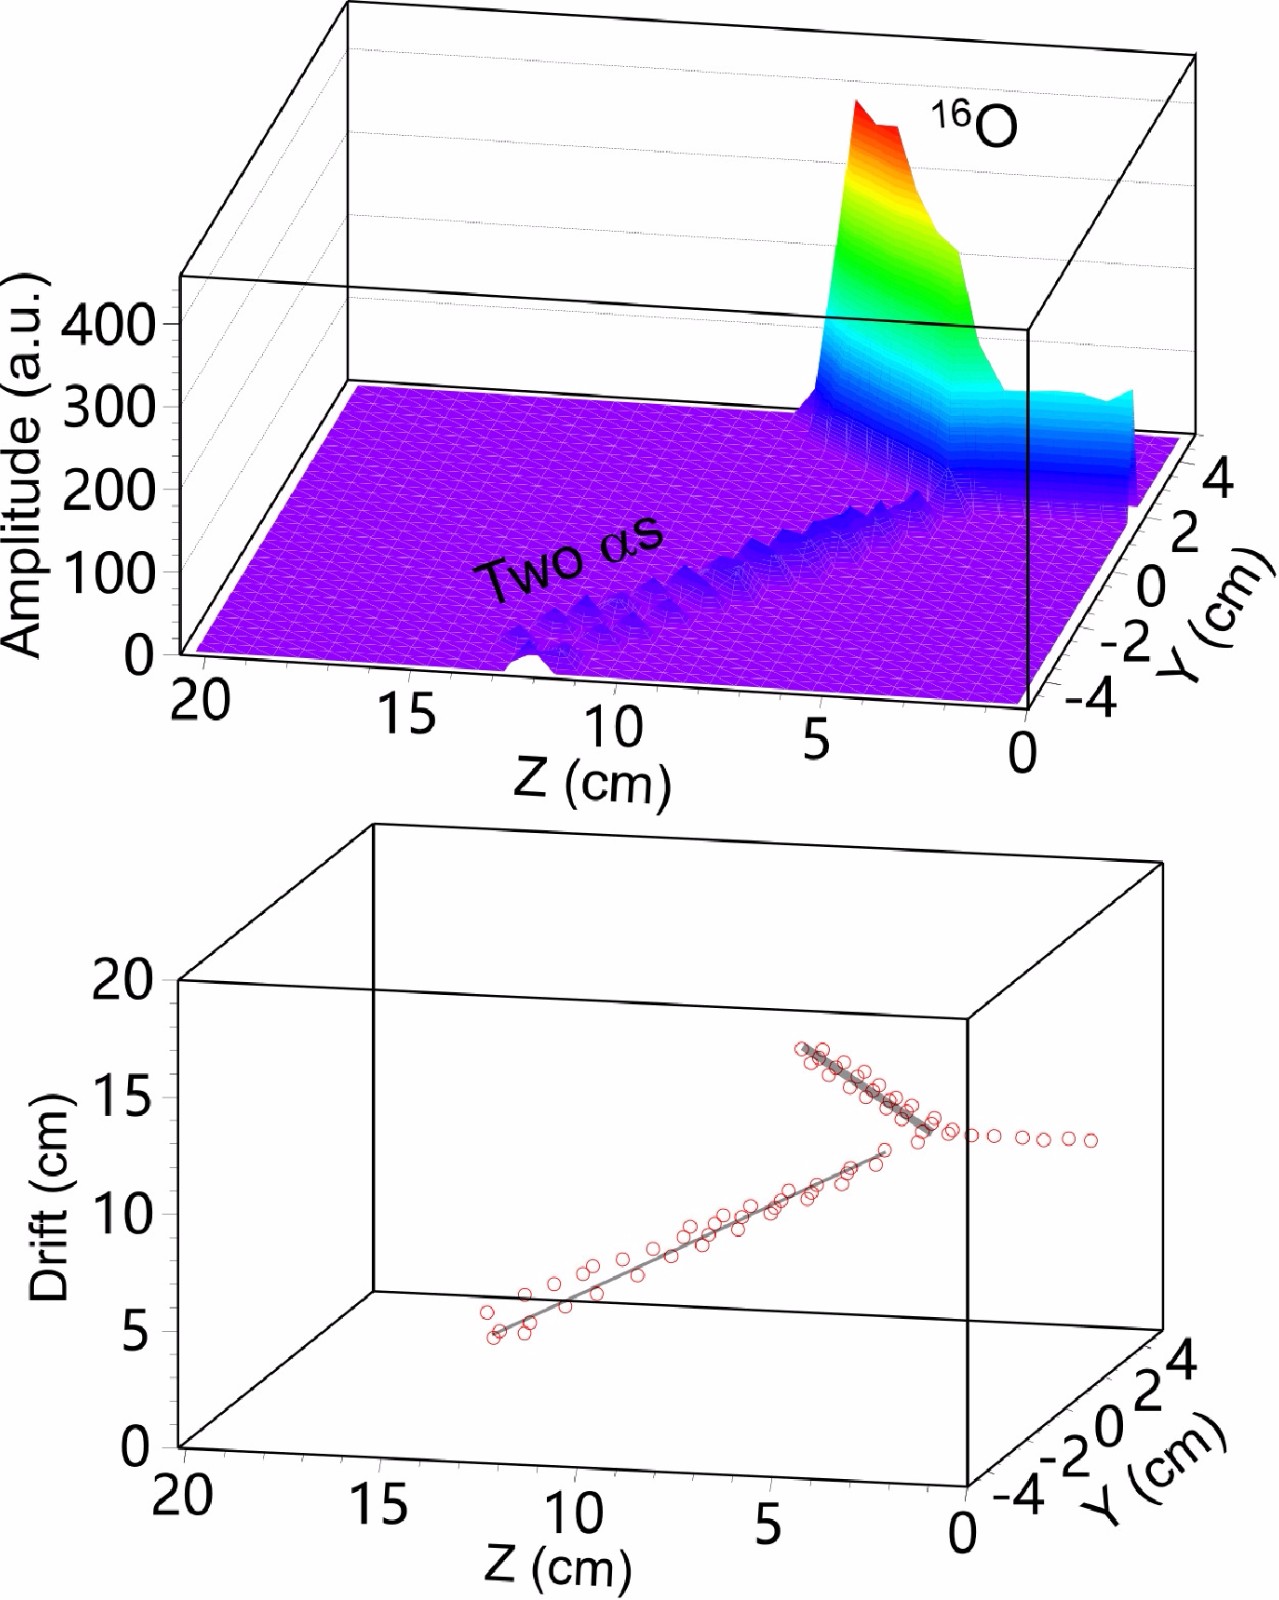
Figure 6.(color online) Energy-loss plot for a fusion event with a possible8Be-particle emission. (top) Projection of the energy-loss in the pad plane. (bottom) Three dimensional points for track reconstruction. The straight lines are the linear fittings of the tracks identified by the Hough transform algorithm.
-
To identify the12C+12C fusion events, the maximum stopping power (dE/dXmax) of each track is calculated using a step size of 1 cm. InFig. 7(a), dE/dXmaxis plotted against the total ionization energies of the tracks for different particles. In this plot, alpha particles from the fusion events are located around the coordinate origin and can be clearly separated from the scattering events. Fusion residues with a recoil energy of more than 5 MeV are also well separated from the scattering events. However, some residues with smaller energies have rather smaller
$ {\rm{d}}E $ /$ {\rm{d}}X_{\rm max} $ and partly overlap with the scattered particles.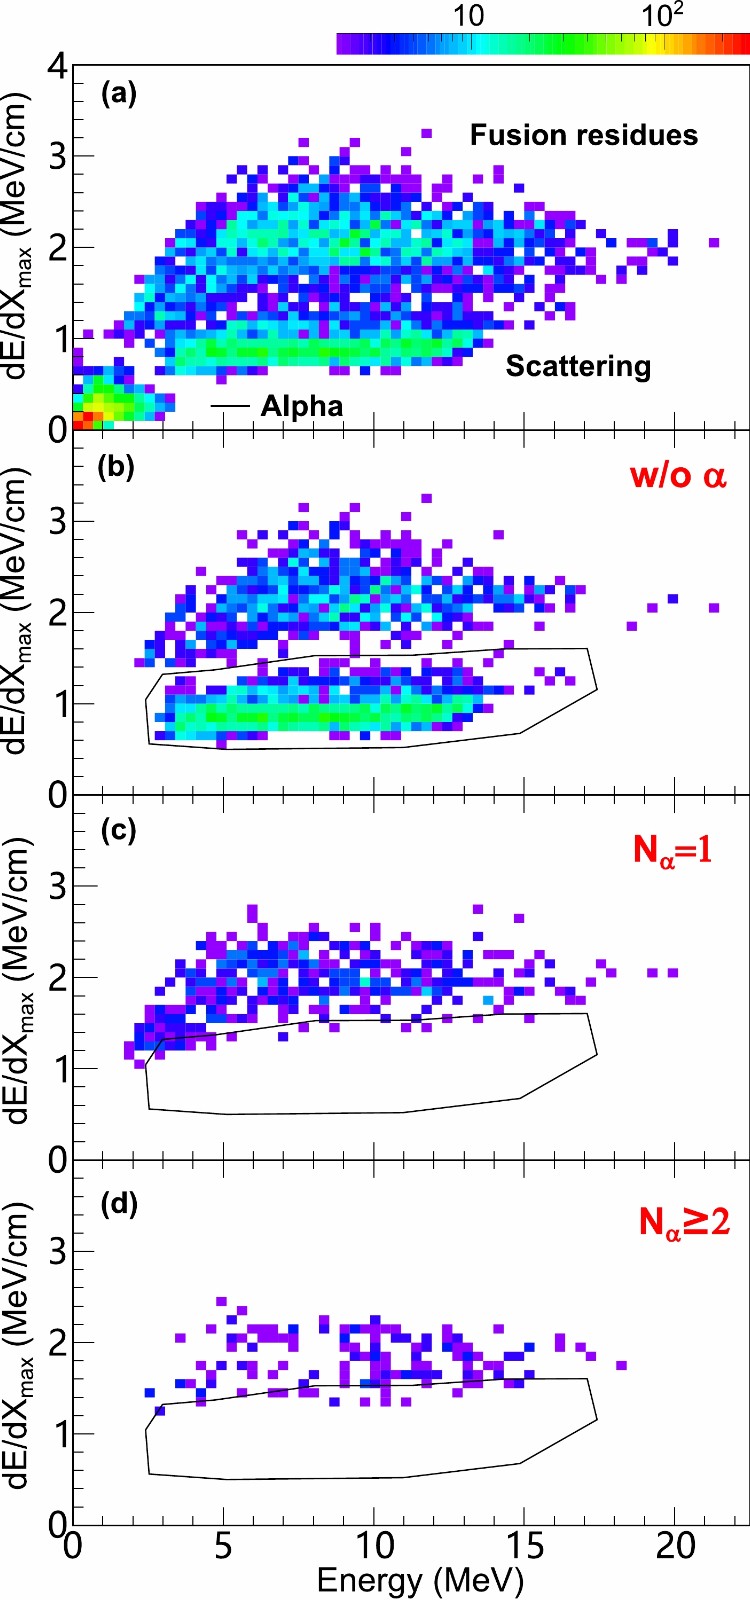
Figure 7.(color online)
$ {\rm d}E $ /$ {\rm d}X_{\rm max} $ versus total energy deposition of particle (E) for the detected particles in TPC. The data were obtained at a pressure of 50 mbar and the plots were generated under the following conditions: (a) all tracks of the reaction products, (b) no alpha tracks identified in the reaction products, (c) single alpha particle identified in the reaction products, and (d) two or more alpha particles identified in the reaction products. Events localized around the coordinate origin come from the alpha particles. Regarding fusion residues with a recoil energy of less than 5 MeV, they partly overlap with the scattered particles indicated with a black polygon. By requiring the presence ofαparticles, the fusion residues can be clearly identified without interference by the scattering events.For reaction channels evaporating protons and neutrons (
$ xpn $ channels), the kinematic kick on the fusion residue is less significant than for channels which include the evaporation ofαparticle(s).$ {\rm d}E $ /$ {\rm d}X_{\rm max} $ versus the kinetic energy spectrum of the fusion residues is shown inFig. 7(b). In the current experiment, the kinetic energies of the fusion residues were high enough to be separated from the beam particle,12C. For theα(s)+$ xpn $ channels, once an alpha particle is identified, this reaction can be categorized as a fusion event. The$ {\rm d}E $ /$ {\rm d}X_{\rm max} $ spectra gated with detection of 1αand$ \geq $ 2αs are shown inFigs. 7(c)and(d), respectively. Due to the requirement of anαtrack, the fusion residues can be well identified without any interfering scattering events.The fusion reaction yields are obtained by counting the number of fusion events in each pad column along the beam direction. As the first and last several columns were required to detect the tracks of beam and reaction particles, the current pMATE TPC provided 18–20 energy points in each run. The number of12C beam particles was determined from the rates recorded by Silicon downstream. A realistic Geant4 simulation was performed to determine the beam energy at each reaction vertex and the energy uncertainty. In the current work, uncertainty in the reaction energies was determined (e.g. ~ 0.84 MeV (1σ) atEbeam=22 MeV), which is dominated by the kinematic broadening of the scattered12Cs by the Au target and energy straggling in the degrader and the counting gas.
The fusion cross sections were obtained in the ranges of
$ E_{\rm c.m.} $ =15.3–21.1 MeV and$ E_{\rm c.m.} $ =8.93–13.69 MeV with gas pressures of 106 and 50 mbar, respectively. Due to false triggers in the GET system during the measurement at 50 mbar, we were not able to determine the absolute cross section of the12C+12C reaction. To solve this problem, the total fusion cross sections in the second run at 50 mbar are normalized to the results measured by Kovaret al. [21] with a scaling factor determined with a chi-square analysis. The total fusion cross sections shown inFig. 8agree well with the previous measurement [21] and the calculations using the the energy-dependent version of Wong's formula proposed by Rowley and Hagino [22]. -
The dominant channel of the 2α+
$ xpn $ channels is12C(12C,2α)16O, as the other channels are negligibly small according to the statistical model calculation using Empire [24]. For example, the cross section ratio of12C(12C,2α+p)15N to12C(12C,2α)16O is estimated to be 0.02 according to Empire. The contributions of the other channels are even smaller or totally closed due to the energy threshold.The 3-body decay events were simulated in the 2αsequential decay mode. TGenphasespace provided by ROOT [25,26] was used to generate the phasespaces of these decay particles. The population and decay probabilities of the excited states in the intermediate20Ne nucleus were taken from the statistical model calculation. In the8Be mode, an8Be particle is emitted before it decays into twoαparticles with a decay energy of 93 keV.
The 2αsequential decay was simulated using the statistical model codes, Empire and Talys [27]. The population of the excitation energy distribution of the16O is shown inFig. 9. Using the kinetic energy derived from the measured range and angle of the detected16O, theQvalue was calculated using the following equation,
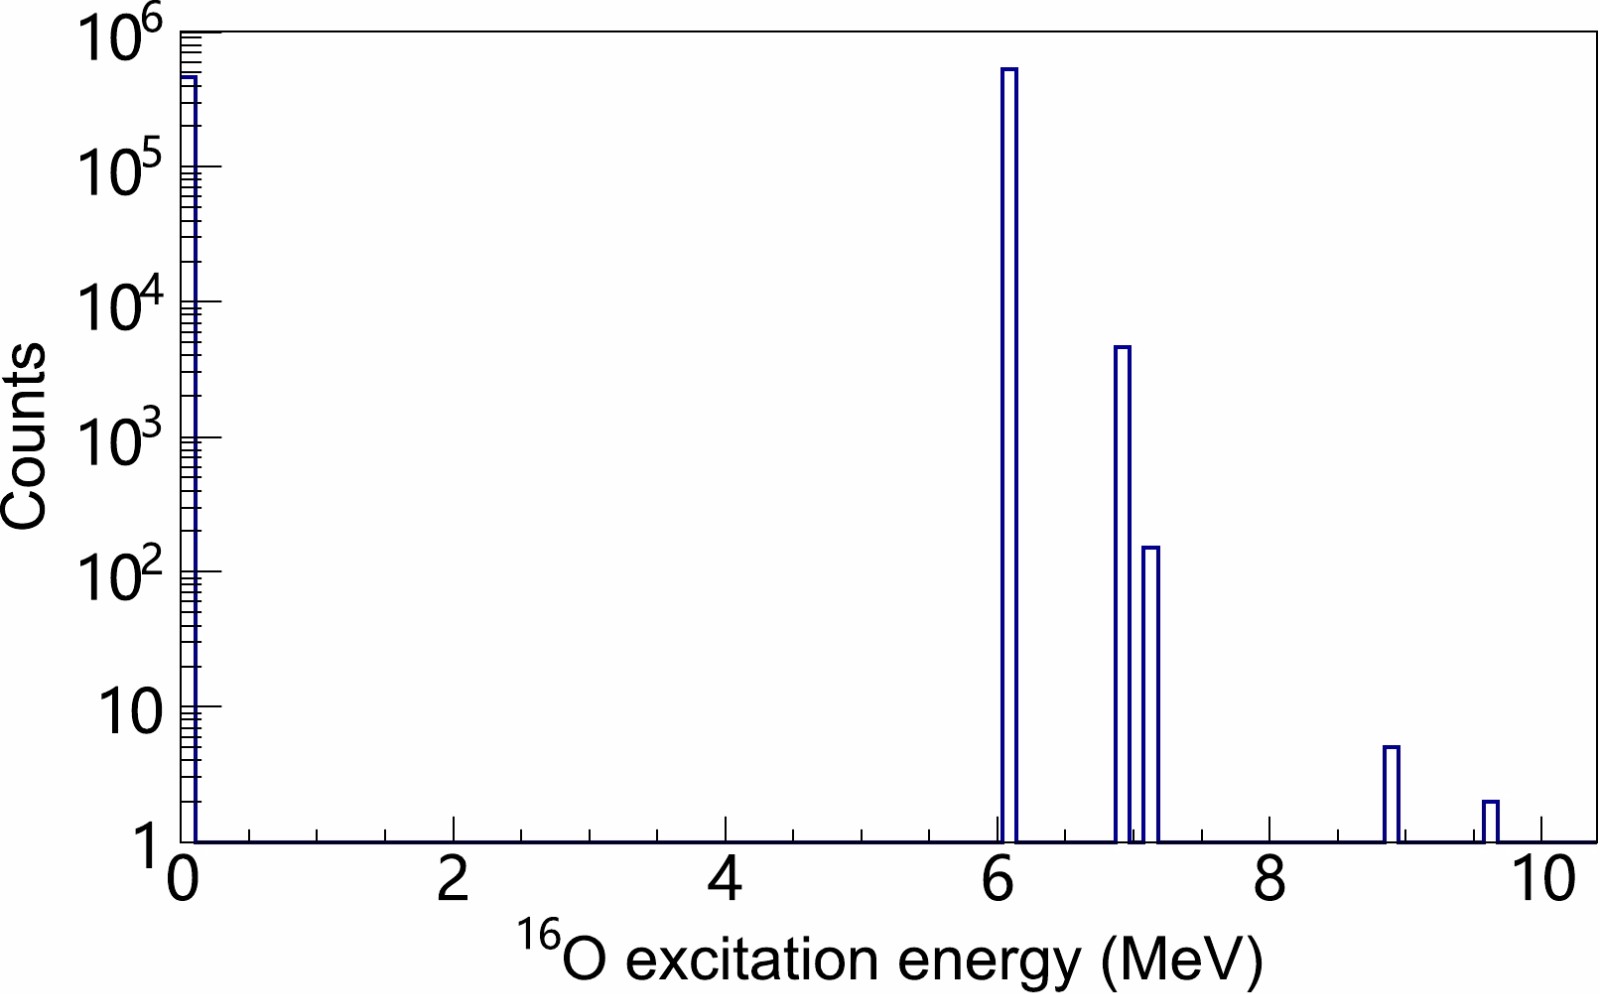
Figure 9.(color online) Excitation energy spectrum of16O simulated using the statistical model atE1=24 MeV.
$ \begin{equation} Q=\left ( \frac{12}{8} -1\right )E_1+\left ( \frac{16}{8}+1 \right )E_3-2\frac{\sqrt{12\cdot 16\cdot E_1\cdot E_3}}{8}\cos \theta_3. \end{equation} $

(1) Here
$ E_1 $ is the beam energy in the laboratory frame,$ E_3 $ is the kinetic energy of16O as derived from the measured range in TPC, and$ \theta_3 $ is the angle of16O. The spectrum of theQvalue is shown inFig. 10. It should be noted that theQvalue includes not only the excitation energy of16O but also the internal kinetic energy of the twoαparticles in the center of mass frame (CM) of the twoαparticles. The minimum internal kinetic energy of the twoαparticles is 0 while the maximum value corresponds to the zero kinetic energy of16O in the CM frame, which can be calculated using$ E_1 $ /2+$ Q_0 $ –$ E_x $ . Here$ E_x $ is the excitation energy of16O and$ Q_0 $ equals –0.113 MeV, which is theQvalue of the channel decaying to the ground state of16O. The allowedQ-value range for16O for a given$ E_x $ is from$ -E_x $ –0.113 MeV to$-E_1$ /2–0.113 MeV. According to the statistical model prediction at$ E_1 $ =24 MeV shown inFig. 9, the most populated states of16O are the ground state and the excited state at 6.049 MeV. Therefore, theQvalues of the ground state and the 6.049 MeV state range from –0.113 to –12 MeV and from –6.162 to –12 MeV, respectively. Our experimental result shown inFig. 10confirm these results.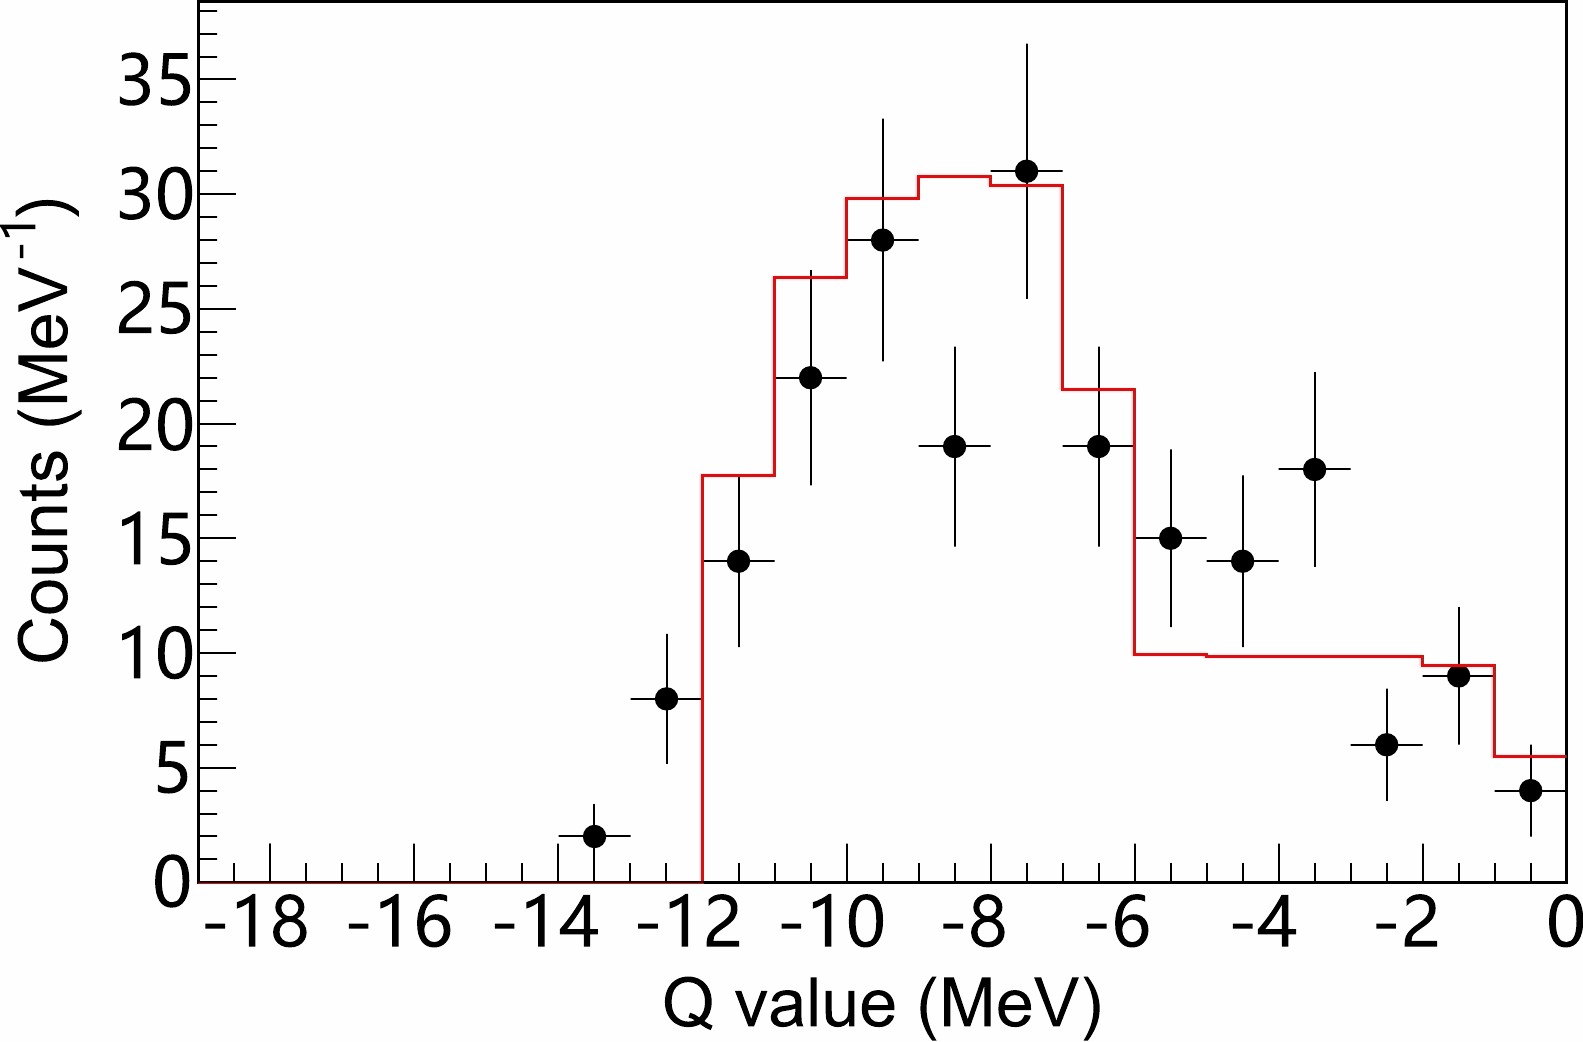
Figure 10.(color online) ExperimentalQ-value spectrum calculated with the kinetic energy and angle of16O for events in the range ofE1=18–28 MeV. The red line is the simulated result withE1=24 MeV.
Simulations of16O (
$ \theta_{16 \rm O} $ ) angle versus the opening angle between twoαparticles ($ \theta_{2\alpha} $ ) are shown together with the experimental results inFig. 11. It is clear that the majority of the experimental results agrees well with the simulation result using the statistical model calculation.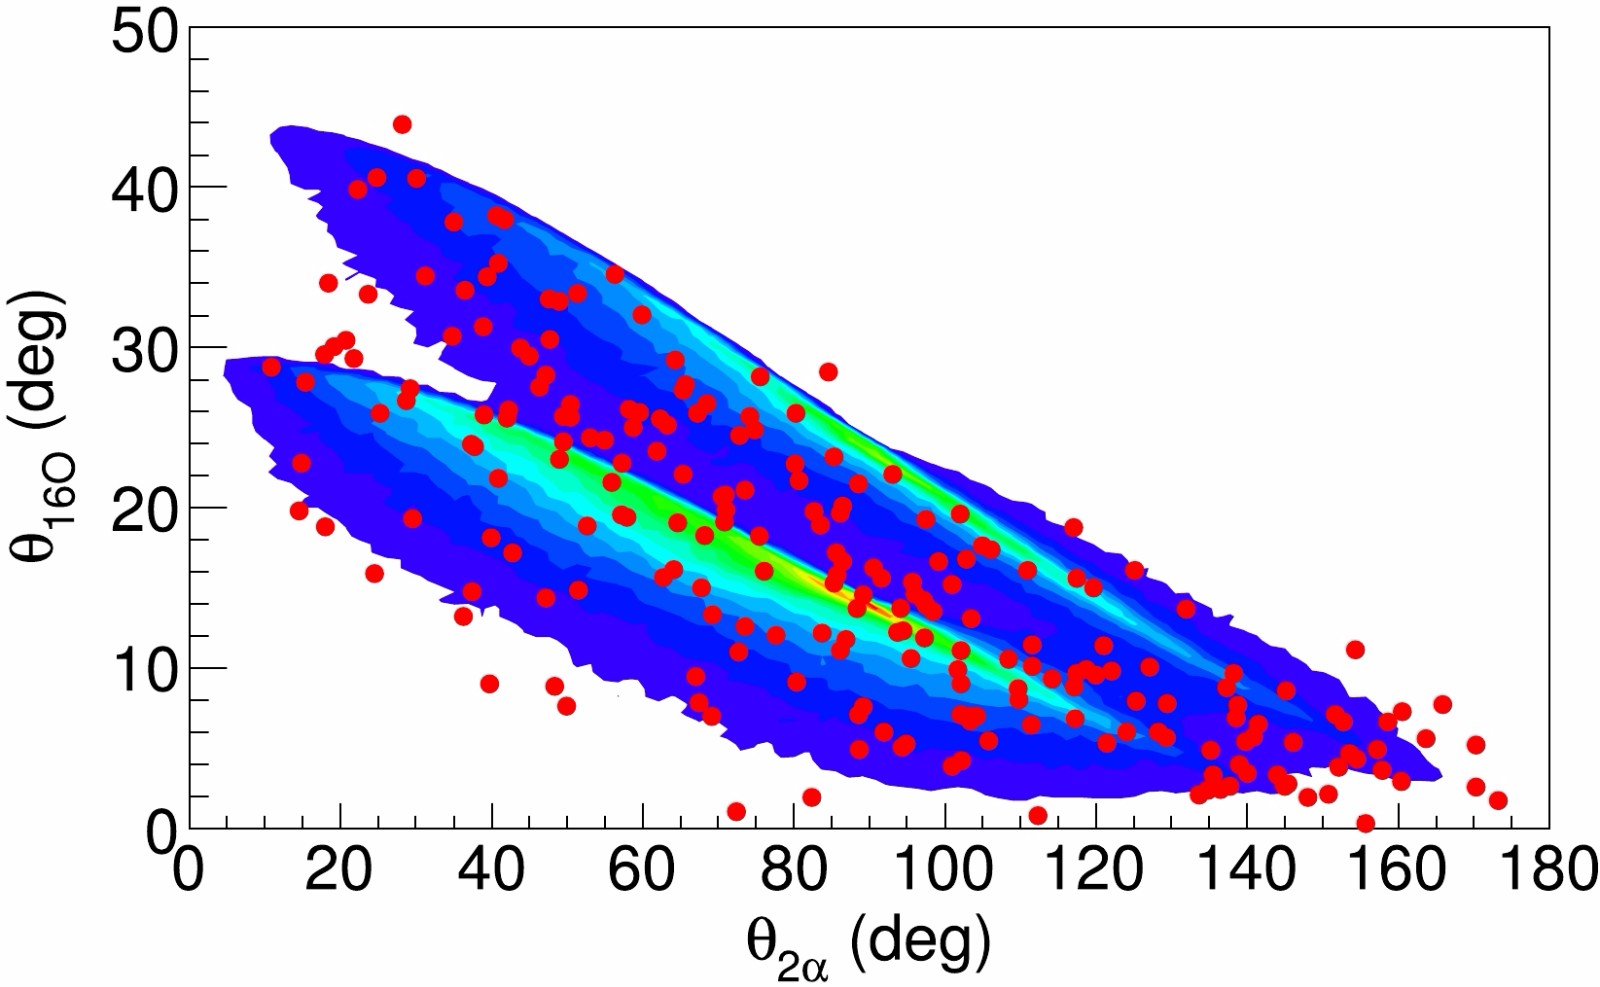
Figure 11.(color online) Spectrum of the angle of16O (
$\theta_{16{\rm O}}$ ) versus the opening angle between the twoαparticles. Data points are obtained from the measurement at 50 mbar. The simulation done in the 2αsequential decay mode and the experimental results are shown in contour and scattered points, respectively. The contours cover 95% of the total simulated events. -
It is also possible that twoαparticles are emitted together as a8Be which decays into 2αparticles. The traditional approach is to measure the energies and angles of the two emittingαs and then identify the8Be cluster with the reconstructed relative kinetic energies of the 2αs [20]. Identification of8Be has also been reported simply based on the measurement of the polar angle between the twoαparticles [19] in the range fromEc.m.=17.5 to 34.5 MeV. The active target captures both16O and the twoαparticles with a 100% geometric efficiency with a nearly complete kinematic measurement. The only missing information is the energies of the twoαparticles which penetrate the active volume in the current experiment.
The simulated spectra of the16O angle versus the opening angle between the twoαs using the8Be emission mode are shown together with the experimental results inFig. 12. The states of the final residue,16O*, include the ground state and the excited states at 6.049, 6.13, 6.917, 7.116 and 8.872 MeV. States with higher excitation are not included because they decay by alpha emission. To investigate the contributions of different16O states, the spectrum is generated by gating theQvalue obtained with the detected range and the angle of16O. In total, we find 1 event that agrees with the simulation done using the ground state of16O, corresponding to 10
$ _{-8}^{+24} $ mb.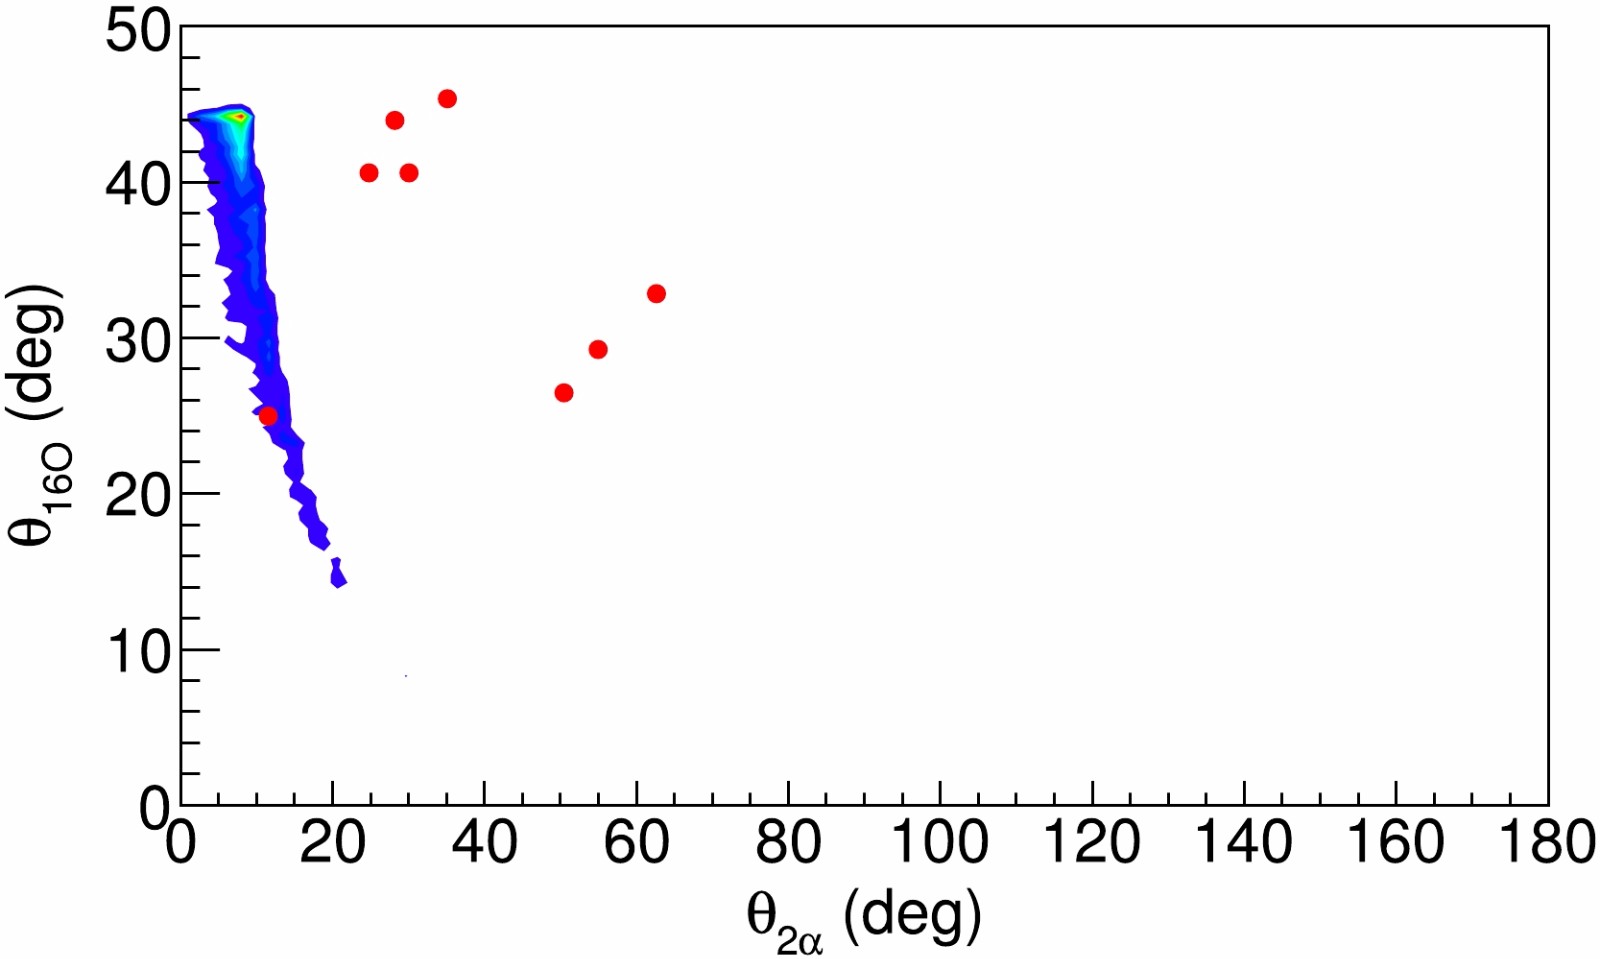
Figure 12.(color online) Spectrum of the angle of16O (
$ \theta_{16 \rm O} $ ) vs. the opening angle between the twoαparticles from8Be emission. The simulated and experimental results measured at 50 mbar are shown in contours and scattered points, respectively. A cut of abs (Q-value) < 1 MeV is applied to the experimental data.Our result is shown together with the cross section measurement by Čujecet al. [7] as the modifiedSfactor (
$ S^*=\sigma \cdot E \cdot {\rm exp}(87.21/\sqrt{E}+0.46E) $ ) inFig. 13. Considering12C(12C,8Be)16Og.s.a directα-transfer reaction, the cross section has been evaluated for theL=0 transfer in the distorted-wave Born approximation (DWBA) with the PTOLEMY program [28]. The optical-model potential (V=–50 MeV,W=–10 MeV,R0= 1.26 fm, anda=0.4 fm) is used in the DWBA calculation for ingoing and outgoing channels, which is taken from Ref. [7]. In the calculation, the node number of theα-cluster was set to 2 according to the shell model configuration. The product of the alpha spectroscopic factor was set to 0.03 according to the theoretical calculation [29]. Taking into account the identical nuclei in the entrance channel, an additional factor of 2 was applied to the calculated cross section to reproduce the calculation by Čujecet al. at energies around 5.5 MeV. In order to match with the experimental result at 2.93 MeV, the product of the spectroscopic factors needs to be scaled up by a factor of 500. However, our measurement agrees with the calculation using spectroscopic factors of 0.06, suggesting that12C(12C,8Be)16Og.s.is dominated by the directαtransfer process in the range of 3.13 to 12 MeV. The large difference between the experimental data and the DWBA calculation at lower energies indicates the possibility of new physics, e.g., the impact of the molecular structure in the entrance channel on the reaction mechanism. While the emulsion detection used in the Čujec experiment is unable to record the coincidence of twoαparticles in the time domain, TPC can detect8Be unambiguously by recording the full information with the large background of scattered12C particles. Therefore, this offers a new opportunity for investigating the interesting channel below 3.13 MeV and helping us achieve a better understanding of the formation of8Be clusters in the12C+12C reaction.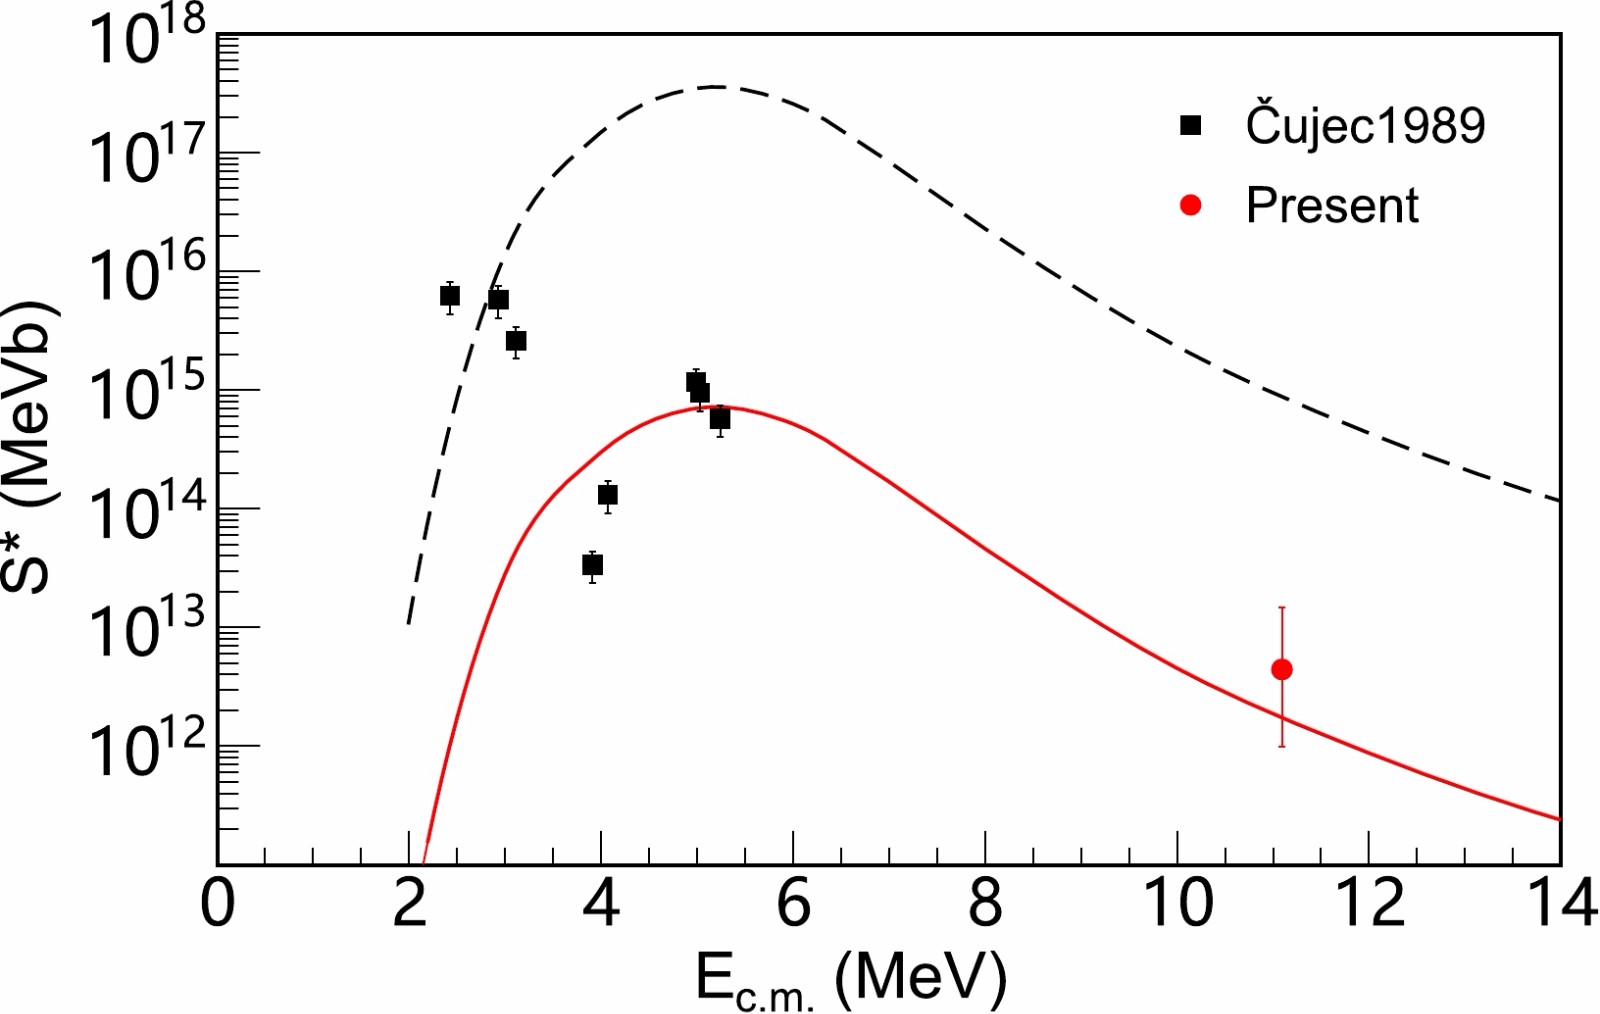
Figure 13.(color online) ModifiedSfactor (S*) of12C(12C,8Be)16Og.s.. Current measurements and those of
$\rm\check{C}$ ujuec are shown as red and black points, respectively. The red solid and black dashed lines are the DWBA calculations using the product of spectroscopic factors of 0.06 and 30, respectively. -
The complicated 3αchannel can be easily identified against other contaminants by visualizing theαtracks together with the fusion residues in TPC. Our result is presented inFig. 14. At energies aboveEc.m.=19 MeV, our result tends to agree with the result of Kolata
$ {et\ al.} $ [21]. Both measurements are consistent with the Empire calculation and support the explanation of fusion evaporation. Although the cross section of this channel is at the level of 100 mb at energies above 20 MeV, which is about 10% of the total fusion cross section, it has been ignored in the12C+12C total fusion due to the technical challenge involved [21,30]. Our measurement provides valuable data for the complete fusion cross section and our statistical model calculation proves the dominant contribution to be from the fusion evaporation reaction.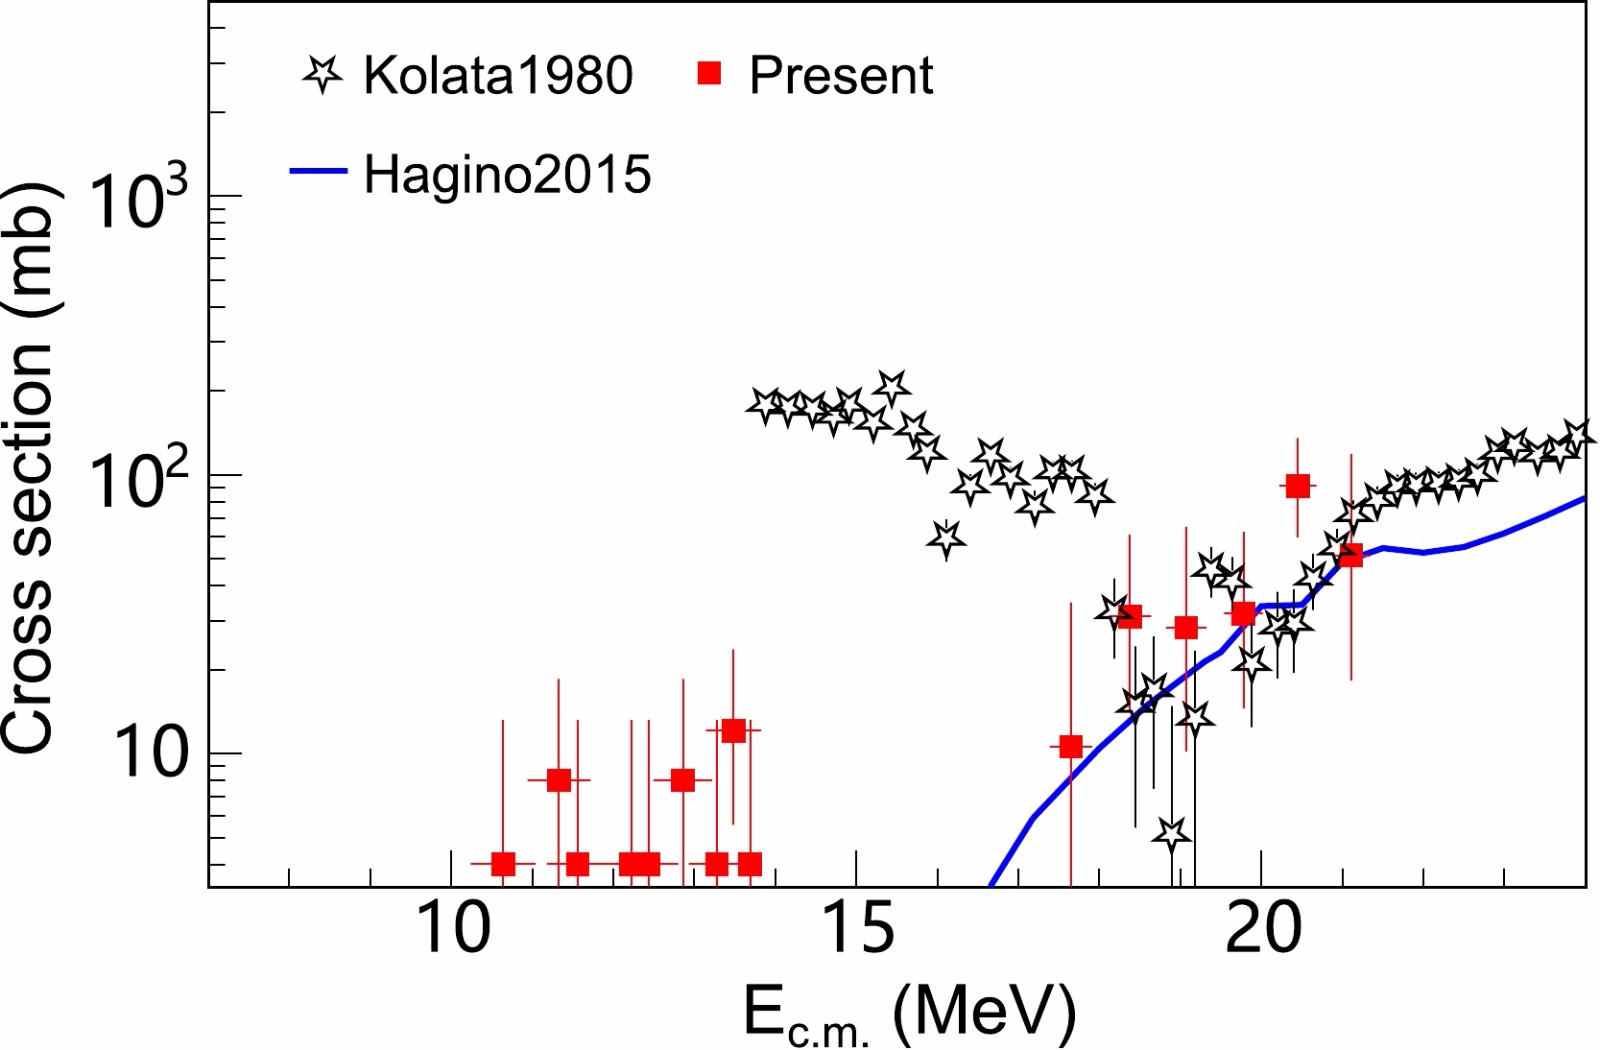
Figure 14.(color online) Comparison of experimental 3α-emission cross sections with the statistical calculation. Red squares: experimental data obtained with pMATE TPC. Black stars: experimental data measured by Kolata et al [5]. Blue line: Prediction of the fusion evaporation model calculated using EMPIRE. The total fusion cross section by EMPIRE is normalized to the calculation in Ref. [23].
At energies belowEc.m.=19 MeV, the abnormal trend reported in Ref. [6] is replaced by much lower 3αcross sections and the localized minimum near 19 MeV disappears. AtEc.m.< 15 MeV, we still find some 3αevents with a cross section at the level of 10 mb while the Empire calculation predicts a vanishing cross section. Considering that the cross section of inelastic scattering up to the 4.44 MeV of12C is in the order of 100 mb around 15 MeV [5], the 3αevents may indicate the possible contribution of a direct reaction other than fusion evaporation, such as the proposed inelastic scattering leading to 0+(7.654 MeV) and 3-(9.641 MeV) [4]. As the statistics of the current measurement are rather low and the kinetic energies of theαparticles are missing, a follow-up measurement with better statistics will be useful in reconstructing the unbound states of the break-up 3αevents, providing decisive evidence for the direct reaction component.
-
The12C+12C fusion reaction was studied in the range of
$ E_{\rm c.m.} $ =8.9 to 21 MeV using the active-target Time Projection Chamber. Due to full information on all tracks of the reaction products, the cross sections of the12C(12C,8Be)16Og.s.channel and the12C(12C,3α)12C channel were measured down to ~10 mb. The12C(12C,8Be)16O reaction channel is determined to be 10$ _{-8}^{+24} $ mb at$ E_{\rm c.m.} $ =11.1 MeV, supporting the directαtransfer reaction mechanism. The12C(12C,3α)12C reaction channel was studied for the first time using an exclusive measurement. Our measurement does not confirm the anomaly behavior reported in the previous inclusive measurement. Our comparisons with the statistical model calculations suggest that the 3αchannel is dominated by the fusion evaporation process at$ E_{\rm c.m.}> $ 19 MeV. The additional contribution of the 3αchannel increases the fusion reaction cross section by 10% at energies above 20 MeV. We also find that an additional reaction mechanism is needed to explain the measured cross section at$ E_{\rm c.m.}< $ 15 MeV at which point the statistical model prediction vanishes.The techniques developed in this work provide a new opportunity for studiyng difficult reactions such as12C(12C,8Be)16Og.s.at
$ E_{\rm c.m.}< $ 3 MeV and fusion reactions involving radioactive ion beams. Compared with traditional detectors and techniques in nuclear physics, the main advantage of the pMATE TPC detector is the extremely high efficiency and its capability of simultaneous detection of multiple charged particles. In the active-target mode, reaction cross sections can be measured over a wide energy range down to a few milibarn with a beam intensity of ~ 100 particles per second. Motivated by this unique opportunity provided by TPC, fusion reactions induced by neutron-rich isotopes will be started in the future, which is very difficult using traditional detectors due to their low-intensity radioactive beams. -
The authors thank the HIRFL operation staff for providing beams during the experiment.
Studies of the 2αand 3αchannels of the12C+12C reaction in the range ofEc.m.=8.9 MeV to 21 MeV using the active target Time Projection Chamber
- Received Date:2022-05-25
- Available Online:2022-10-15
Abstract:The12C+12C fusion reaction was studied in the range ofEc.m.=8.9 to 21 MeV using the active-target Time Projection Chamber. With full information on all tracks of the reaction products, cross sections of the12C(12C,8Be)16Og.s.channel and the12C(12C,3α)12C channel could be measured down to the level of a few milibarns. The12C(12C,8Be)16Og.s.reaction channel was determined to be 10


 DownLoad: